BITCOIN This is what separates 128k from 104k.Bitcoin (BTCUSD) just broke above its 1D MA50 (blue trend-line) for the first time in 2 weeks and only days after it got rejected there. A 1D candle closing above it will be a strong bullish signal.
As BTC has been trading within a Megaphone pattern similar to the December 2024 - April 2025 one, a closing above the 1D MA50 might put the structure in a similar situation as April 17. As you can see that Megaphone also had a 1D MA50 rejection preceding the break-out and before that also, two Lower Lows near the 1W MA0 (red trend-line).
What it hasn't had (so far?) is a clear touch of the 1W MA50 (as on April 07) and a 1D MACD Higher Lows Bullish Divergence.
As a result, both scenarios are open for now. Until it closes above the 1D MA50, a 1W MA50 test remains possible around $104000. A closing above the 1D MA50 though strengthens the probability of a 1.1 Fibonacci extension rally at $128000.
What do you think is more likely to happen? Feel free to let us know in the comments section below!
-------------------------------------------------------------------------------
** Please LIKE 👍, FOLLOW ✅, SHARE 🙌 and COMMENT ✍ if you enjoy this idea! Also share your ideas and charts in the comments section below! This is best way to keep it relevant, support us, keep the content here free and allow the idea to reach as many people as possible. **
-------------------------------------------------------------------------------
💸💸💸💸💸💸
👇 👇 👇 👇 👇 👇
1-BTCUSD

BITCOIN - PUMP BEFORE THE DUMP?Traders,
Last time I talked about arbitrage inefficiencies between spot and perps. I expected a dip first, then a corrective move up. That view still stands — but I also expected a sweep up before the bigger move down.
In my earlier notes I called for a sweep to clean the Sunday low, followed by a move back toward 120–122k with a short squeeze.
That scenario is now in play.
I planned to long near 109.350, after the sweep, and only if the data aligned with my thesis.
What I projected vs what happened
Sweep the Sunday lows, then squeeze up.
Wait for the sweep and only enter if the data confirms around 109.550. Entered 109.550 once multiple signals lined up.
Why I entered at 109.550
Stablecoin-margined CVD
First pass: Stablecoin Margined CVD made a lower low while price made a higher low → hidden bullish divergence. Aggressive sellers were getting absorbed by resting bids.
Second pass: Stablecoin Margined CVD made a higher low while price made a lower low → selling pressure fading, buyers absorbing again.
Coin-margined CVD
Coin Margined CVD kept making lower lows while price refused to follow → another hidden bull div. Shorts were leaning in, but passive buying held firm.
Spot CVD
Lower lows on CVD while price held flat or slightly higher → trapped aggressive sellers, absorbed by steady passive spot buyers.
On Binance Perp Order Flow we could also see a regular bullish divergence into a smaller hidden bull div at the sweep — a clean reversal setup.
Open Interest read
Here’s where many traders miss the nuance. There are two main perp types on Binance and most major exchanges:
Coin-margined contracts: collateralized with the underlying asset (e.g., BTC). Profits and losses are settled in BTC. Stablecoin-margined contracts: collateralized with a stable asset (e.g., USDT or USDC). Profits and losses are settled in dollars.
This matters because the behavior and risk exposure of traders differ between the two:
When coin-margined OI goes down, it usually means BTC-collateral traders are closing positions or getting liquidated. They’re forced to sell BTC to cover margin, which can create short-term downside pressure.
When stablecoin-margined OI goes up at the same time, it often means new traders are entering positions with USDT collateral. That capital rotation usually signals fresh directional bets, often late shorts piling in after a move down.
So when price stops making new lows while stablecoin OI keeps climbing, it’s a clear sign the market is loading up on shorts, but without continuation. That mismatch is short-squeeze fuel. Combine that with the CVD divergences above and it paints a strong case for a move back into overhead liquidity.
Supplementary edge
1H RSI bullish divergence: RSI makes higher lows while price makes lower lows → loss of downside momentum, suggesting sellers are tiring.
USDC.D and USDT.D bearish divergences: Stablecoin dominance charts make higher highs while RSI trends lower → stablecoin demand weakening. When that happens, capital tends to rotate back into BTC and risk assets, reinforcing the long bias.
Broke above daily VWAP
Together, these add extra confluence to the squeeze setup.
Plan, target, invalidation
Target: 122 area (blue box).
At target: watching for rising price with fading delta, sell imbalances near highs, and absorption signals — that’s where I’ll start hunting shorts and let the market cool off. Invalidation: acceptance back below the Sunday sweep low with expanding negative delta and rising OI on the breakdown. That would kill the squeeze thesis.
Summary:
A clean sweep → multi-CVD bullish divergences → absorption → rising OI imbalance → RSI & VWAP confluence. All aligning for a controlled short squeeze toward 122k, before the market potentially resumes its broader corrective path.
Does this mean we 100% go up? No. Markets don’t promise: they whisper. You listen, you align, and you risk what you can afford to be wrong about.

BTC recovers before interest rate announcementBitcoin (BTC/USD) – Daily Chart Analysis
Bitcoin is currently trading around the 114K–115K zone after rebounding from the ascending support trendline near 108K. This reaction confirms that buyers are still defending the broader bullish structure, but significant resistance lies ahead.
Key Observations:
Resistance Zone (117K–118K):
This area has acted as a strong supply zone in the past, where price was previously rejected twice (marked by red arrows). It also aligns with the EMA 89 and volume cluster, making it a critical barrier for bulls.
Support Zone (108K–102K):
The lower trendline and horizontal support near 102K–104K remain vital for the long-term bullish structure. A break below this region would open the door for deeper correction toward 100K.
EMA Confluence:
The short-term moving averages (EMA 34 and 89) are attempting to turn upward, suggesting early signs of recovery—but confirmation requires a daily close above 118K.
Possible Scenarios:
Bullish Case:
If BTC successfully breaks and closes above 118K, momentum could accelerate toward 127K–128K, where the upper trendline and major resistance coincide.
Bearish Case:
If price faces rejection at the 117K–118K zone, a retest of 108K, or even 102K, is likely before the next major move.
Outlook:
Bitcoin remains in a neutral-to-bullish phase short term, but traders should closely monitor the 117K–118K resistance for potential rejection or breakout confirmation.

DeGRAM | BTCUSD broke the dynamic resistance line📊 Technical Analysis
● BTC/USD has broken above its dynamic resistance line, signaling a shift toward bullish momentum after consolidating near the 110K zone.
● A potential retest of 114K–115K could act as a springboard for continuation toward the key 118K resistance, aligning with the upper channel boundary.
💡 Fundamental Analysis
● Bitcoin’s rally is fueled by ETF inflows and renewed institutional demand, while easing U.S. inflation expectations support risk-on sentiment.
✨ Summary
● Long bias above 114K; targets 118K. Bullish breakout and improving fundamentals favor medium-term upward continuation.
-------------------
Share your opinion in the comments and support the idea with a like. Thanks for your support!

H&S on BTC accompanied by rejection from IDT (still forming)Bearish signal for further declines on crypto
Weakening volumes on the short up move

$BTC Low is in?BTC moved higher over the weekend due to positive trade talk news as indices gapped up to new highs.
Price is moving into resistance zone here. Are we going to see a gap and go? IMO, too early to tell, I might be wrong, but we could see a final flush down to 100k or an overshoot lower to 90k, before a move higher.

Technical Analysis – Bitcoin CME Futures (BTC1!)Technical Analysis – Bitcoin CME Futures (BTC1!)
Date: October 27, 2025 | Timeframe: Weekly | Exchange: CME Group
1. Trend Overview and Price Structure
Bitcoin CME Futures are trading at $115,090, up +3.69% for the week.
After nearly six months of consolidation between $100,000–$115,000, the current setup indicates an ascending triangle formation nearing completion — signaling a potential major breakout toward the end of Q4 2025.
The medium-to-long-term trend remains firmly bullish, supported by a strong accumulation base following the uptrend from the $38,000 low (June 2023).
Technical upside targets after a confirmed breakout: $127,300 → $141,800 → $156,700.
2. Key Technical Price Levels
Resistance: 127,300 – 141,800 – 156,700
Support: 113,500 – 105,000 – 95,800
3. Detailed Technical Analysis
(1) Short-Term Trend
The third bull-flag pattern since 2023 is developing. Bitcoin has closed above its 20-week EMA for 11 consecutive weeks, confirming structural bullish momentum. Short-term bias: Uptrend continuation, targeting $127,300 over the next 3–5 weeks.
(2) Volume Analysis
CME trading volume rose 22% versus the 4-week average. Institutional positioning (COT Report) shows net long positions up by 8,500 contracts — the highest level since March 2024.
(3) Elliott Wave Structure
Wave 1: 38,000 → 77,500
Wave 2: Correction to 63,000
Wave 3: Expansion to 118,000
Wave 4: Sideways consolidation (100,000–115,000)
Wave 5: Target zone 140,000–156,000
(4) Momentum Confirmation
RS vs S&P 500 continues to strengthen. MVRV Z-score: +1.95 — still below overbought territory, allowing an additional 25–30% upside.
4. VNC– Strategic Commentary
Market Context
The Bitcoin market is underpinned by three structural drivers:
- Strong ETF Inflows: According to Bloomberg ETF Flow (Oct 24), spot Bitcoin ETFs saw $2.8 billion in net inflows over 10 days, the highest since their early 2024 launch.
- Monetary Easing by the Fed: The Federal Reserve has hinted at a 0.25% rate cut in December 2025, reigniting risk-on sentiment in digital assets.
- Tight Supply Dynamics: Post-2024 Halving, block issuance fell 8%, while whale cold storage activity hit a 14-month high (Glassnode, Oct 25).
- Key Market Developments (Oct 12–27, 2025): - CME Group (Oct 25): Bitcoin futures open interest hit $7.42B, up 9% WoW. Bloomberg (Oct 23): Fed expected to cut rates in December; crypto assets responded positively. CoinDesk (Oct 22): Exchange stablecoin ratios rose 10%, signaling incoming liquidity. Glassnode (Oct 20): Wallets holding over 10,000 BTC increased 3.4%, showing institutional accumulation. Reuters (Oct 19): Tech investment funds are reallocating 16% of new risk-on capital back into crypto.
VNC Intelligence Assessment (BI View)
Short-Term (2–3 weeks): Sideways range $112,000–$127,000, awaiting breakout confirmation.
Medium-Term (4–8 weeks): Upside target $141,800, driven by sustained ETF inflows.
Risks: Short-term USD rebound or ETF outflows if the Fed delays rate cuts.
5. Suggested Technical Strategies
Bullish Scenario (Preferred):
Entry: 113,500 – 115,000
Targets: TP1 127,300 | TP2 141,800 | TP3 156,700
Stop-Loss: 107,000
Probability: 80%
Rationale: Ascending triangle breakout supported by ETF inflows and institutional accumulation.
Bearish Counter-Scenario (Short-Term Profit Taking):
Entry: 156,000 – 157,000 (upon hitting projected wave 5 top)
Target: 141,800
Stop-Loss: 160,000
Probability: 20%
Rationale: Short-term profit-taking at Fibonacci extension resistance.
VNC Intelligence Summary: Bitcoin remains in a strong macro uptrend, supported by robust institutional participation and easing macroeconomic conditions.The ascending triangle pattern signals a potential mid-Q4 breakout, with ETF inflows acting as the key catalyst for price acceleration toward $140,000–$150,000.

GOLD rise?GOLD is consolidating. Making it's way to the RESISTANCE zone and then we will see if it will continue ranging or BreakOut going to the London and NY session.

Bitcoin Macro Map for 27 to 31 Oct 2025Macro map for 27 to 31 Oct 2025
Concentration of policy and inflation prints means policy expectations and real yields will drive the United States dollar, global equities, bitcoin, and gold. The hinge events are Wednesday FOMC, Thursday US GDP advance and German data, Friday US Core PCE and Chicago PMI. Secondary drivers are BoJ policy guidance and ECB tone, plus BoC.
Watch list
Real ten year yield and the DXY dollar index after FOMC and PCE
EUR front end versus USD front end after ECB and FOMC
VIX around the FOMC window and into PCE
US liquidity windows around 14:00 Eastern on Wednesday and 08:30 Eastern on Thursday and Friday
Bitcoin outlook for next week
Set up
At the weekly horizon bitcoin is still a beta expression on global liquidity and real yields rather than a pure inflation hedge. It reacts first to dollar and rates shifts that change marginal risk appetite. The FOMC and PCE prints therefore matter for direction even without a direct link to on chain activity. Weekday flow is led by United States hours while Asia sets the early tone on Monday.
Baseline view
If the policy path looks patient and Core PCE continues to glide lower, real yields edge down and the dollar eases. That mix opens the door for crypto beta to catch a bid. A hawkish tilt or a hot PCE does the opposite. Structural ownership by spot products reduces downside jump risk compared with prior cycles, yet high leverage pockets still create sharp intraday tails.
Scenarios and probabilities
Range continuation inside the recent multi month band. Probability fifty. Triggers are offsetting signals across FOMC, GDP, and PCE. Expect false breaks around event minutes with reversion toward the weekly mean.
Upside extension with rotation into high beta crypto. Probability thirty. Triggers are a patient Fed message and benign PCE. Watch for confirmation from a softer dollar and firmer US equities.
Downside flush that tests prior weekly supports. Probability twenty. Triggers are a hawkish statement or hot PCE that pushes real yields higher. Dollar strength and equity weakness would confirm.
Key levels and risk
Use round numbers at five thousand increments as decision points and the prior week high and low as risk guardrails. Funding flips and basis widenings are useful warnings into event hours. Manage exposure size during the two hour FOMC window and the Friday 08:30 Eastern data drop.

Long on EthereumWe are currently above the 50 EMA and 200 EMA.
Breaking out of the giant ascending triangle with a retest.
This could be a 4/5x from here with a top target of approximately $20,000 per ETH.
I’ll be long Ethereum until we hit or get close to the price action trendline.

BTC/USD 1H chart short-term📊 Market structure:
• Current price: ~$113,300
• Trend: A short-term uptrend - evidenced by rising lows and rising highs, as well as price remaining above the black trendline.
• The chart shows Bitcoin testing resistance at $114,089, following a strong breakout earlier.
⸻
🧭 Key Levels:
Resistances (green lines):
1. USD 114,089 – the closest resistance that the price is currently testing.
2. USD 116,057 – another strong resistance, potential target after breakout.
3. USD 118,681 – main resistance level from the higher time frame (H4/D1).
Support (red lines):
1. USD 112,156 – first local support (close to the trend line).
2. USD 109,567 – medium-term support, key to maintaining the growth structure.
3. $107,702 – Strong support where institutional buy orders are likely.
⸻
📈 Trendline:
The black upward trendline leads through the recent local lows.
➡️ As long as the price stays above it, the trend remains bullish.
➡️ Breaking this line down would be the first signal of a weakening trend and a correction towards USD 112,150-111,000.
⸻
⚙️ Stochastic RSI (bottom indicator):
• Currently starting to move down from overbought levels (above 80).
• This indicates a possible short-term downward correction or consolidation.
• If the indicator drops below 40 while keeping the price above the trendline, it may be a good opportunity to go long again.

Bitcoin: There Are Better Prices To Buy.Bitcoin bounce to 113K resistance, which I previously described as a more relevant area to watch for being that it is in the middle of the range. IF momentum continues from here, the 116K to 118K area resistance is the next potential inflection point to prepare for. IF price confirms a bearish reversal at the current level of 113K, there is a minor support at 109K to watch for a bullish reversal. Either way, Bitcoin has not changed much in terms of structure, it is still in a broader bullish consolidation which means a breakout into the 130Ks is still within reason over the coming weeks.
For this reason, support levels should be given more priority and higher expectation, while resistance levels should be considered more likely to break. The key to timing these turns is WAITING for price action to confirm in some way. For example, 113K previously saw a swift rejection, but at the moment is sitting strong. While this level may be a bearish inflection point, there is NO reason to sell anything because there is no confirmation. A bearish pin bar or inside bar would be something to look for IF you were interested in an aggressive short. Otherwise it is best to stay out of Bitcoin's way in my opinion.
On top of that, it is important to pay attention to the current economic environment. The Federal Reserve is expected to cut rates by 25 basis points on Wednesday, also again in December. Plus Chairman Powell has signaled that they are going to begin their balance sheet "expansion" or quantitative easing efforts. This means printing money in the face of an elevated inflationary situation. I am not an economist, but it sounds like we are going to be swimming in cheap money very soon which can only be a positive for any type of anti inflationary asset like Bitcoin.
While we can easily see brief pull backs come out of no where, there is very little to support any type of bearish argument in the broader sense. I believe buying pullbacks still offers a higher probability and better reward/risk. This means watching for attractive levels like the 109K and 105K areas Or if price breaks higher, watch old resistance levels to act as new supports (like the 118K area IF 120K is reached again). Either way, make sure to wait for confirmations, and define risk from there.
Thank you for considering my analysis and perspective.

BTCUSDT TradeI when trading in IG:BITCOIN try come to breakeven in big candle for again entry buy or sell.
But you need fix target or trailing stop on new swing in profit.
Please have risk management.

BTC LONGBitcoin broke above EMA100 with strong volume — confirming a bullish trend shift on the 4H chart.
Now the key is watching for a retest near 113k before continuation to 114k–117k.
EMA structure is turning bullish — but if BTC loses 111k, it may signal a false breakout. 🚀
#Bitcoin #CryptoTrading #BTCAnalysis #BitcoinBreakout

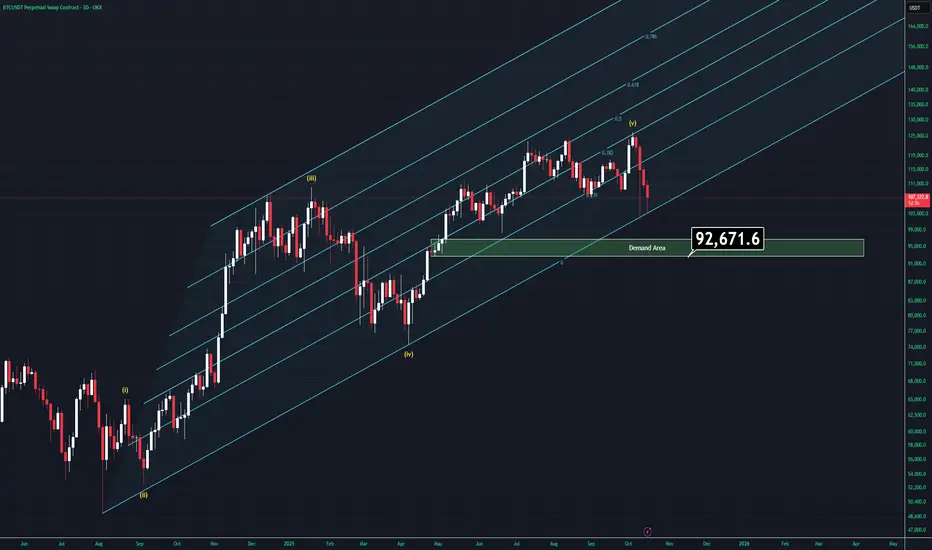
Moment of Fate - BTC Analysis (3D)There are many reasons to go up but also going down is starting to look way more charming than ever right now.
Let's examine what we have;
-FED is about to cut rates for a second time but we'll most likely to see another rate cut in december which is bullish af.
-All companies are keeping buying Bitcoin more and more which is kinda good but might be a problem for decentrlation of Bitcoin.
-US is more likely to bring more regulations about stablecoins which will effect positivly Bitcoin.
On the other hand;
-China and US are still faceing a trade war even if they state othervise.
-ETF's are not buying Bitcoin as much as they did last year.
-US and Venezuela might have a conflit very soon.
-Israel-Hamas and Russo-Ukraine wars hasn't actually over yet.
-Gold is going on god mode.
-DXY is trying to recover in weekly timeframe but is less likely due to rate cuts.
-Elliot wave theory tells us that we might actually be in the A-B-C correction cycle.
-Volume is decreasing, which is bad and supports the Elliot waves.
- Trendline support is about to be lost (Tried to break it twice in a week).
-There is a CME gap left around $92K
Well, all we have to do is, combining the factors.
If BTC breaks below the supportive trendline we will most likely drop through demand zone which is highlited in the chart. If US and China makes peace (less likely), Bitcoin actually has real reasons to try a new all time high.
The main point is simple: Wait for one of two things to happen:
Either the trendline will be broken and we'll see below the $100K, which will give us new opportuinites.
Or, Bitcoin recovers $118400 and the entire bearish senario would be invalidated and Bitcoin goes like crayz again.
Thank you for reading.
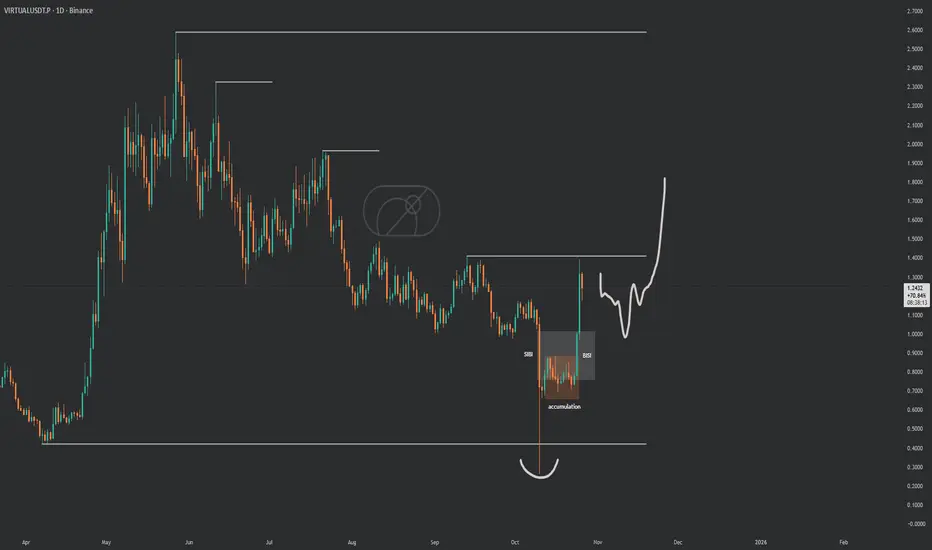
$VIRTUAL got that clean range clean price actionSPARKS:VIRTUAL got that clean range clean price action straight textbook accumulation. Lot of coins looking just like this, coiling up for the first real upside blast !If it dips to hand us $1, that's the golden entry.
new month watch list : SEED_WANDERIN_JIMZIP900:ASTER AMEX:XPL SPARKS:VIRTUAL
Inside the channel and Flies.If you look at market patterns and Bollinger bands, price always goes from high volatility to price discovery, tightens. Market shows clear direction, ie 🟢 or 🔴.
The same when using longterm charts, they fluctuate and you can almost find where the important channel gonna be.
It's psychology.
85% bullish. 15% it fails, imo.:)

USDT.D – 4H Technical Summary (Oct 26, 2025)USDT.D – 4H Technical Summary (Oct 26, 2025)
Structure: USDT Dominance has broken below the short-term BOS (Break of Structure) after multiple rejections from the premium zone, indicating a potential shift from bullish to bearish momentum.
Price Action: The dominance failed to hold above Equilibrium (≈4.84%) and is now trading toward the discount zone, signaling risk-on sentiment across crypto assets.
Moving Averages: Price is currently testing below the EMA89 (blue) while the EMA200 (yellow) sits near 4.70% — a key area for reaction. A clean break below this confluence would reinforce further downside.
Liquidity Zones:
Immediate support: 4.70% (discount / EMA confluence)
Next target: 4.40% – 4.20% (strong demand & previous accumulation zone)
Resistance: 4.90% – 5.00% (equilibrium retest / prior supply)
Momentum: The stochastic oscillator remains in the oversold region, hinting at a possible short-term bounce, but structure favors continued downside after retracements.
Trading Plan:
Bias: Bearish – expecting further decline in USDT dominance.
Scenario: Watch for minor pullback to 4.85% – 4.90% to confirm rejection before continuation lower.
Targets: 4.70% → 4.40%.
Invalidation: Sustained move back above 5.00%.
➡️ Outlook: Weakening USDT dominance supports bullish continuation for Bitcoin and altcoins as capital rotates out of stable assets into risk-on markets.

BTCUSDT – 1H Technical Summary (Oct 26, 2025)Structure: Bitcoin continues to respect the ascending channel, showing consistent higher highs and higher lows — confirming bullish structure.
Liquidity: Price broke above PDH (~112,800) and tapped into the premium / weak high zone (~114,000), suggesting buy-side liquidity has been taken.
Momentum: Strong bullish impulse candle with high volume; stochastic in the overbought zone → possible short-term consolidation before continuation.
Key Levels:
Support: 111,800 – 112,000 (Equilibrium / PDH retest zone)
Resistance: 114,000 – 115,000 (premium supply area)
Trading Plan:
Look for pullback buys near 112,000 – 112,500 zone.
Targets: 114,800 → 116,000 → 118,000 (channel top / PWH).
Stop-Loss: Below 111,000 (below structure & equilibrium).
➡️ Bias: Bullish – favoring buy setups on pullbacks while price stays above 111K support.

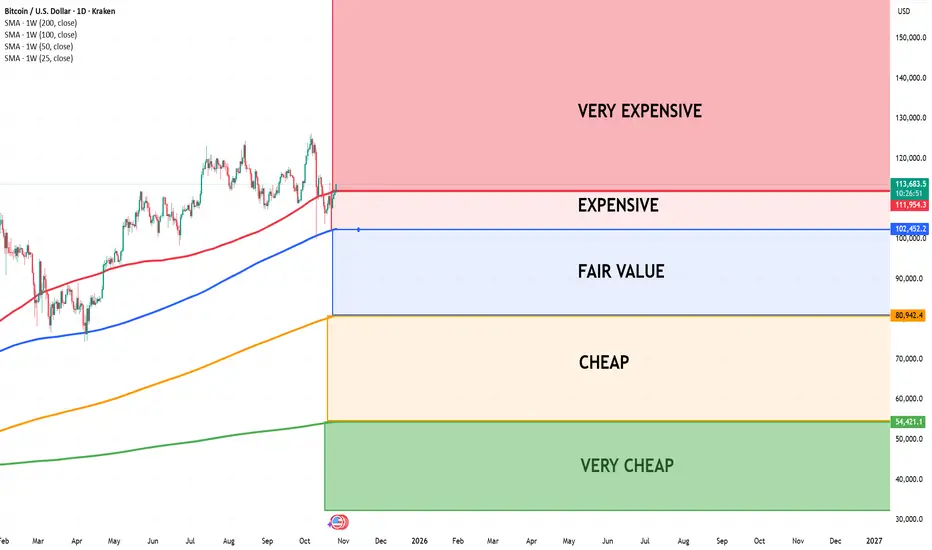
Bitcoin entering Very Expensive areaI use four key Moving Averages — the 25W, 50W, 100W, and 200W — to assess whether Bitcoin is overvalued or undervalued.
Bull Market Strategy:
When Bitcoin touches the 50-week Moving Average (50W MA) during a bull market, it often represents its fair value — typically an excellent buying opportunity.
Expensive Zone:
When Bitcoin trades above all four moving averages (25W, 50W, 100W, 200W), it enters the expensive zone. In this phase, we can usually expect a short-term continuation upward, followed by a pullback to retest or cross below some of the averages.
Bear Market Strategy:
During bearish periods, patience is key. The best long-term entry opportunities often occur when Bitcoin drops below the 200-week Moving Average (200W MA) — historically marking undervalued territory.
Based on current cycles, this scenario may unfold again around 2026.
$BTC SUNDAY UPDATE: I’m still holding my short positions.CRYPTOCAP:BTC SUNDAY UPDATE:
I’m still holding my short positions. We already dumped a lot, but the price has bounced back and is now trading around $113K. As mentioned earlier, if Bitcoin holds above $110K, there’s strong resistance around $113.5K. A clear breakout above that level could push the price toward $115K–$117K, where I’ll be adding more shorts. For now, I’m staying patient and still targeting a move below $100K in the coming weeks if momentum fades again.

ETH Support Holding, But Cracks ShowingAs long as CRYPTOCAP:ETH holds the key support zone, the overall structure remains bullish and there’s nothing to worry about.
However, the technical setup is starting to weaken, a break below this support could turn things ugly, especially for altcoins.
DYOR, NFA
#PEACE
Thanks for reading! Appreciate your support and engagement 🙏

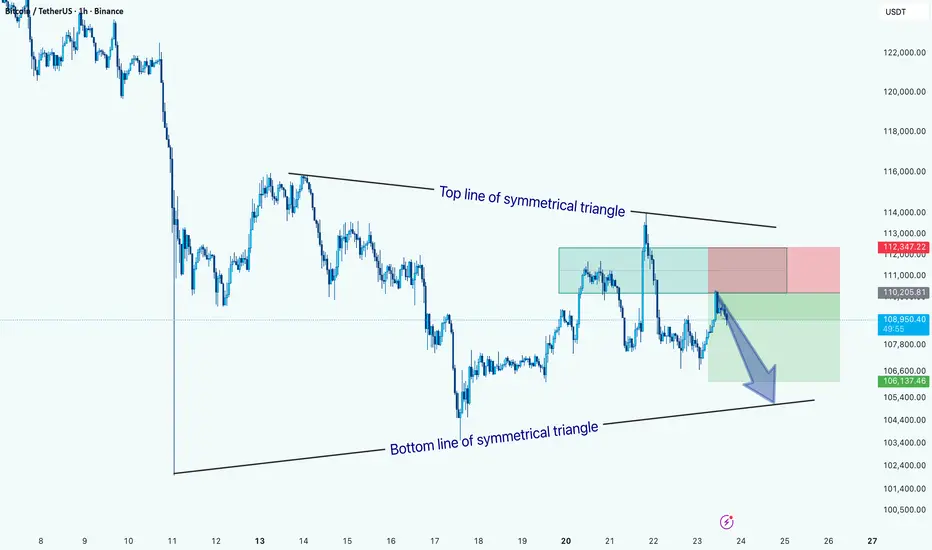
BTC/USDT: Symmetrical Triangle Signals Potential Downside MoveHi!
The price action is currently forming a symmetrical triangle pattern, marked by converging trendlines, the top line showing lower highs and the bottom line showing higher lows.
At present, BTC is trading near the upper half of the pattern but has recently faced rejection from the top trendline, indicating potential bearish pressure. The highlighted setup suggests a short position targeting a move toward the bottom boundary of the triangle around $106,000–$105,500, with a stop loss near $112,300.
A confirmed break below the lower trendline could accelerate bearish momentum, while a breakout above the top line would invalidate this bearish scenario and signal possible trend reversal.
Bias: Bearish within the symmetrical triangle until a clear breakout occurs.
Key Levels:
Resistance: $112,300
Support: $106,000 / $105,500