BTCUSDT TradeI when trading in IG:BITCOIN try come to breakeven in big candle for again entry buy or sell.
But you need fix target or trailing stop on new swing in profit.
Please have risk management.
1-BTCUSD

BTC LONGBitcoin broke above EMA100 with strong volume — confirming a bullish trend shift on the 4H chart.
Now the key is watching for a retest near 113k before continuation to 114k–117k.
EMA structure is turning bullish — but if BTC loses 111k, it may signal a false breakout. 🚀
#Bitcoin #CryptoTrading #BTCAnalysis #BitcoinBreakout

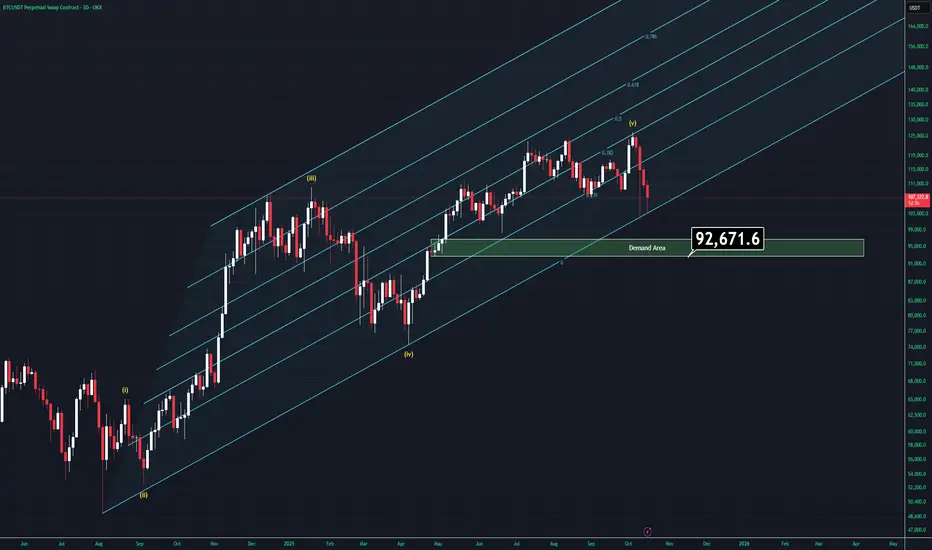
Moment of Fate - BTC Analysis (3D)There are many reasons to go up but also going down is starting to look way more charming than ever right now.
Let's examine what we have;
-FED is about to cut rates for a second time but we'll most likely to see another rate cut in december which is bullish af.
-All companies are keeping buying Bitcoin more and more which is kinda good but might be a problem for decentrlation of Bitcoin.
-US is more likely to bring more regulations about stablecoins which will effect positivly Bitcoin.
On the other hand;
-China and US are still faceing a trade war even if they state othervise.
-ETF's are not buying Bitcoin as much as they did last year.
-US and Venezuela might have a conflit very soon.
-Israel-Hamas and Russo-Ukraine wars hasn't actually over yet.
-Gold is going on god mode.
-DXY is trying to recover in weekly timeframe but is less likely due to rate cuts.
-Elliot wave theory tells us that we might actually be in the A-B-C correction cycle.
-Volume is decreasing, which is bad and supports the Elliot waves.
- Trendline support is about to be lost (Tried to break it twice in a week).
-There is a CME gap left around $92K
Well, all we have to do is, combining the factors.
If BTC breaks below the supportive trendline we will most likely drop through demand zone which is highlited in the chart. If US and China makes peace (less likely), Bitcoin actually has real reasons to try a new all time high.
The main point is simple: Wait for one of two things to happen:
Either the trendline will be broken and we'll see below the $100K, which will give us new opportuinites.
Or, Bitcoin recovers $118400 and the entire bearish senario would be invalidated and Bitcoin goes like crayz again.
Thank you for reading.
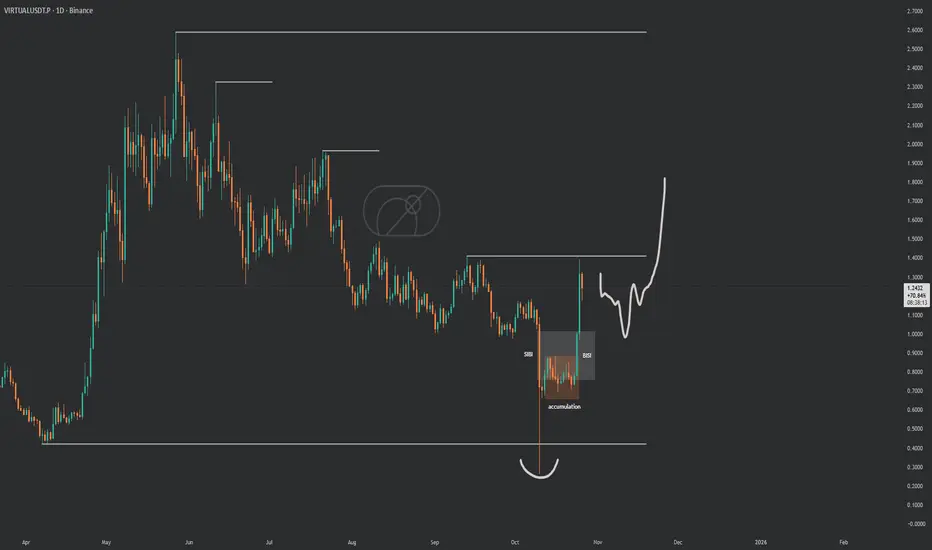
$VIRTUAL got that clean range clean price actionSPARKS:VIRTUAL got that clean range clean price action straight textbook accumulation. Lot of coins looking just like this, coiling up for the first real upside blast !If it dips to hand us $1, that's the golden entry.
new month watch list : SEED_WANDERIN_JIMZIP900:ASTER AMEX:XPL SPARKS:VIRTUAL
Inside the channel and Flies.If you look at market patterns and Bollinger bands, price always goes from high volatility to price discovery, tightens. Market shows clear direction, ie 🟢 or 🔴.
The same when using longterm charts, they fluctuate and you can almost find where the important channel gonna be.
It's psychology.
85% bullish. 15% it fails, imo.:)

USDT.D – 4H Technical Summary (Oct 26, 2025)USDT.D – 4H Technical Summary (Oct 26, 2025)
Structure: USDT Dominance has broken below the short-term BOS (Break of Structure) after multiple rejections from the premium zone, indicating a potential shift from bullish to bearish momentum.
Price Action: The dominance failed to hold above Equilibrium (≈4.84%) and is now trading toward the discount zone, signaling risk-on sentiment across crypto assets.
Moving Averages: Price is currently testing below the EMA89 (blue) while the EMA200 (yellow) sits near 4.70% — a key area for reaction. A clean break below this confluence would reinforce further downside.
Liquidity Zones:
Immediate support: 4.70% (discount / EMA confluence)
Next target: 4.40% – 4.20% (strong demand & previous accumulation zone)
Resistance: 4.90% – 5.00% (equilibrium retest / prior supply)
Momentum: The stochastic oscillator remains in the oversold region, hinting at a possible short-term bounce, but structure favors continued downside after retracements.
Trading Plan:
Bias: Bearish – expecting further decline in USDT dominance.
Scenario: Watch for minor pullback to 4.85% – 4.90% to confirm rejection before continuation lower.
Targets: 4.70% → 4.40%.
Invalidation: Sustained move back above 5.00%.
➡️ Outlook: Weakening USDT dominance supports bullish continuation for Bitcoin and altcoins as capital rotates out of stable assets into risk-on markets.

BTCUSDT – 1H Technical Summary (Oct 26, 2025)Structure: Bitcoin continues to respect the ascending channel, showing consistent higher highs and higher lows — confirming bullish structure.
Liquidity: Price broke above PDH (~112,800) and tapped into the premium / weak high zone (~114,000), suggesting buy-side liquidity has been taken.
Momentum: Strong bullish impulse candle with high volume; stochastic in the overbought zone → possible short-term consolidation before continuation.
Key Levels:
Support: 111,800 – 112,000 (Equilibrium / PDH retest zone)
Resistance: 114,000 – 115,000 (premium supply area)
Trading Plan:
Look for pullback buys near 112,000 – 112,500 zone.
Targets: 114,800 → 116,000 → 118,000 (channel top / PWH).
Stop-Loss: Below 111,000 (below structure & equilibrium).
➡️ Bias: Bullish – favoring buy setups on pullbacks while price stays above 111K support.

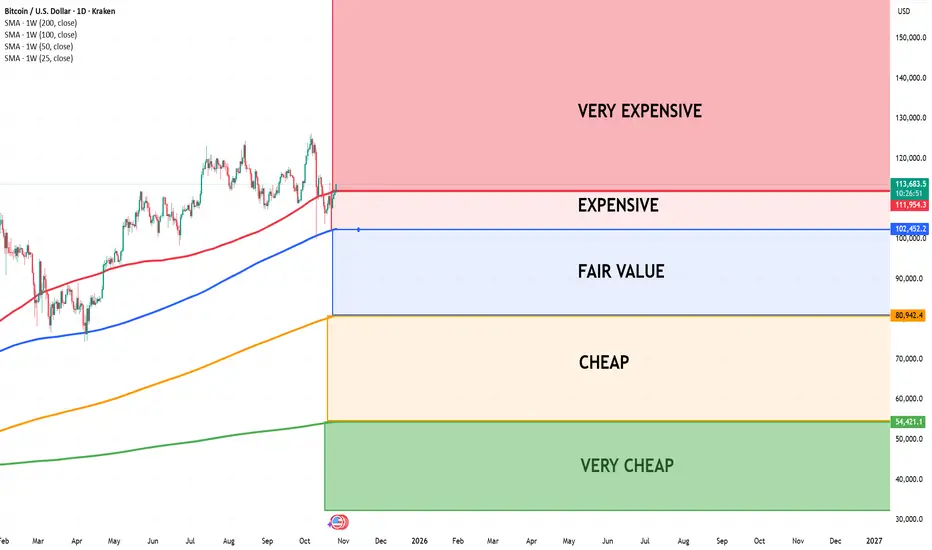
Bitcoin entering Very Expensive areaI use four key Moving Averages — the 25W, 50W, 100W, and 200W — to assess whether Bitcoin is overvalued or undervalued.
Bull Market Strategy:
When Bitcoin touches the 50-week Moving Average (50W MA) during a bull market, it often represents its fair value — typically an excellent buying opportunity.
Expensive Zone:
When Bitcoin trades above all four moving averages (25W, 50W, 100W, 200W), it enters the expensive zone. In this phase, we can usually expect a short-term continuation upward, followed by a pullback to retest or cross below some of the averages.
Bear Market Strategy:
During bearish periods, patience is key. The best long-term entry opportunities often occur when Bitcoin drops below the 200-week Moving Average (200W MA) — historically marking undervalued territory.
Based on current cycles, this scenario may unfold again around 2026.
$BTC SUNDAY UPDATE: I’m still holding my short positions.CRYPTOCAP:BTC SUNDAY UPDATE:
I’m still holding my short positions. We already dumped a lot, but the price has bounced back and is now trading around $113K. As mentioned earlier, if Bitcoin holds above $110K, there’s strong resistance around $113.5K. A clear breakout above that level could push the price toward $115K–$117K, where I’ll be adding more shorts. For now, I’m staying patient and still targeting a move below $100K in the coming weeks if momentum fades again.

ETH Support Holding, But Cracks ShowingAs long as CRYPTOCAP:ETH holds the key support zone, the overall structure remains bullish and there’s nothing to worry about.
However, the technical setup is starting to weaken, a break below this support could turn things ugly, especially for altcoins.
DYOR, NFA
#PEACE
Thanks for reading! Appreciate your support and engagement 🙏

BTC/USDT: Symmetrical Triangle Signals Potential Downside MoveHi!
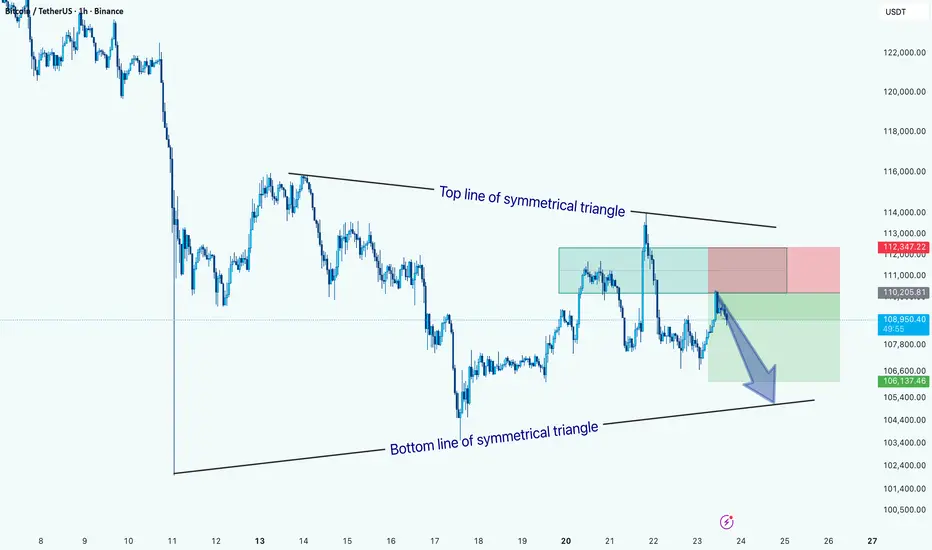
The price action is currently forming a symmetrical triangle pattern, marked by converging trendlines, the top line showing lower highs and the bottom line showing higher lows.
At present, BTC is trading near the upper half of the pattern but has recently faced rejection from the top trendline, indicating potential bearish pressure. The highlighted setup suggests a short position targeting a move toward the bottom boundary of the triangle around $106,000–$105,500, with a stop loss near $112,300.
A confirmed break below the lower trendline could accelerate bearish momentum, while a breakout above the top line would invalidate this bearish scenario and signal possible trend reversal.
Bias: Bearish within the symmetrical triangle until a clear breakout occurs.
Key Levels:
Resistance: $112,300
Support: $106,000 / $105,500
Bitcoin: Hopes on Fed cut lifts risk appetite?The posted inflation for September in the US showed some calming trend, around 0,3% for the month and 3,0% y/y. This increased market odds that the Fed will cut interest rates by 25bps at their meeting on October 29th. Although the trading week was a bit volatile, still Friday's inflation data brought back positive sentiment among investors. The price of gold dropped, with investors moving funds into US equity markets, however, the crypto market was lagging behind. Investors showed that they are still not ready to fully return back to risky assets.
During the week, the price of BTC was struggling to sustain the $110K level. The lowest weekly level was around $107K, while BTC is closing the week above the $111K. However, selling pressures around this level are still evident. The RSI took the uptrend, but still is unable to pass the 50 line. Moving averages of 50 and 200 days are converging toward each other, decreasing the distance between them, however, the potential cross is still on hold.
Based on current charts, the week ahead will show whether investors are ready to finally let go of fears and return their funds into the crypto market and BTC. Such a course of action will mean that BTC will finally find strength to move away from the $110K resistance. In the opposite direction, there is also an equal probability that support level at $108K and eventually $107K to be tested for one more time.

AIXBT Approaching Breakout Zone$AIXBT/USDT has fully recovered from the recent crash and is now trading near a key resistance, a level that previously acted as strong support.
If the price manages to close above this zone, it could trigger a massive upside move. Definitely one to keep a close eye on.
DYOR, NFA

BTC Easy Lond & 8 RR ProfitBTC Long Situation.
My Easy Plan, Trategy and Steps:
- New Daily Imbalances
- 4h Imbalance
- 15m Imbalance and second return to it
- 3m BOS & Imbalance
Result: is coming soon (already 6rr, you can take)

ETHUSDETH is forming a bullish flag pattern on top of a resistance level. We still have everything in place for a big upward movement. November tends to be a period of accumulation, leading to an upward movement in December. In other words, BTC tends to rise. BTC is currently accumulating in the range of 106,500k to 122,500k.

HYPE/USDT Price Heating UpGETTEX:HYPE is showing a nice bounce from the key support zone, holding that area quite well. The price is now approaching a minor resistance around the trendline.
If it manages to break and close above this line, we could see a strong upside move in the coming sessions.
DYOR, NFA
PEACE

BTCUSD Daily Structure — Liquidity Builds Inside the RangeBitcoin has sat inside a tight internal range for nearly two weeks — the question now isn’t where it breaks, but how traders position before it does.
⚙️ Context
BTCUSD continues to oscillate between 118.077 (range high) and 103.516 (range low) — the upper boundary of a broader bearish daily range.
Internally, price keeps printing higher lows, stacking short-term liquidity pockets beneath each new candle. Momentum remains contained,.
📈 Technical Map
Structurally, Bitcoin trades in a discount zone of this internal range.
Historically, this is where liquidity hunts often trigger — a short drive above prior highs before shifting lower again. Weekend trading brought a 2% move higher on light liquidity, hinting at early positioning ahead of the new week. For now, 109.758 remains the critical pivot. A daily close below it restores seller control; above it, liquidity still favors continuation higher.
🌐 Fundamental Pulse
Macro drivers remain centered on U.S. Dollar resilience, with traders eyeing upcoming economic data and Treasury supply dynamics.
The dollar’s tone this week could dictate whether Bitcoin’s range breaks with strength or simply reverts to mean.
Keep watch on yields, Fed commentary, and macro liquidity signals — subtle shifts there often precede technical confirmation here.
🧭 Plan
No prediction — only structure.
Maintain a range-based bias until a decisive daily close outside 118.0 or 103.5.
Execution focus: fade extremes, avoid middle noise.
🧘 Mindset
Professionals don’t chase breakout emotion — they measure compression, wait for resolution, and engage with precision.
Discipline isn’t boring; it’s profitable.
— CORE5DAN
Institutional Logic. Modern Technology. Real Freedom.

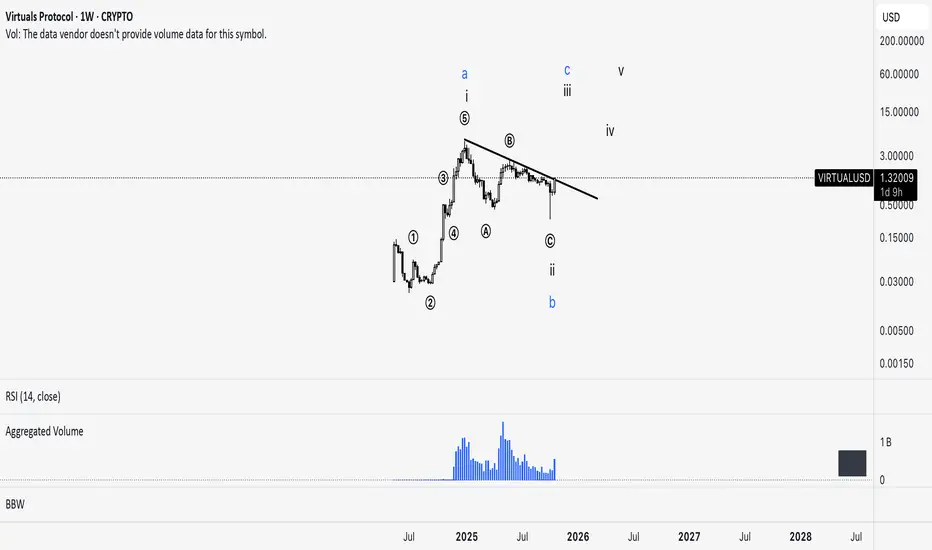
VIRTUALS – wave 3 in progress?VIRTUALS is currently trying to break through its downtrend line with increasing volume. The decline from January to October 2025 can be seen as an ABC zigzag forming wave 2 within a larger impulsive structure. Could this mean we’re just starting wave 3? The risk/reward ratio isn’t very favorable at the moment, but any pullbacks could be viewed as potential buying opportunities.
AITECH – parabolic advance soon?Trading doesn’t have to be difficult. Elliott Wave Theory provides clear, logical invalidation levels and targets. It also shows that the biggest and fastest profits usually come from wave 3 — especially from subwave 3 of wave 3. That’s the best possible setup. Is that exactly the situation we’re seeing on the AITECH chart? The risk is limited — stop loss at 0.018, with targets at 0.13, 0.26, and higher.

BTC Bottomed at $109,3542025-10-25 Daily Chart
BTC bottomed at $109.354, and is ready to move higher.
2RL 118,993
1RL 114,080
0CL 109,354
1SL 106,555
2SL 103,605

Bitcoin Technical Outlook (update)📉 Stage 1 – Bearish Reversal Zone
The red zone and areas below it signal a potential return to the downtrend.
Stage 2 – Launch Zone
The desicion zone between 111,300 to 111,500 could trigger a sharp breakout move.
📈 Stage 3 – Bullish Extension
If price breaks through the 115,000 to 117,000 range, there’s a high probability of reaching 121,000 to 122,000.

$EPT/USDT delivered a solid breakout with a massive 72% pump! $EPT/USDT delivered a solid breakout with a massive 72% pump! Both targets hit perfectly as predicted 0.005 and 0.006 levels achieved. Momentum was strong, and the breakout played out beautifully. Now waiting to see if bulls push for the next leg up.

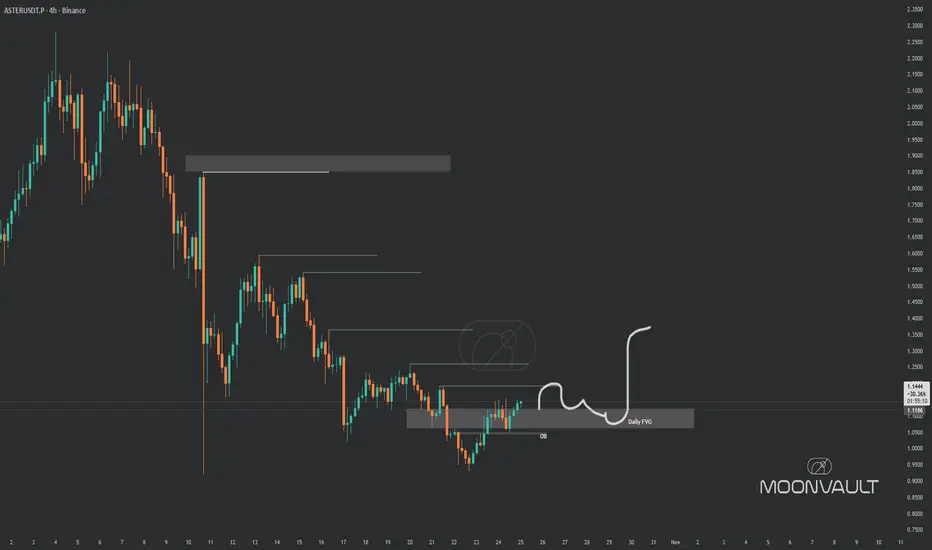
$ASTER put it on your watchlistSEED_WANDERIN_JIMZIP900:ASTER fans be aware of Aster move: break structure by reclaim daily FVG and staying above until CRYPTOCAP:BTC don't ruin party... this one looks good here, it's aster
time again.