Tron continuing to climb the measured move lineUsually when you see a measured move line treated like a staircase by price action and by this many consecutive daily candles probability is good that the breakout will be validated. If so, the target for this one is around 43-44 cents. *not financial advice*
1day

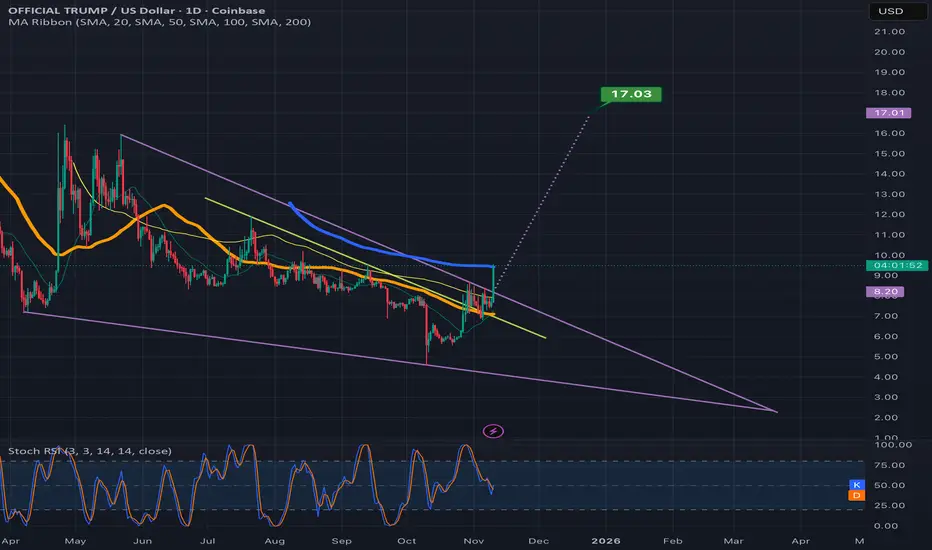
TRUMPUSD attempting to validate the falling wedge breakoutIt will need to flip the blue 200ma to solidified support to validate the breakout in my opinion but if it does it should 2x from its current value. *not financial advice*
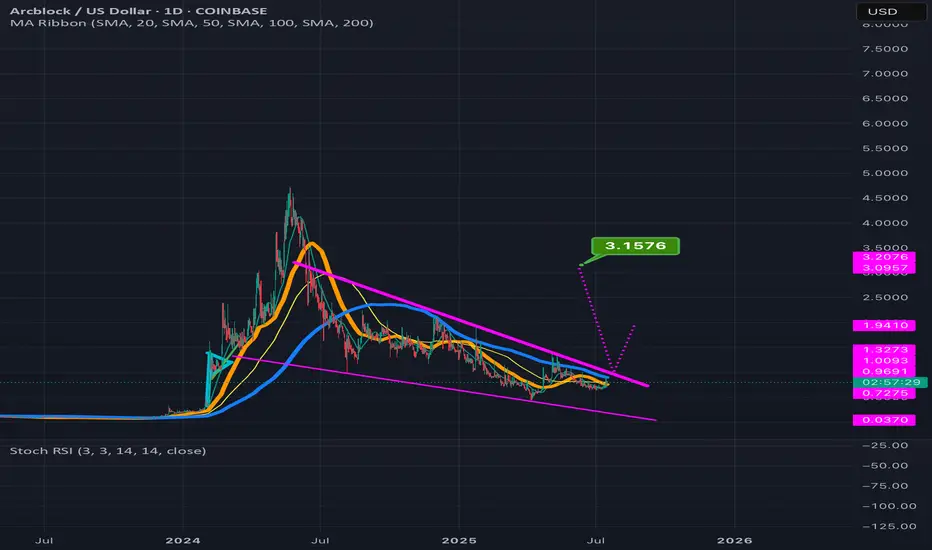
ABT can potentially 4x in value reading up from the wedge its inThe smaller pink dotted measured move line is for the inv h&s pattern its formed inside the wedge with the top trendline of the wedge doubling as the invh&s pattern’s neckline. Hitting that smaller target is more or less a 2x from current price action. If we hit the full falling wedge target that’s a 4x from where it is currently. *not financial advice*
XAUUSD’s next target = $4059Because of the bullflag with the long pole it is currently breaking up from *not financial advice*

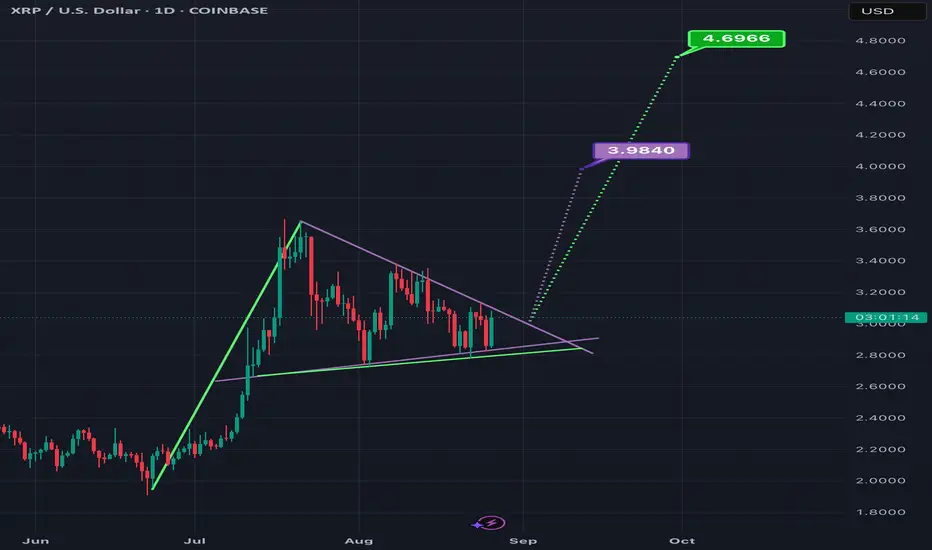
Descending channel/Bull flag on xrpusd revealedAfter the most recent resistance was found I was able to find the channel xrpusd price action is currently in which also is functioning as a bullflag. My guess is the uptrend will resume in October but we will know soon enough *not financial advice*

A descending channel/bullflag reveals itself on btcusdThe pole looks more obvious on longer timeframe charts but the flag/ channel itself is best illustrated on the 1day time frame. In fact there is a much longer pole than the one shown here on the monthly chart, but I didn’t go with that one because the flag on the monthly is more of a horizontal channel than the descending channel shown here on the 1day chart. *not financial advice*

Near moving above invh&s w/ a double bottom neckline just aboveThe inverse head and shoulders breakout not yet fully confirmed, but price is currently comfortably above its neckline. In hitting the inverse head and shoulders full target, it should also validate the double bottom breakout as well. *not financial advice*

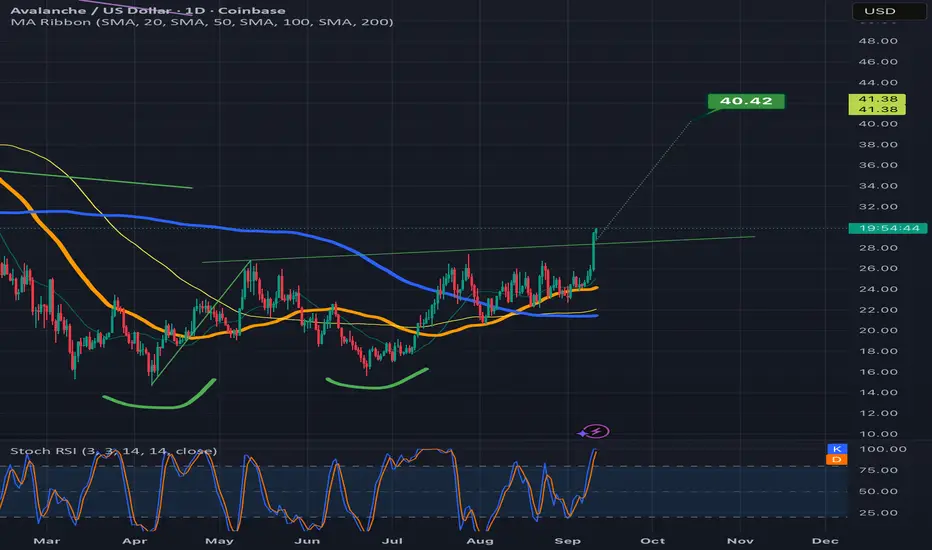
Avalanche with a close above the double bottom necklineNot sure whether it will validate the breakout here or go back below the neckline, but that was a very convincing bullish candle close above the neckline on the previous daily candle so it should give it some reasonable probability. *not financial advice*
A potential path to 134kIt appears bitcoin is breaking up from a bulllish pennant who’s top trendline seems most valid on the 4hr chart, its bottom trendline most valid on the daily chart and its flag pole most valid on the weekly chart. Sometimes patterns will be cross timeline like that. If this is the pattern that is about to be validated, we should see confirmation in the form of price action using the dotted measured move line like a ladder and as support in the near future as well as also potentially resistance later on on the way to the target. When you see that type of thing occur, probability increases that this is the real breakout. *not financial advice*

Symmetrical Triangle/ Bull Pennant on XRPUSD Nearing its ApexThe bottom trendline of this triangle definitely seems to have finally been narrowed down to this purple line and green line with multiple touch points to back that up. *not financial advice*
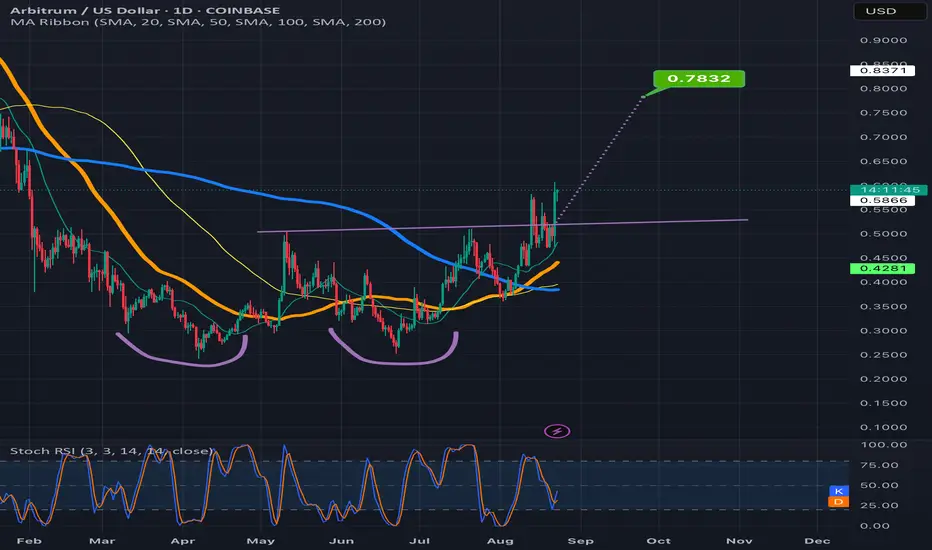
Arbitrum ready for the double bottom breakout?It’s already broken above the neckline recently then dipped back below so another dip back below is certainly possible, however after the recent bullish sentiment from Jackson Hole, I think probability favors the breakout getting confirmed in the very near future. *not financial advice*
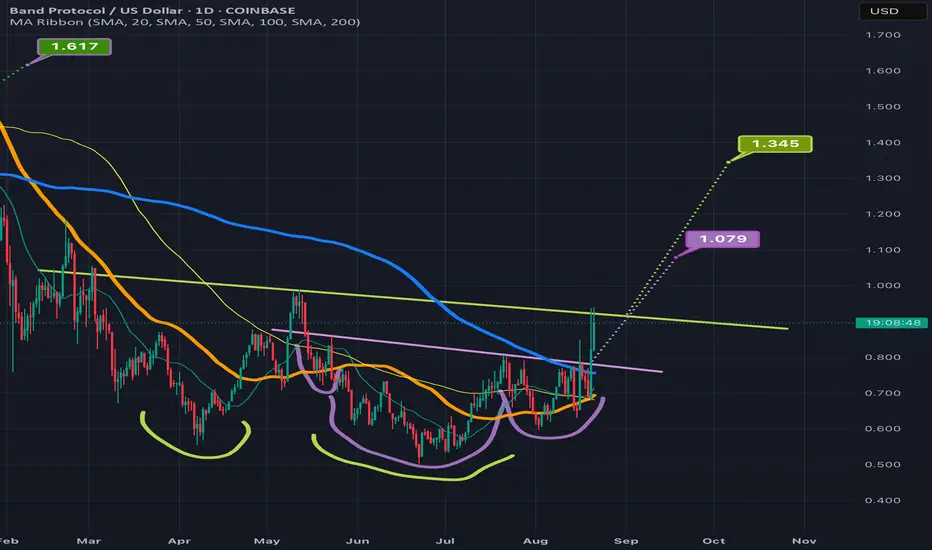
BANDUSD attempting an invh&s + double bottom breakoutBAND has been available for a significant iscount lately but the sale may be ending soon as it is now attempting both an inverse head & shoulders breakout, as well as sending wicks above the neckline of a slightly larger double bottom pattern. The double bottom pattern is in chartreuse and the inverse head and shoulder pattern is in lilac. We can also see BAND looks lke it’s about to have a golden cros in the next week or 2 which should increase probability to confirm the breakout of these two bullish patterns as it will add bullish confluence as long as prce action isn’t two high above the 30&200 moving averages at the time of the golden cross *not financial advice*
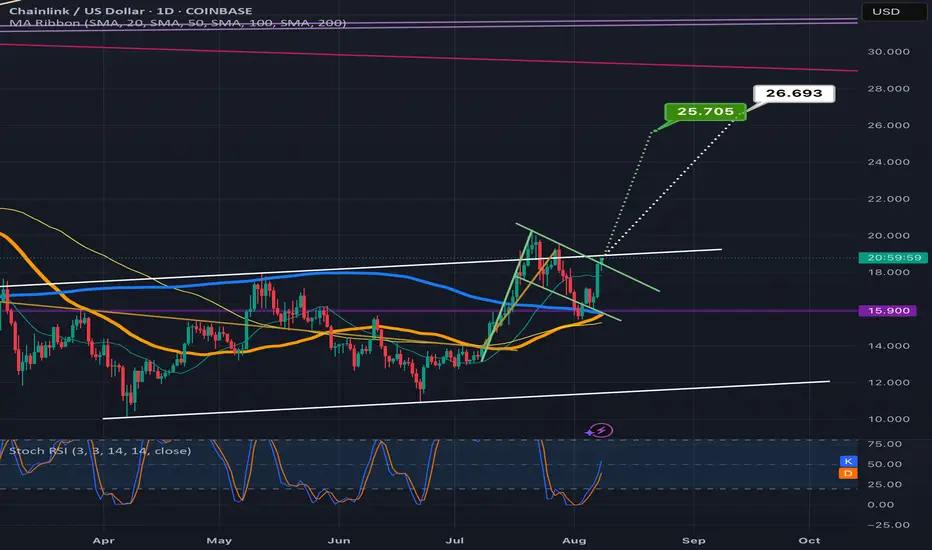
Chainlink looks ready 2 break up from bullflag & a double bottomGreen target is the bullflag white target is the double bottom. *not financial advice*
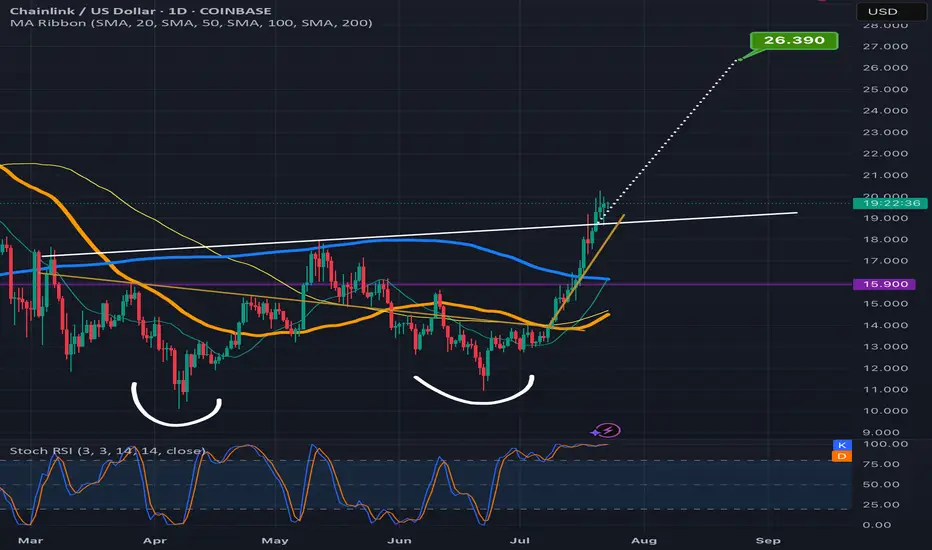
Chainlink climbing the measured move line staircaseLooks like Chanlink is ready to confirm the double bottom breakout here as the past few candles have already started to climb up the measured move line like a staircase.Always possible for a dip back below the neckline at this point but probability slightly favors the readout being validated instead for now. *not financial advice*
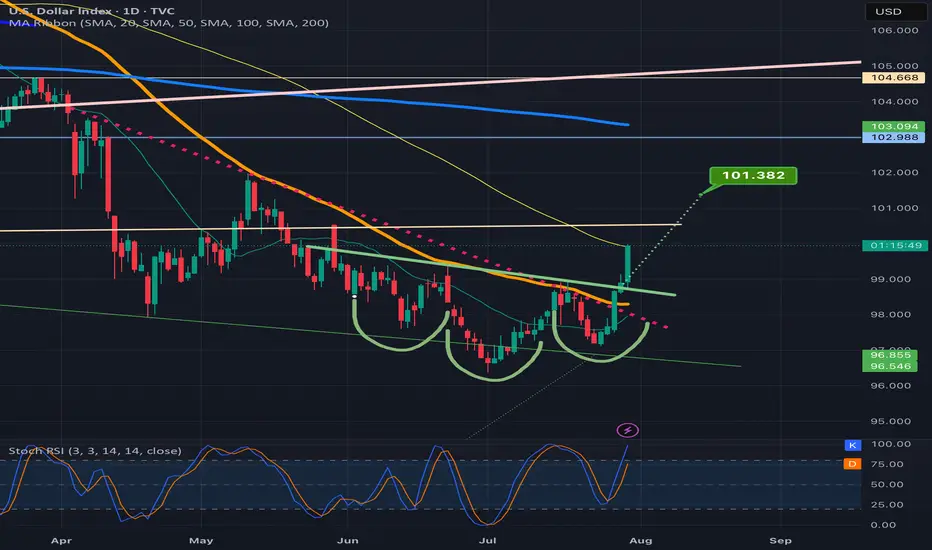
DXY attempting an inverse H&S breakoutSeeing a big green candle today on dxy after confirming the neckline of the inverse head and shoulders pattern as support on the previous daily candle.
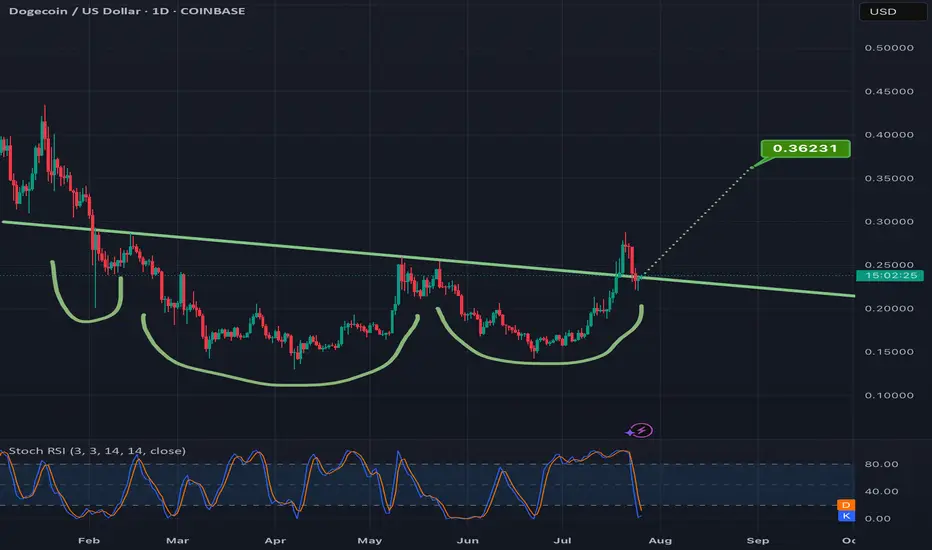
Confirming the breakout of this invh&s on doge can = 50% gainsAlready went above the neckline once and the current daily candle is currently back above the neckline for a second time. Hitting the full target would mean a good 50% gain from current price. *not financial advice*
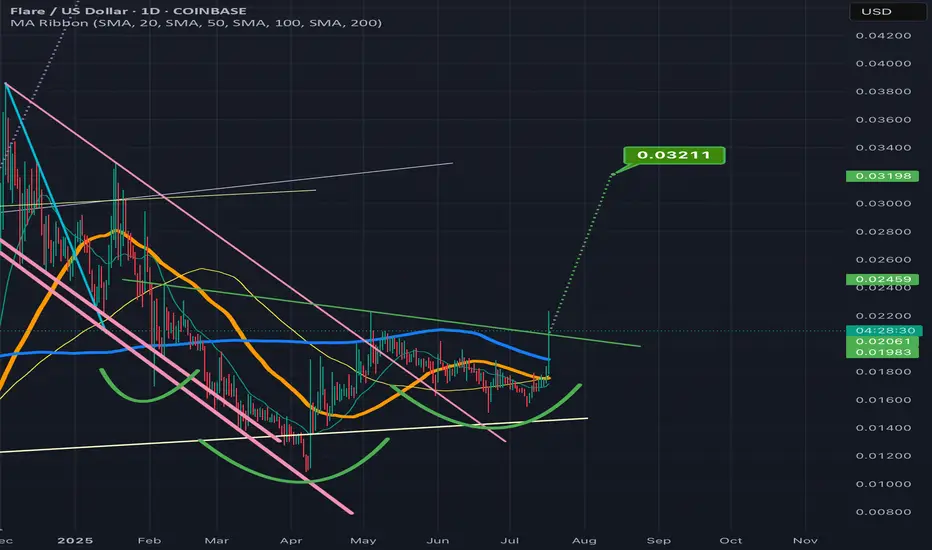
FLRUS breaking above the invh&s necklineNice it confirms the breakout the target is around 3 cents. Could always dip back below the neckline a time or two before that happens, but considering how it feels lke we are finally confirming an altseason here with bitcoin dominance taking a big dump probability highly favors an eventually validation of this breakout on flr. *not financial advice*
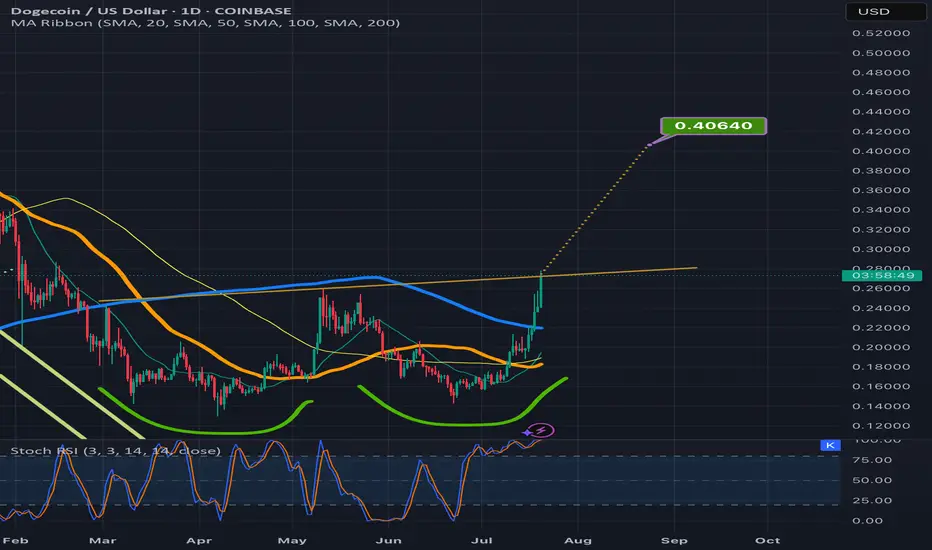
Doge inching above the double bottom necklineIt could easily dip back below the neckline a tie or two before it validates the breakout but definitely getting closer to doing so. Target is around 40-41cents. *not financial advice*
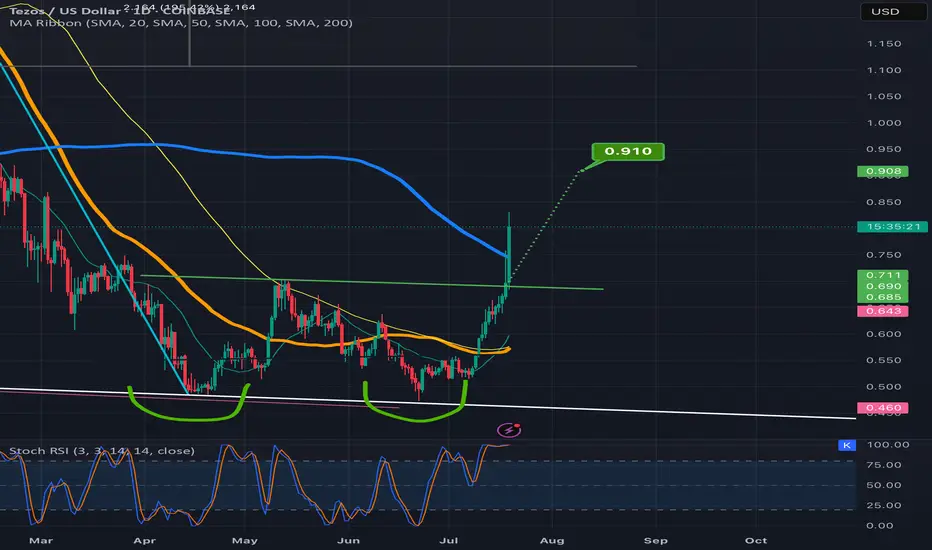
Tezos heading for a double bottom breakout targetPrice action is well above the neckline and already over halfway to the target. *not financial advice*
The daily chart for total2 to look at the impending golden crossWanted to also post a daily chart tie frame of my previous idea. I first posted it in weekly to fit the entire cup and handle breakout target in the frame, but wanted to also post the daily time frame to provide both a close up of the inverse head and shoulders pattern as well as the impending golden cross on the daily time frame. Loos very likely that alt season may finally be approaching here. Gonna pay close attention to both this chart and the bitcoin dominance chart btc.d to know for sure. *not financial advice*

SUI on its way to the teal pennants breakout targetSui has joined the bullishness here as it has brown up from the pennant and well on its way to the target. *not financial advice*

Algorand breaking up from inverse head and shouldersSeems like most of the cryptos from the iso20022 compliant chains are breaking out right now and algorand is no exception. Most likely in anticipation of Fednow’s migration to it tomorrow. *not financial advice*

XLMUSD inv h&s at the threshold of the necklineNo confirmation yet but market currently feeling very bullish here. Likely to breach this neckline in the next few candles. *not financial advice*
