BTC/USDT 1D Chart Review📉 MARKET STRUCTURE
The price is moving within an ascending channel, but:
The last candle is a strong rejection of the upper levels.
We have a clear downward impulse from the ~97.6k area.
The price is currently testing the lower line of the ascending channel.
➡️ Short-term trend: correction / weakness.
➡️ Medium-term trend: still up, BUT at risk.
🔑 KEY LEVELS
🟢 RESISTANCES
97,642 – local high / strong rejection.
94,465 – 94,400 – zone from which the downward impulse occurred.
👉 After a downward breakout, it now acts as resistance.
🟡 DECISION ZONE
92,370 – 93,400
The price is currently below.
A return above this zone = a chance for continuation. Channel
🔴 SUPPORT
89,500 – 88,960 – a very important zone
local demand
currently being tested
84,411 – key structural support
80,710 – the last line of defense of the uptrend
📊 STOCH RSI
strongly downward
no bullish divergence
there is still room for further decline
➡️ momentum = bearish
🧠 SCENARIOS
🟥 SCENARIO 1 (more likely)
Continuation of correction
Loss of 89,000
Descent to:
84,400
and with panic even 80,700
➡️ Healthy correction in the uptrend
🟩 SCENARIO 2 (less likely) (likely)
Defense of the lower channel line
Demand reaction to 88.9k – 89.5k
Return above 92.3k
Retest 94.4k
➡️ Requires strong volume (not visible yet)
🎯 WHAT IS KEY NOW
Close of the daily candle
Price reaction to:
88.9k
Ascending channel line
1daychart

LTC is in a clear downward trend📉 MARKET STRUCTURE
Main Trend: Down
Sequence: Lower High → Lower Low
Price is moving in a clear downward channel.
Any upward breakout = correction, not a trend change.
📐 KEY LEVELS
🟩 RESISTANCES (sell zones)
84.50 – current S/R flip (was support → now resistance)
94.50 – strong HTF level, where the market has been rejected multiple times
107.50 – key trend reversal level (BOS)
🟥 SUPPORT
72.00–72.50 – key support, currently being tested
63.10 – next strong HTF support
Below → empty space to ~55–58
🔎 PRICE ACTION – WHAT YOU CAN SEE
Recent Bounce:
Weak HH
No volume
Strong rejection from:
Upper channel line
Level ~84.5
Current candle:
Aggressive supply
No demand response
👉 Sellers in full control
📊 STOCH RSI
Turnover from the upper zones
Bearish momentum
No bullish divergence
👉 Oscillator confirms continuation of the downtrend
🧠 SCENARIOS
🔴 BASELINE SCENARIO (60–65%)
Descent lower
Condition:
Close D1 below 72
Target:
63.1
Possible breakout to 60–61
🟡 CORRECTIVE SCENARIO (25–30%)
Bounce Technical
Condition:
Holding 72
Demand candle + follow-up
Target:
84.5
Maximum 94.5
DOES NOT change the trend
🟢 TREND REVERSE SCENARIO (<10%)
Condition:
Close D1 > 94.5
Then reclaim 107.5
👉 Only then can we talk about a bull market
🎯 HOW TO PLAY IT (technically)
Short:
Retest 84–85 or 94–95
SL: above the structure
TP: 72 → 63
Long:
Only a reaction to 63
Short-term scalp / swing
No forcing the low

Tron continuing to climb the measured move lineUsually when you see a measured move line treated like a staircase by price action and by this many consecutive daily candles probability is good that the breakout will be validated. If so, the target for this one is around 43-44 cents. *not financial advice*

LTC/USDT 1D Chart 🔎 Market Structure
The market is in a downtrend (a series of lower highs and lower lows).
The price is moving within a descending channel (black lines).
The recent move is a rebound from the lower demand zones, but the trend has not yet been broken.
📉 Trend & Price Action
The main downtrend line has not been broken – the price has reached it and is reacting.
The current move looks like a pullback/upward correction, not a trend reversal.
No clear higher high → the structure remains bearish.
🟢 Key Levels
Resistance (sell zones)
86.84 USDT – local resistance (currently being tested)
95.83 USDT – strong structural resistance
103.54 USDT – previous downside base
110.66 USDT – very strong resistance (key to trend reversal)
Support (buy zones)
78.67 USDT – local support
72.25 USDT – strong demand zone
63.14 USDT – critical support (channel bottom)
📊 Indicators
Stochastic RSI
Currently in the overbought zone (>80)
Historically, on this chart, → often ends in a correction
Signal: watch out for shorts / profit-taking
CHOP Index
High → market was in consolidation
Recent CHOP breakout down → possible impulse but not yet confirmed by volume
🧠 Scenarios
🔴 Baseline scenario (more likely)
Rejection at 86–88 USDT
Return to around 78.67 → 72.25
Continuation of the downtrend
🟢 Alternative scenario (bullish, conditional)
Daily close above 95.83
Then a breakout of 103.54
Only 110.66 = a real trend change to up
🎯 Final conclusion
This is a correction in a downtrend, not a trend reversal.
Shorts are logical under resistance
Longs are only short-term/scalp
Swing longs only after a breakout of 103–110

BTC/USDT 1D chart review📐 PRICE STRUCTURE
1️⃣ Trend
• Long term: the upward trend continues
• Short term: correction + consolidation
The price moves between 85,800 – 88,200, which is a classic range after a decline.
➡️ The market is collecting fuel for greater movement.
⸻
🟢 KEY LEVELS (from your chart)
🟩 RESISTANCE
• 88,200 – local resistance (multiple reactions)
• 90,600 – very important level (structure + S/R)
• 92,400 – upper range / supply
🟥 SUPPORT
• 87,300 – 87,500 – current combat zone
• 85 870 – key support (if breaks → quick move down)
• 83,500 – the bulls' last line of defense
⸻
📊 STOCH RSI (D1)
• Came out of oversold
• Lines curl upwards
• No extremes yet
➡️ Momentum is growing, but there is no confirmation of a breakout
It supports:
• rebound scenario
• or fake breakout + dump
⸻
🧠 SCENARIO (most important)
🟢 SCENARIO 1: BULLISH (more likely)
Condition:
• D1 close above 88,200
Goals:
• 90,600
• then 92,400
➡️ This would be confirmation of the continuation of the upward trend.
⸻
🔴 SCENARIO 2: BEARISH (if market fails)
Condition:
• Loss of 87,300
• D1 close below 85,870
Goals:
• 83,500
• possible wick up to ~82k
➡️ Still a correction, no change in trend until 83,500 is reached.

NMR/USDT 1D Chart Long Review🔎 Market Structure
Main Trend: Down
→ Series of lower highs and lows
→ Breakout below the downtrend line (which has already happened)
Currently, the price is consolidating low, with no trend reversal signal.
📉 Price Action
After a strong upward impulse (pump), the market:
failed to maintain the structure
gave back most of the gains
Current price ~9.3 USDT
No clear demand – small candles, weak momentum
🧱 Key Levels (very important)
🔴 Support
9.00–9.30 → local, weak
~8.00 → demand zone / lower consolidation range
5.94 → HARD SUPPORT
Loss = possible further decline / capitulation
🟢 Resistance
12.36 → nearest Sensible resistance (flip level)
14.98 → strong structural resistance
19.59 – 22.77 → distribution zone (very difficult to break)
26.74 – 27.58 → local ATH/supply zone
📊 Stoch RSI indicator
Currently emerging from oversold territory
This is not a long signal per se
It only gives:
short-term bounce if volume appears
🧠 Scenarios
🟡 Baseline scenario (most likely)
Consolidation 8–10 USDT
Lack of strength for a breakout
The market is waiting for:
BTC move
or news/volume
🔴 Bearish scenario
Loss of ~8 USDT
Test of 5.94
If 5.94 falls → new Lows
🟢 Bullish scenario (conditional!)
D1 close above 12.36
Retest as support
Targets:
14.98
19.59
Without this → no medium-term longs

ETH/USDT 1D CHart Long-Term.
🔍 Market Structure (Price Action)
1️⃣ Trend
Long-term: The uptrend has been broken (a downward breakout from the black trend line).
Medium-term: A sequence of lower highs and lower lows → a downtrend.
The current rebound is a correction in the downtrend, not a confirmed reversal.
📐 Key Levels (very well marked)
🔴 Support
2768 USDT – key support (current local bottom).
2157 USDT – final support from the previous structure (if 2768 breaks → a very real pullback).
🟢 Resistance
3506 USDT – current nearest resistance (retest after a downward breakout).
4101 USDT – strong supply zone + former support.
4477 USDT – main structural resistance (region of previous highs).
👉 Price is now exactly in the decision zone between 2768 and 3506.
📉 Trendline
Breaked and rejected (retest ended with a decline).
This is a classic signal of a downtrend continuation.
Until the price returns above 3506 and sustains, there is no uptrend.
📊 Stochastic RSI
The oscillator frequently reaches the 80–100 zone.
Currently: Moving out of overbought → signal of weakening upward momentum.
No bullish divergence → no confirmation of a trend change.
🧠 Scenarios
🐻 Baseline scenario (more likely)
Rejection of 3506
Return to around 3000 → 2768
Breakthrough of 2768 = open path to ~2150
🐂 Alternative (conditional) scenario
Daily close above 3506
Retest of 3506 as support
Only then is a move towards 4100 possible
🎯 Final conclusions
This is not a market for longs without confirmation.
The current rebound looks like a pullback in a downtrend.
Safeest:
Short at resistance (3506 / 4101)
Long only after a breakout and holding of 3506

TECHNICAL ANALYSIS BNB/USDT1️⃣ Market Structure and Trend
The chart shows a long-term uptrend, confirmed by a very clean ascending trendline (orange), which has been acting as dynamic support for over a year.
After a strong breakout to ~1380, the price began a correction but still hasn't broken the higher low structure → the uptrend is intact.
2️⃣ Key Levels (exactly from your chart)
🟢 Resistance Levels (green):
~1018 USDT
~1150 USDT
~1249 USDT
These are potential targets for a renewed uptrend.
🔴 Support Levels (red):
~879 USDT – the closest important support
~838 USDT – a key defensive level
~683 USDT – deep support / last HTF trendline
The price is currently trading directly above the first support level.
3️⃣ Trendline (orange)
Your trendline is:
strong, multi-point
drawn on the D1 timeframe
currently around 850–880 USDT
➡️ If the price falls, the trendline perfectly aligns with the 838–879 zone, strengthening this zone as a "must defend."
4️⃣ Oscillators – Stoch RSI (bottom)
Currently:
The oscillator is in a high zone (above 80) → indicating local overbought
However, there is no clear downward crossover yet.
Meaning:
👉 Upward momentum is still active, but we are closer to a local high than a low.
5️⃣ Scenarios
🟢 Upside scenario (more likely as long as the trendline holds)
Condition: Maintaining the 879/838 levels and the trendline.
Targets:
1018 USDT – first resistance
1150 USDT – important medium-term resistance
1249 USDT – main HTF target
The longer the price consolidates above the orange trendline, the greater the chance of a renewed attack on 1150–1249.
🔴 Downside scenario (less likely, but crucial)
Condition: Downside breakout of 838 USDT and closing of the D1 candle below the trendline.
Then:
the market could enter a deeper correction phase
the target would be the 683 USDT level – this is also the main support level, where reactions were previously strong
This is a "capitulation" scenario, but it doesn't seem to be dominant given the current price action.
6️⃣ What can we see on the chart "here and now"?
✔️ The price has rebounded from the local low
✔️ It is still between support at 879 and resistance at 1018
✔️ The uptrend is intact
✔️ A potential HTF higher low has formed
✔️ The Stoch RSI shows momentum, but caution is warranted
➡️ The market is consolidating within the uptrend, with a high chance of a breakout upwards – provided support is maintained.

ETHUSD 1D chart1️⃣ Trend and key levels
Trend
• The overall neutral-growth trend, but with clear consolidation.
• The price rebounded dynamically from the bottom (approx. USD 2,850), which creates the first higher low structure → the potential beginning of an upward impulse.
Support
• $2,973-$3,000 – SMA #1 + local support.
• USD 2,851 – strong support from which the candle made a very large wick upwards.
Resistances
• USD 3,169 – the first strong resistance, several candles bounced from this level.
• $3,236 – key daily resistance. Breakout = signal of strong momentum and opening the way to USD 3,300-3,430.
⸻
2️⃣ Candle formation and behavior
• A bullish candle with a long lower wick appeared → this is a signal of buyers.
• The price is making a series of higher lows, but no higher high yet → the market is waiting for a breakout of USD 3,236 to confirm the uptrend.
⸻
3️⃣ SMA (moving averages)
🔴 SMA #1 (short-term)
• Price is just above it → acts as support.
• If the daily candle closes below $3,000, the downside momentum returns.
🟢 SMA #2 (long term, ~$3,430)
• Is high above the price → long-term bearish pressure until the price returns to the price area.
⸻
4️⃣ RSI (momentum)
RSI around 45–50
• Neutral territory.
• Zero overbought/oversold.
• Slight upward trend in RSI → buyer momentum is growing, but without an overheating signal.
Conclusion: The market has room to move higher before the RSI becomes high.
⸻
5️⃣ MACD
• MACD is above the signal line → slight, early bullish signal.
• The histogram increases, but there is no significant acceleration.
Interpretation: increases are possible, but without strong momentum yet.

LINK TECHNICAL ANALYSIS — 1D📊
1. MARKET STRUCTURE
Long-term trend
The price is currently approaching this line, but has not yet tested it directly.
This is a key support level for the entire LINK market.
2. SUPPLY & DEMAND ZONE
Demand Zone — $9.6 – $4.8
The large red area. This is
a historical accumulation zone,
an area where LINK has been repeatedly defended,
an area to which the price has returned with each major dump.
Supply Zone — $15 – $20
The green area from which:
the price has been rejected repeatedly,
this is the selling wall from 2021,
a key target for bulls after the rebound.
3. CRITICAL LEVELS
Very important support
Type Level Description
Trendline ~11.5–12.2 USD We are very close to a test.
Horizontal 9.63 USD First major historical support.
Horizontal 4.84 USD Final low (strongest demand).
If the trendline breaks, the → ** LINK will almost certainly fall to 9.63**, and if that breaks too, → 4.8 USD is very likely.
4. MOMENTUM – STOCH RSI
On the Stoch RSI chart:
is extremely oversold,
similar to previous lows (2023, 2024),
signaling the possibility of a rebound within a few days/weeks.
5. PRICE SCENARIOS
🟢 BULLISH (bounce)
Condition: Maintaining the trendline
Expected movements:
Bounce around 11.5–12.5
Target 1: USD 15
Target 2: USD 18–20
Possible breakout → USD 22–24
This scenario is realistic if Bitcoin doesn't make another strong dump.
🔴 BEARISH (falling)
Condition: Breakout of the trendline with a daily candle below ~11.5
Expected movements:
A quick drop to USD 9.63
This could result in:
a bounce to ~12
or a continuation of the decline
If 9.63 falls → a practically certain target of USD 4.8
This level represents a significant historical accumulation and will not fall without a fight.
➤ Price is currently hanging by a thread.
The trendline is one of the most important support levels on the LINK chart.
Momentum is oversold → signal for a short squeeze/bounce.
But the local structure remains bearish.
➤ If the trendline holds → a thick long swing.
➤ If it collapses → we fall to 9.63 and possibly 4.8.

BTC Dominance Analysis – 1D📊
1. Main Trend
BTC.D is still moving within a large, ascending trend channel (yellow lines).
The price has currently rebounded from the lower band of the channel and is heading towards its center.
The long-term trend remains bullish, but short-term momentum is weakening.
📈 Key Levels on the Chart
Supports
59.20% – currently tested support + EMA 50 and SMA 50
→ a very important level. Its loss = downward pressure on BTC.D, favorable for altcoins.
58.24% – next strong support level
→ if 59.20% falls, a move to 58.24% is very likely.
57.05% – key structural support
→ breakout = the ascending trend is broken, altcoin season is off to a strong start.
Resistance
60.87% – local resistance from multiple candles + MA/EMA crossover
61.65% – strong upside target
64.68% – trend extreme (upper band of the channel)
→ if BTC moves solo, this level will be tested.
🔵 EMA / SMA 50/200
I can see a few key things in the screenshot:
The 50 EMA is below the 200 EMA – technically a death cross → a short-term bearish structure.
The price is exactly below the 200 EMA and stuck to the 50 EMA.
→ this is a typical consolidation zone before a breakout.
Conclusion:
If BTC.D breaks 60.8% → momentum returns to BTC's side.
If it falls below 59.20% → altcoins receive a signal to rebound.
🔴 MACD
The MACD is above 0, but the crossing line is bearish (the blue line crosses the signal from above).
The histogram turns red.
Conclusion:
Momentum is decreasing → a short-term bearish signal.
🟣 RSI
RSI is around 53, which is neutral.
A downward breakout of the MA onto the RSI → a weakening impulse.
Conclusion:
The RSI does not support a strong move either up or down — but the slight slope suggests a correction.
📌 SCENARIOS
🟢 Bullish (pro-BTC)
Condition: 60.8% breakout
➡️ Targets:
61.6%
64.6% (channel top)
This means:
➡️ BTC dominates the market
➡️ ALTs are bleeding or stagnating
🔴 Bearish (pro-alts)
Condition: 59.20% breakout
➡️ Bearish targets:
58.24%
57.05% → and this is where the real alt season begins
This means:
➡️ Alts are starting to pump harder
➡️ BTC is losing dominance
🟡 Neutral / sideway
BTC.D between 59.2% and 60.8%
→ range consolidation, lack of major market decision
→ typical for periods when the entire crypto market stands still and "waits"

BTC/USD 1D Chart🧭 Overall Market Picture
Bitcoin is in a medium-term downtrend, as confirmed by:
a descending channel (marked with white lines),
lower highs and lower lows,
price below the key EMA and SMA.
The price is currently testing the upper boundary of this channel, so it will be crucial whether it manages to break out of it to the upside or rebounds further down.
🔹 Key Price Levels
Support:
$100,650 — short-term support, previously seen price reactions.
$98,550 — next demand level from late October.
$96,950 — lower boundary of the descending channel, potential target for continued declines.
Resistance:
$106,300–$106,500 — current resistance (upper boundary of the channel + SMA100).
$109,700–$110,000 — strong resistance converging with the EMA200 and SMA200.
$112,000+ — channel breakout and trend change.
🔸 Technical Indicators
1. MACD
The histogram is starting to turn positive (descending red).
The MACD line is attempting to cross the signal from below — a potential bullish signal, but not yet confirmed.
➡️ Indicates a possible short-term upward correction within a downtrend.
2. RSI (14)
Value: ~40.5 — low, but has rebounded from oversold levels.
No bullish divergence, but the RSI is rising from below, suggesting a potential technical bounce.
➡️ Still more upside than downside before entering the overbought zone.
🔹 Moving Averages
EMA50 (~109,970 USD) and EMA200 (~110,380 USD) are above the price, confirming the downtrend.
The EMA50 < EMA200 cross holds – a classic death cross.
SMA100 (~106,300 USD) has just been tested – a key level that could determine the direction of the coming days.
🔸 Short-Term Scenarios
🟩 Bullish (30–40% chance)
Breakthrough of the upper channel line (~106.5k USD) + daily close above 107k USD.
Confirmation of the MACD and RSI signal > 50.
Targets: 109,700 → 111,500 → 113,800 USD.
➡️ A medium-term trend reversal is then possible.
🟥 Bearish (60–70% chance)
Bounce from the upper channel line and fall below 102k–101k.
Continuation of the downtrend.
Targets: 100,600 → 98,500 → 96,900 USD.
➡️ In this scenario, the market will maintain a lower high/lower low structure.
⚙️ Summary
Trend: Down, but with a short-term rebound attempt.
Key moment: reaction to the 106k–107k USD level.
If the channel with volume breaks, a bullish reversal.
If a rebound, a new low around 97k–99k USD is very possible.

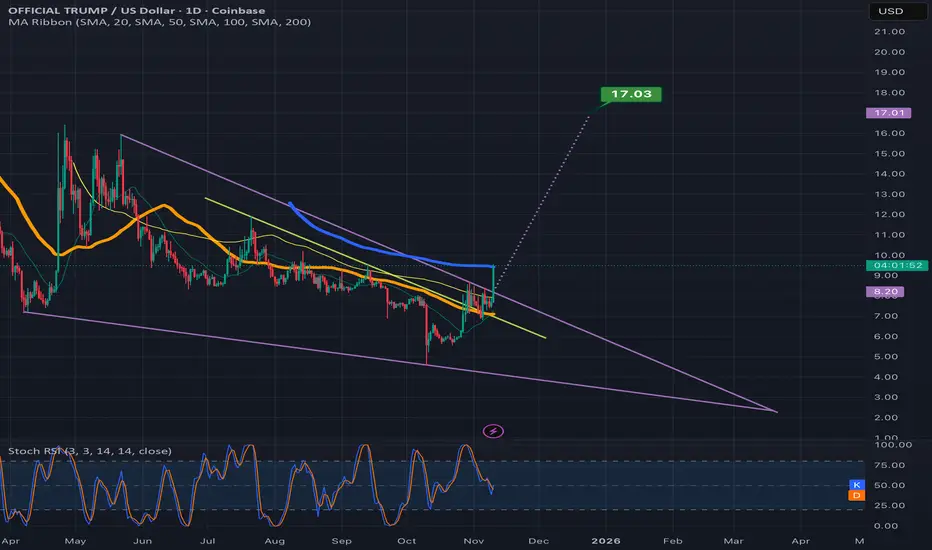
TRUMPUSD attempting to validate the falling wedge breakoutIt will need to flip the blue 200ma to solidified support to validate the breakout in my opinion but if it does it should 2x from its current value. *not financial advice*
ETH/USDT 1D Chart📊 Current situation
• Price: approx. USDT 3,402
• Main trend: downwards - there is a clear downtrend line (black line) which acts as strong resistance.
• Key zones:
• Resistance: 3490-3990 USDT (green zones)
• Support: 3185 and 2700 USDT (red zones)
⸻
🧠 Market structure
• ETH moves below the trendline, confirming the dominance of sellers.
• After the recent decline, there was a rebound from the support at USDT 3185, but buyers' power is limited - daily candles have long upper wicks → supply pressure.
• If the price does not break through USDT 3,490–3,500, there is a risk of a retest of the USDT 3,185 support, and if it is broken, a possible decline to around USDT 2,700.
⸻
⚙️ Stochastic RSI (bottom of chart)
• Stochastic RSI is in the oversold zone (approx. 30), but the lines have not moved significantly upwards yet - i.e. there is no confirmed buy signal.
• If the indicator starts to curve upwards and crosses above 20, it could indicate a short-term rebound (upside potential to USDT 3,490).
⸻
🧭 Scenarios
🔺 Growth scenario (less likely)
• Breaking the trendline and staying above 3490 USDT will open the way to 3990 USDT.
• Requires increased buying volume (volume looks rather neutral for now).
🔻 Downside scenario (more likely)
• Rejection from 3490 USDT or from the trendline → drop to 3185 USDT.
• Breakout of 3185 = move to 2700 USDT (strong support from previous consolidations).
⸻
📈 Summary
• Trend: downward
• Short term: possible rebound to 3490, but the risk of further decline remains high.
• Key level to watch: 3,490 USDT (if it does not break, it is better to avoid longs).
• Potential long signal: only after breaking the trendline and retesting with confirmation of RSI > 50.

BNB reacts to BTC declines🔍 General Technical Situation:
The BNB price has broken below a key uptrend line that has been in place since June.
It is currently below the support level of ~1010 USDT, signaling a shift from higher lows to a potential downtrend.
📉 Key Levels:
Resistance:
1086 USDT → last local resistance after the trend breakout (a retest from below is possible).
1205 USDT → strong resistance from August and September.
Support:
912 USDT → local support (currently being tested).
831 USDT → next support, significant from the August structure.
733 USDT → strong demand zone from June-July.
📊 Volume:
In recent days, it has increased noticeably during declines—confirming selling pressure and the presence of large players liquidating positions.
🔄 Stoch RSI Indicator:
The Stoch RSI is at the lower end of the chart, close to the oversold zone (around 20–0).
This could indicate a short-term rebound, but not necessarily the end of the decline—rather, a potential retest from below the broken trend line (~1050–1080 USDT).
⚠️ Scenarios:
🟥 Bearish (more likely):
Price remains below 1010 USDT and rejects the 1080–1100 level in the event of a rebound.
Next downside targets: 912 → 831 → 733 USDT.
High selling volume suggests a test of lower levels may occur before demand stabilizes.
🟩 Bullish (less likely, but possible):
Price bounces from the 900–910 zone and returns above 1010 USDT with confirmed volume.
Only a close of the daily candle above 1080 USDT would negate the current bearish signal and could open the way to 1200 USDT.
📈 Summary:
Medium-term trend: broken, signal of weakness.
Short-term: possible technical rebound from 900–910, but the overall bias remains bearish.
Key level to watch: 1010 USDT – a return above this level would be the first positive signal.

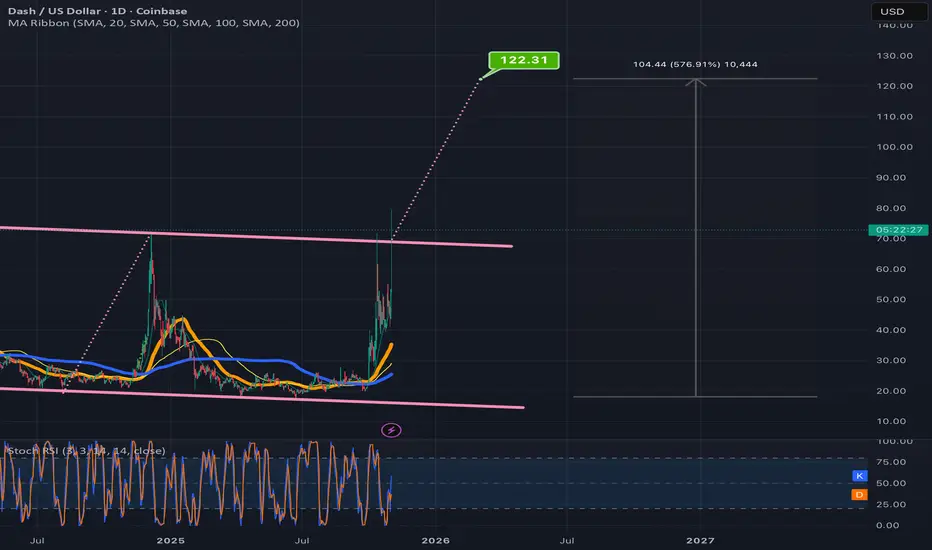
Dash trying to catch back up with ZCash hereUntil recently, Zcash and Dash tended to pump and dump in tandem with eachother, ever since ZCash’s recent big breakout though Dash has noticeably lagged behind. It was hard to say whether it was just delayed reaction on dash’s part or if a true decoupling between the two ahd occurred but it seemed like a least a safe gamble(not financiala dvice) to put a little chunk of money on dash in the interim in case it would do something similar to what Zec has been doing in the enar future. So that’s what I did and now dash is pumping and has gotten above the top trendline of this pink channel. If it validates the breakout at this breach point the measured move target is around $122. From the bottom around $18 thats over a 500% gain. Could always just keep going after that like Zcash has done also but that remains to be seen. First things first is just to validate the breakout of the channel which has not yet happened but a decent probability that it will. *not financial advice*
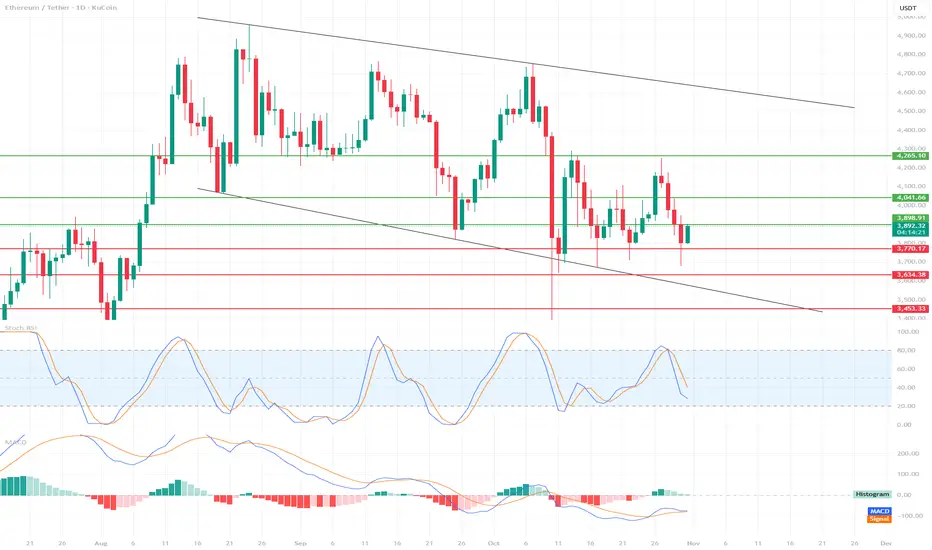
ETH Tests Support – Is This the Beginning of a Rebound?📉 Market Structure
We see a descending channel, bounded by two black trend lines.
Upper Boundary: ~$4,700
Lower Boundary: currently around $3,700, representing strong dynamic support.
The price is currently hovering slightly above the lower edge of the channel, suggesting a possible rebound, but the market remains in a medium-term downtrend.
🔍 Support and Resistance Levels
Support:
$3,770 → currently being tested, crucial in the short term.
$3,643 → next strong support from previous lows.
$3,453 → last line of defense against a steeper decline.
Resistance:
$3,889 → closest resistance, current local ceiling.
$4,041 → strong resistance resulting from prior consolidation.
USD 4.265 → a line that, if broken, could signal a change in the medium-term trend.
📊 Technical Indicators
Stochastic RSI
Located near the oversold zone (below 20), with a slight upward curve.
🔹 Signal: Potential upside move (bounce) in the short term if the %K and %D lines cross upward.
MACD
The MACD line is slightly below zero, but is starting to curve upward and may soon cross the signal line.
🔹 The histogram is starting to decline on the negative side – this is often an early bullish signal (possible change in momentum).
⚖️ Scenarios
🔹 Bullish
If ETH holds above USD 3,770 and the Stoch RSI confirms the rebound, a possible move towards:
3,889 → USD 4,041 → USD 4,265.
A break above USD 4,265 could open the way to USD 4,500+ (upper band of the channel).
🔻 Bearish
Loss of support at USD 3,770 → a signal of weakness.
Then the next downside targets:
USD 3,643, then USD 3,453.
If USD 3,453 breaks, possible tests of the lower band of the channel – even around USD 3,300.
🧭 Summary
Main trend: downward (descending channel).
Short-term bias: neutral-bullish (potential for a rebound from support).
Key level to watch: USD 3,770 – maintaining this level could trigger a rebound, loss = risk of a steeper decline.
BTC/USD 1D Chart📉 Trend Structure
Bitcoin is currently in a medium-term downtrend, as evidenced by the descending channel (black trend lines).
Each bounce from the upper edge of the channel has ended in a decline, and recent tests of the lower boundary suggest that the market is respecting this channel as a primary structure.
⚙️ Key Technical Levels
Resistance (green lines):
$123,345 – strong resistance from the previous high and the channel breakout boundary.
$115,179 – local resistance that has been tested several times and rejected.
Support (red lines):
$107,482 – currently tested support level; breaking it could strengthen supply pressure.
$104,929 – next strong support level near the local lows from September.
USD 98,841 – critical support – lower channel zone, potential capitulation or rebound zone.
📊 Volume
Volume is increasing on the declines, suggesting that the current downward move is supported by seller activity.
No significant accumulation volume at the lows – the bulls have not yet taken control.
🔄 Stoch RSI Oscillator
The Stoch RSI is approaching the oversold zone (around 20), but has not yet reached it.
If the %K and %D lines extend below 20 and then cross upward, this will signal a potential technical rebound.
For now, momentum is negative (bearish).
🧭 Scenarios
🟥 Bearish Scenario (more likely at this point)
A breakout of the $106,000 level opens the way to $104,900 and then $98,800.
Continuing the downward movement within the downward channel could lead to the lower edge of the channel around $100,000 in November.
🟩 Bullish Scenario (Bounce)
Defending the $106,000 level and a positive signal from the Stoch RSI could lead to a bounce around $115,000.
Only a breakout of the upper edge of the channel (~117,000–118,000) with volume confirmation would signal a trend reversal.
⚠️ Summary
Trend: Downtrend (descending channel)
Momentum: Bearish
Key level to watch: USD 106,000
Potential rebound area: USD 104,900 – USD 98,800
Stoch RSI: Near oversold → possible short-term rebound

XRP/USDT 1D Chart Review🔹 1. General Trend
A long-term downtrend is visible, confirmed by the descending trendline connecting the peaks (black diagonal line).
The price continues to respect this trend, and the current rebound looks like a test of this line from below.
🔹 2. Key Levels
✅ Resistance:
2.77–2.80 USDT – current strong resistance (being tested now, with the price trying to break through it).
→ This is the confluence zone: downtrendline + horizontal level.
2.85–2.86 USDT – next resistance (previous local high).
3.12 USDT – main weekly resistance, where the last major downward wave began.
✅ Support:
2.48 USDT – key daily support from which the market rebounded.
2.13 USDT – lower support that halted the earlier crash (large wick).
🔹 3. Stochastic RSI
Currently in the overbought zone (80–100), and the %K and %D lines are close to crossing.
→ This signals that upward momentum may be weakening – a local correction or consolidation is possible.
🔹 4. Scenarios
🟢 Bullish (breakout of resistance 2.77–2.80)
A confirmed breakout and close of the candle above 2.80 USDT will signal a continuation of the move to:
🎯 2.85–2.86 (first target)
🎯 3.12 (second target)
🔴 Bearish (rejection of resistance)
If the daily candle closes below 2.65 USDT, a possible pullback to:
🎯 2.48 (key support)
🎯 2.13 (deeper retest)

BNB/USDT 1D chart review📊 1️⃣ General context
• BNB price is approximately USDT 1,100, after correction approximately -0.85%.
• It is clear that the market is in a corrective phase after a strong increase - recent highs reached ~1,340 USDT.
• Currently, the rate is balancing between support ~1069 USDT and resistance ~1149 USDT.
⸻
🟢 2️⃣ Supports and resistances (key levels)
• Closest support:
🔸 1069 USDT (short term, red line)
🔸 985 USDT – stronger support (previously tested, below EMA 50)
🔸 884 USDT – strong long-term support (potential correction low)
• Resistances:
🔹 1149 USDT – first level to break
🔹 1226 USDT – important daily resistance
🔹 1344 USDT – main peak, border of the previous impulse
⸻
📈 3️⃣ Moving Averages (SMA/EMA 50/200)
• We see the yellow EMA 50 line and the green SMA 200 line crossed (EMA Cross 50/200).
👉 This is a golden cross - a medium-term growth signal.
• Currently, however, the price has fallen below EMA 50, which means supply pressure in the short term.
• As long as it stays above the 200 SMA (~1060-1070), the macro trend remains bullish.
⸻
📉 4️⃣ MACD
• The histogram is red and decreasing - this confirms that the downward momentum continues but may be weakening.
• The MACD line (blue) is approaching the signal line (orange), which may indicate an impending bounce.
⸻
🪫 5️⃣ RSI
• RSI is around 40-45, which is close to the oversold zone.
• This suggests that sellers may be losing strength and a technical rebound may occur soon.

BTCUSD 1D chart review• Bitcoin remains in a broad uptrend, but is currently seeing a correction following a strong breakout from around $109,000 → $124,000.
• The daily candle shows a large decline from the upper level, which may suggest strong resistance and profit-taking.
⸻
📈 Key technical levels
🟩 Resistances:
• USD 117,828 – the nearest strong resistance, marked by previous local highs.
• USD 120,000–124,000 – last peak zone and potential sales area.
🟥 Support:
• USD 113,600 – first short-term support (price is currently testing it).
• USD 108,968 – strong support aligned with EMA 50 and yellow trend line.
• USD 104,366 – another strong support, consistent with the previous low and EMA 200 level.
⸻
🧭 Trend and moving averages
• EMA 50 (yellow) is trending upwards - the medium-term trend is still upwards.
• EMA 200 (blue) is also climbing - long-term trend maintained.
• Price above EMA 200, but above EMA 50 only slightly - the market is in the equilibrium zone (there may be a larger move in one direction).
⸻
📊 Technical indicators
🔹 MACD:
• The MACD line begins to approach the signal line from above → bearish crossover.
• The histogram with red bars confirms the slowdown in momentum.
➡️ Suggests that there may be a continuation of correction to lower support levels.
🔹RSI:
• RSI ~50, neutral but heading down.
• There is no oversold yet, but the momentum is waning - the market is losing buyer power.
➡️ If the RSI drops below 45, it will confirm downward pressure.
⸻
📉 Pricing scenarios
✅ Growth scenario (rebound)
• Price remains above USD 109,000 (EMA 50 + trendline).
• Breakout and closing of the daily candle above USD 117,800 → opens the way to USD 122-124,000.
• Condition: MACD must turn upwards and RSI >55.
⚠️ Downside scenario (correction)
• If price breaks above $109,000, we could see a test of $104,000-105,000 (EMA 200).
• Loss of USD 104,000 → possible move towards USD 98,000–100,000 (previous consolidation zone).

Will BTC go further down?🧩 1. General Context
Bitcoin is currently declining after rebounding from around $124,000.
The chart shows a clear descending channel (yellow lines), where the price bounced off the upper and lower boundaries.
Currently, the daily candle is testing the lower boundary of the channel and the support zone (red rectangle) between ~$110,000 and $107,000.
📉 2. Key Technical Levels
Resistance 1) 115,699 EMA50/SMA200 average zone — possible retest from below
Resistance (2) 119,875 resistance with a potential bounce
Resistance (3) 124,585 strong resistance with a potential bounce
Support (1) 110,000 Daily support currently being tested
Support (2) 107,111 200-day SMA — a strong defensive line in the uptrend
Support (3) 105,000 Lower boundary of the September demand zone
📊 3. Moving Averages
The 50-day EMA (~115,700) recently crossed the 200-day SMA (~115,600) → a possible death cross if it holds below.
Price below the EMA50 and SMA100, approaching the SMA200 → momentum is definitely bearish in the short term.
⚙️ 4. MACD
The MACD indicator shows a fresh crossover of the downward signal.
The histogram deepens into the negative zone → confirmation of downward pressure.
Momentum is negative, with no signs of upward divergence.
💪 5. RSI
RSI = 37.9, close to the oversold zone, but not yet extreme.
A technical rebound could potentially occur when touching 30–35.
No divergence is visible yet (RSI confirms price movement).
🕯️ 6. Candlestick Structure
The last three daily candles are:
Two strong bearish candles with large bodies (without significant shadows).
Today's candle with a lower wick is testing the 110,000 zone → a possible defense attempt by buyers.
📈 7. Short-Term Scenarios
🔻 Bearish:
A break of 110,000 and a daily close below 107,000 → a possible decline to 105,000 and even 101,000–102,000 USD.
The MACD and moving averages confirm this scenario.
🔼 Bullish:
A defense of 110,000 and a return above 112,000–113,000 → a possible retest of 115,000–116,000 (EMA50/200) is possible.
The RSI indicates that the market has cooled down → a short-term technical rebound is possible.

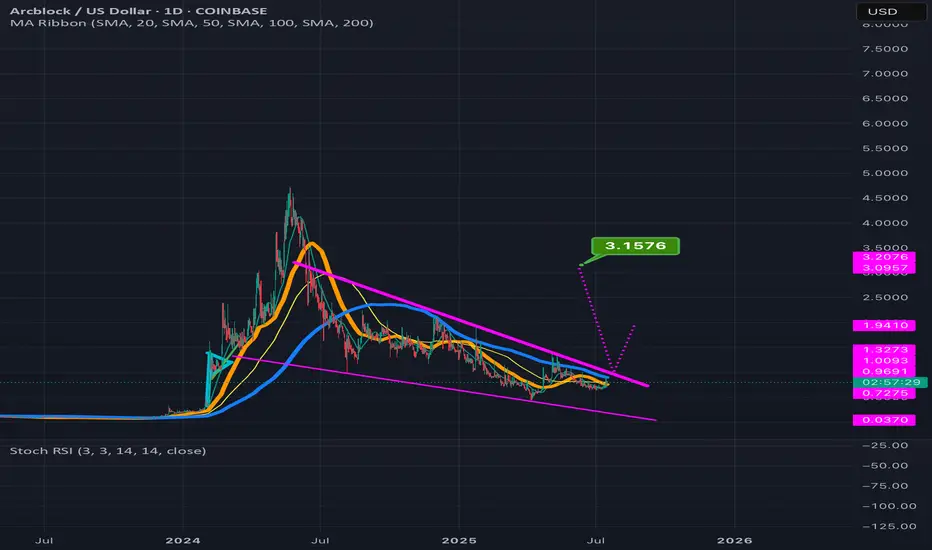
ABT can potentially 4x in value reading up from the wedge its inThe smaller pink dotted measured move line is for the inv h&s pattern its formed inside the wedge with the top trendline of the wedge doubling as the invh&s pattern’s neckline. Hitting that smaller target is more or less a 2x from current price action. If we hit the full falling wedge target that’s a 4x from where it is currently. *not financial advice*