$1INCH Road Map using My Bento Box Analysis$1INCH
On a Weekly Chart
LONG POSITION -MOMENTUM STRATEGY - SWING
12.06.22
2023H +8 SINGAPORE
Disclaimer:
The findings of the following analysis are the sole opinions of the publisher of this idea and should not be taken as a piece of investment advice.
My Published Ideas are not 100% Accurate. There are many given factors at a given time that can change the forecast.
ALERT:
Forecast Entries for a BULL SWING.
Smart money wants a REBOOT of 2018 and all is possible for the forecasted entries based on numbers and the character of the market Let us see how price action reacts on a DAILY chart.
INSTRUCTIONS:
HOW TO USE THIS MINIMALIST CHART (Bento Box)
"Follow the white rabbit!"
Just Follow the TOPS and BOTTOMS of the BOXES as a GUIDE to where the MARKET will take you.
If it cannot break a TOP or BOTTOM of a BOX, It signifies a reversal of a trend.
TARGET ZONE IDENTIFICATION:
The LARGE BOXES (Tops and Bottoms) are MAJOR turning points that will occur sometime in the future. While the SMALL BOXES (Tops and Bottoms) are MINOR turning points. These can be entries to a BUY/ SELL POSITION, EXIT/PARTIAL EXIT/TOP-UP AREAS, as well as Support and resistance levels
Also includes the MAXIMUM TARGET EXIT AREA OF VALUE (Conservative) If price action and conditions are right at that given moment.
NOTE:
1. That PRICE TARGETS for ENTRY and EXITS are DYNAMIC and can CHANGE from time to time.
2. Created using data on a MONTHLY, WEEKLY & DAILY Analysis of a MARKET'S CHARACTER.
3. My BENTO BOXES are designed for SWING TRADES at the LOWEST or START of a SWING CYCLE.
4. At times I will include a WAY BEYOND PARABOLIC PRICE TARGET, depending on The Character of the Market (CRYPTOS ONLY).
5. DYOR for your Fundamentals, Volume, Chart Patterns, Candlestick Math, FIB COILS ( ABC ), Price Action, FIB LEVELS, Market Dynamics, AB=CD Pattern especially institutional and retailer trading psychology.
Hoping that this BENTO BOX CHART ANALYSIS will efficiently help you with your DYOR as we Enter a NEW SWING CYCLE for LONG positions, either short, mid, or long term.
Wishing you all The Best Trades and Thank you for your Appreciation and Support of My Work.
Many thanks to My 3 Mentors. They are so much of a Blessing that I also wish to share my knowledge.
Vive Le Autist!
1INCHUSD

Triangle pattern!1INCH has been trading below the primary resistance level of $0.550 - $0.559 and forming a triangle pattern. The price is also rejected from the resistance with the confluence with the resistance line and is expected to drop slightly. A breakout of the triangle will decide the next impulsive direction. Until that, hold to any entry.

1inch token forming a bullish Gartley | A good buy opportunityHi dear friends, hope you are well and welcome to the new trade setup of 1inch token with Bitcoin pair.
Our last successful trade of 1INCH was below:
On a monthly time frame a big move of 1inch is still in play as below:
Now on a 4-hr time frame, 1INCH is about to complete a bullish Gartley pattern.
Note: Above idea is for educational purpose only. It is advised to diversify and strictly follow the stop loss, and don't get stuck with trade

1INCH Long1INCH has held this area very well when compared to other alts on the Daily. Excellent RR here for SPOT longs or low leverage traders. Buy any deep pullbacks and be patient, it will come.

1INCH is interesting for watching here1INCH / USDT
96% dump from the top with massive downtrend line without any breakout for almost 1 year
Early Signs of bulls :
– Price is testing trendline resistance for 5th time
– possible double bottom
– bullish divergence (RSI)
If btc bulls can save 18k for next few days / weeks strong bullish wave will come for altcoins market and this one will follow
So keep your eye on it

🟢 INCHUSDT - 1D (24.09.2022)🟢 1INCHUSDT
TF: 1D
Side: Long
Pattern: Falling Wedge
SL: $0.552793
TP 1: $0.616683
TP 2: $0.642395
TP 3: $0.668035
1INCH is breakout out of falling wedge.
Can enter now and DCA or wait for the price to move in to the red area around $0.584915 for retest of breakout.

Falling Wedge on the 1INCHUSDT 1INCHBased on technical factors there is a Long position in :
📊 1INCHUSDT
🔵 Long Now 0.612
🧯 Stop loss 0.525
🏹 Target 1 0.688
🏹 Target 2 0.777
🏹 Target 3 0.888
💸Capital : 1%
We hope it is profitable for you ❤️
Please support our activity with your likes👍 and comments📝

1inch looking goodaccumalating 1inch at these levels
great level to accumulate
could see a big move when we break the downtrend

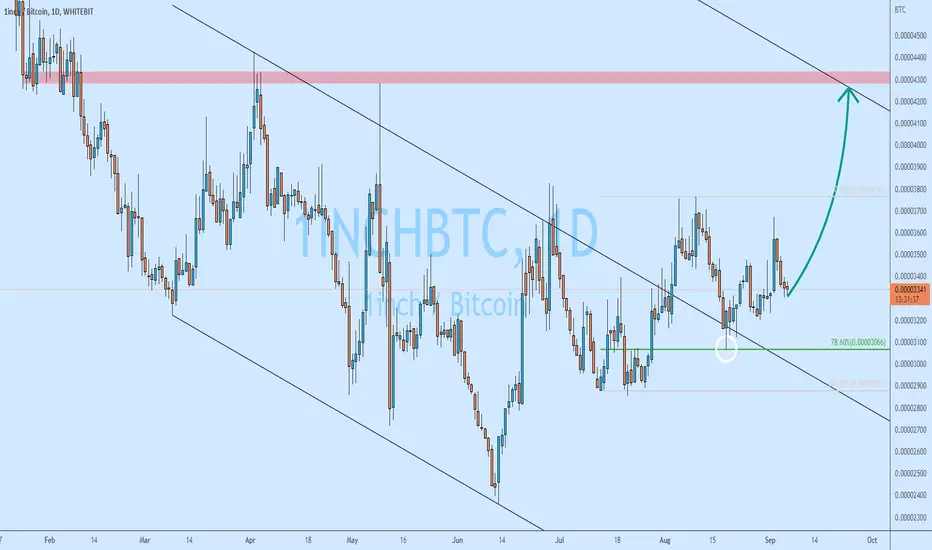
1INCH/BTC is about to explode1INCH broke above the descending channel. After the breakout, on a pullback, we can witness a clean bounce off the Fibonacci support. This leads me to the conclusion, that bulls are getting very active. Overall, fast growth is expected to the nearest supply area.
1INCH/USDT bottomed outThere is a good chance that 1INCH has finally bottomed out, perhaps along with most other cryptos. If this is the chase we should see massive growth across the board, perhaps x2 and more.

1INCH - Pullback before the RallyWe have seen relatively strong growth across multiple coins. The short-term consolidation phase might be about to begin. In this case, we'll see a 10-15% pullback across the board. In regards to 1INCH, price should test the key demand area. Then, another wave up is expected.

1INCH formed bullish Shark | A good buy opportunityHi dear friends, hope you are well and welcome to the new trade setup of 1inch token with US Dolalr pair.
Recently on 7th Aug, we had a nice trade of 1inch:
Now on a 4-hr time frame chart, 1Inch has formed bullish Shark .
Note: Above idea is for educational purpose only. It is advised to diversify and strictly follow the stop loss, and don't get stuck with trade

1INCH ... up we go? Hey, just came across 1INCH chart, and looking very interesting... simple invalidation, so really my style of trade... what do u think?

1INCH formed bullish Gartley | A good buy opportunityHi dear friends, hope you are well and welcome to the new trade setup of 1inch token with Bitcoin pair.
Previously I shared a long-term trade-setup for 1inch which is still in play as below:
Now on a 4-hour time frame, 1INCH has completed a bullish Gartley pattern. Right now, after completing the final leg it is slightly moved up, therefore, we can wait for some price correction.
Note: Above idea is for educational purpose only. It is advised to diversify and strictly follow the stop loss, and don't get stuck with trade

1İnch UsdtAlthough it looks good on the hour, it seems to decrease in the lower timeframes, let's see which one will outweigh.
please stay away from high leverage

1Inch USDT Long Forecast/SignalAfter correcting the trend in the range of 0.750, we can see the price increase to around 0.820.
Entering the trade after reaching the support line and correcting the price.

Very interesting one! 1INCH/USDTHey everyone
The 1INCH it's a very reliable coin!
Right now it's get ready to pump with all market.
Add this coin to your watchlist!
Don't miss your chance.
Best wishes!

1INCH/USDT strong buying opportunityHere we go with a buy signal for 1INCH, good RR. I am long from this point, and looking for TP within a week.

1INCH long ideasCouple of ideas for 1INCH here.
Really like this corrective channel that is on the chart, looking for that structure to break and go long to the overhead resistance once more, before reassessing.
Another good place would be, would be to sit lower, and try and get a better entry. Stops here woud have tolerance for the 0.618 fib line and the support/resistance line down below.
Best wishes to one and all!

1INCH LONG SETUPs 20220629Blue in multiple timeframe, means a long term bottom is developing.
When the breakout of the resistance is confirmed, time to Long
2 set-ups for short term and long term, with different risk rewards
1INCH 1INCHUSD 1INCHUSDT 1INCHUSDTP CRYPTO CRYPTOCURRENCY
DISCLAIMER
This is only a personal opinion and does NOT serve as investing NOR trading advice.
Please make your own decisions and be responsible for your own investing and trading Activities.

1inch - Possible short scenarioHey Guys, this is a possible short scenario. It`s high risk at the moment. Market is shit.
HAPPY TRADING | NO FINANCIAL ADVICE | DYOR

1INCH formed bullish Gartley for upto 3190% big pumpHi dear friends, hope you are well and welcome to the new trade setup of 1inch token.
On a monthly time frame, 1INCH has formed a bullish Gartley pattern:
Note: Above idea is for educational purpose only. It is advised to diversify and strictly follow the stop loss, and don't get stuck with trade

Confidence in Confluence AloneRighto. Apologies for all the million lines. They all are essential honest.
I think the rising channel will break downwards, why?
* divergence with volume
* divergence with RSI
I think the circled area will make for a good long, why?
* fibonnaci zone 0.5 to 0.618 (great zone)
* potential retest of macro diagonal resistance as support
* potential retest of recent horizontal resistance as support.
