200sma

OIL - Too much resistanceHaven't updated oil for a while. I suggested an entry at this idea:
Time to update again, because we're printing a coil for a week now.
We are at a tricky level . 2 resistance and one time problem at this point:
1.This year's downtrend line (dotted red)
2. 200 SMA (light blue)
3. Getting late in the daily cycle.
I will set this idea as neutral. I don't suggest long entry here though I'm not sure we are not breaking out of the coil and rallying higher in the following days... That's the reason I don't suggest to exit your longs from the lows because we might break out any day.
I see 2 possible scenarios:
1. We are breaking the coil in the following 2-3 days and printing a cycle top. The breakout can be even a 3-4$ breakout... When the daily cycle topped we will drop into the DCL and tag the 200 SMA with RSI oversold. That's the point where I would enter with a long position. If this case happens I will try to pick the top of the daily cycle and re-enter at the 200 SMA. MACD supports this idea . Though RSI is overbought for days and MACD is crossing over now MACD is still far from extreme levels... So this easily can turn out to be a kiss and a tag at the MACD...
2. The daily cycle tops here at the trendline and at the 200 SMA and we drop into the DCL in the next 2 weeks without new highs.
In this scenario the DCL could be at the 50 EMA ... I'm not going to play this scenario just bear the drop into the DCL and skip the troll's messages : "You missed it again." :D
We will get the answer in the next 2 weeks...
If you are overleveraged and have nice profits ( long from the trendline break at 43$) you can take profits here on half of the position and re-enter into full position at the DCL at the 200SMA.
( Some of the text can't be seen on the indicators so scroll down the MACD and the RSI)

XAUUSD - SHORTTechnical analysis only:
Pitchfork top rejection, overbought stochastics, weekly trendlines rejection, downtrend, fibonacci .618 retracement
Risk/Reward: 2.43

Major bearish RSI divergence Plus possible H&S Bitcoin The failure to form a new higher high is just one of many warning signs that Bitcoin bulls are running out of steam, and the bears are gaining strength. While the channel is still very well intact, this formation indicates that the support level of the channel is weakening and I would probably consider it a bull trap. On a weekly chart this looming correction is even more obvious. A healthy correction would be to test the previous high which is ~$1300 and this also happens to be just about the level of the 200 day MA which as anyone who has any real technical experience will tell you is a very important support level in bull markets and must be testest ever so often to maintain the primary trend and pop bubbles. Right now BTC has found support on the 50 day MA but failed to bounce off it with any real buying pressure. Not to mention, there is a MAJOR BEARISH Divergence showing in the RSI . A correction is needed and looming.
Good Luck I've been short from 2500 but this is just as good. If a HH forms obv close a short but I seriously doubt that.


USDJPY Short: Wave 5 Break + Retest (Elliott Wave TCT)USDJPY has completed wave 3 of a potential 5 wave structure. The pair has broken a trendline to complete wave (i) of 5 and is retesting the trendline at the .618 retracement To add resistance, the 200 EMA and SMA lines sit above price and below the SL level. The daily pivot may also add resistance near entry. Entry is placed at 61.8% retracement with SL above wave 4 terminus and target at the 1=5 level. This setup yields a R/R of over 5.
Bearish Confluence:
Trendline break and retest
Pivot resistance
200EMA Resistance
200SMA Resistance
Possible wave (i) of 5 completion
Significant .618 fib level at entry

AUDUSD Short: Shark + Wolfe + S/R + Trend ContinuationAUDUSD is nearing the PRZ of a bearish shark in a S/R zone that is confluent with the a bearish Wolfe Wave setup. 200 EMA and SMA may add resistance in this area. To add to bearish bias, this pair has been in a strong downtrend and this would give us an opportunity to ride it down to the .886 fib if price should reach the PRZ. Entry is placed at the shark pattern completion point with a SL above 1.272XA/Moving averages and targets at .618CD, C point, and the .886 fib retracement level.
Bearish Confluence:
Bearish shark pattern completion
2.272AB=CD
1.618BC Projection
Bearish Wolfe Wave setup
S/R Zone
200SMA Resistance
200EMA Resistance
Trend Continuation

#AUDUSD Butterfly Pattern Completion 200SMA Short#AUDUSD Butterfly Pattern Completion 200SMA Short
1. 200sma in zone
2. Butterfly Pattern Completion
3. ABCD Pattern Completion
4. Previous Supply Area in zone
-@TradeYodha
TradeYodha.com

#AUDUSD 50sma Retest Long #Forex #Trade Idea#AUDUSD 50sma Retest Long #Forex #Trade
Further to previous idea, here is another chance for us to log long and probably meet extended targets too.
@TradeYodha
TradYodha.com

#EURUSD Short #Trade SMA Retest Fibonacci Structure #Forex#EURUSD Short #Trade SMA Retest Fibonacci Structure #Forex @TradeYodha
1. Price tested 200sma 2 times in past and now trying to test one again.
2. 10sma is lagging so price may come back up at 10sma level to give us a short opportunity
3. Price is currently in downtrend and is not oversold yet.
4. Targets will be at 127.2 and 1.618 fib extensions where advanced pattern complete.

#EURUSD Short (200sma, ABCD Pattern, Fibonacci Extension)@TradeYodha
TradeYodha.com
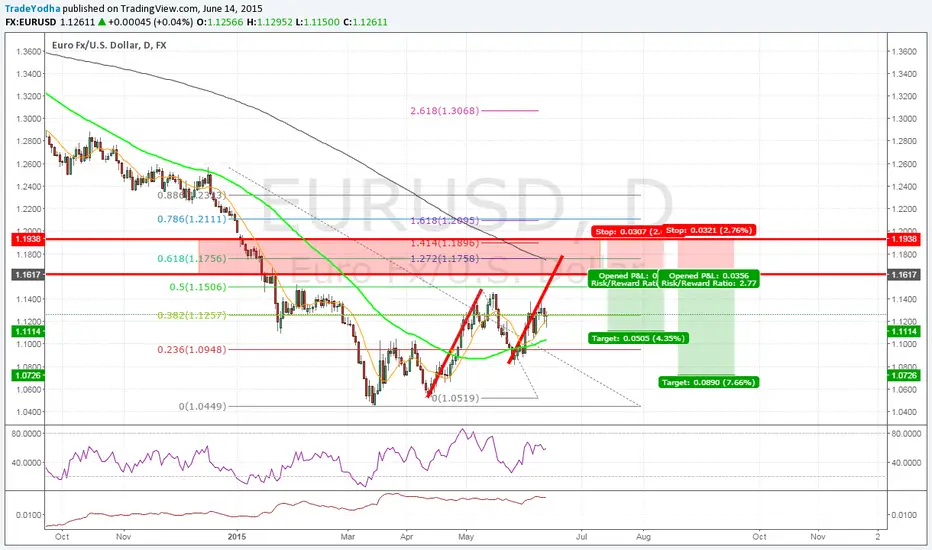
#EURUSD Short (200sma, ABCD Pattern, Fibonacci Extension)
Analysis
1. Previously Weekly Structure Zone
2. Fibonacci 61.8 confluence with 200sma
3. Fibonacci extension 127.2 perfect confluence with 61.8 fib level
4. ABCD harmonic pattern in the zone
Trade Management:
1. Two Targets
2. First target completes at 1:1 R/R ratio
3. Second target is a bit lower
4. As soon the target 1 is hit, its stop is moved to the target level
News/Fundamentals
1. Greece news (15/06/2015 IMF Loan Repayment Due)
2. 15-June-2015 9:00am EUR ECB President Draghi Speaks
#EURUSD Possibility of Bigger Bat Pattern Forming (50sma,200sma)#EURUSD Possibility of Bigger Bat Pattern Forming (50sma,200sma)
@TradeYodha
TradeYodha.com
This is in compliance with previous trade ideas as attached:

#USDCAD Short Idea (Cypher, Fibonacci, Structure, 200sma)#USDCAD Short Idea (Cypher, Fibonacci, Structure, 200sma)
@TradeYodha (TradeYodha.com)
Analysis:
1. 200 sma in the zone
2. 78.6 fib showing potential Cypher Pattern
3. DXY is showing a little opportunity to go long fir a retracement so is USDCAD
Trade Execution:
1. 2 Orders
2. One will be 1:1 limit
3. Second Order based on the confirmation in zone.
News/Fundamentals:
May 05: 12:30pm CAD Trade Balance
May 05: 12:30 USD Trade Balance
May 05: 2:00pm USD ISM Non-Manufacturing PMI
I would love to hear your opinion, feel free to agree or disagree in your comments. Please give it a (thumsup) if it makes any sense.

#USDCAD short idea (200sma, harmonics)#USDCAD short idea
@TradeYodha
(TradeYodha.com)
Analysis:
1. 200 sma in the zone
2. 10sma is ahead of 50sma showing price moving upwards
3. On higher time frame (4H) the 50sma is reaching the zone.
4. The next possible resistance level is in the zone.
5. RSI is not oversold yet.
6. If the price reaches the zone, it will complete ABCD pattern
7. As DXY is not looking very strong we can go for extended targets too.
Trade Execution:
1. Have 2 orders
2. First order will be limit order with 1:1 R/R ratio
3. The second order will be extended target all the way to down point. It will be taken inside the zone to minimise the risk and have a better confirmation.
News Fundamentals:
27 April: 1:45pm USD Flash Services PMI
28 April: 12:45pm CAD BOC Gov Poloz Speaks
28 April: 2:00pm USD CB Consumer Confidence
I would love to hear your opinion, feel free to agree or disagree in your comments. Please give it a (thumsup) if it makes any sense.

#USDJPY Short Idea (Butterfly, Harmonics, 200sma)#USDJPY Short Idea (Butterfly, Harmonics, 200sma)
@TradeYodha
TradeYodha.com
Further my analysis which resulted in very good profits:
Analysis:
1. On higher time frame it is ultimately forming Head and shoulders pattern
2. 10 sma has gone past 200 sma and 50 sma showing high downward momentum
3. Price is not stretched away from 10 sma indicating the transition coming back to it will be slower
4. 200 sma in the zone
5. zone has 38.2 retracement level of current leg
6. If the price retraces from the zone, it may form a butterfly patter for very good targets
Trade Execution:
1. Have 3 orders
2. First order will be a limit order with approx 1:1 R/R ratio
3. Second order and the third order will be put in if we get a confirmation in the zone
4. Second order have target of 127.2 extension
5. Third order will have target at the completion of butterfly pattern at 161.8 level.
News/Fundamentals:
27 April: 1:45pm USD Flash Services PMI
27 April: 11:50pm JPY Retail Sales y/y
28 April: 2:00pm USD CB Consumer Confidence
I would love to hear your opinion, feel free to agree or disagree in your comments. Please give it a (thumsup) if it makes any sense.

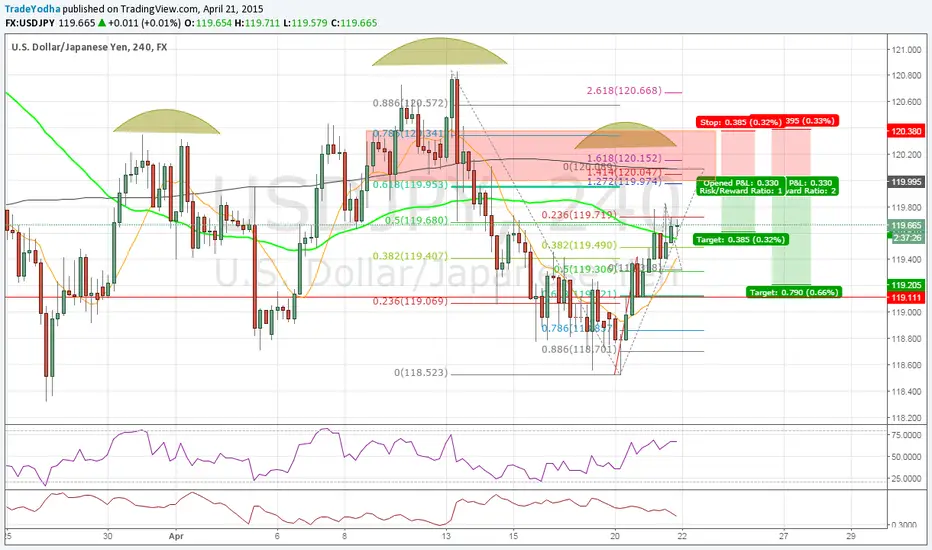
#USDJPY Short Idea (Structure, Fibonacci, Head and Shoulders)#USDJPY Short Idea (Structure, Fibonacci)
@TradeYodha
TradeYodha.com
1. Is Daily chart showing us a possibility of H&S (Head and Shoulders) forming?
2. on 4H zone we have 200sma. The price has closed above 50sma so the next target can only be 200sma
3. 200sma is in an important area where there is a lot of fib confluence indicating formation of advanced patterns
4. The price is close to 70 RSI at the moment so there are chances for it to go over bought by the time it reaches the zone.
News/Fundamentals Expected:
21 April: 11:50pm JPY Trade Balance
23 April: 12:30pm USD Unemployment Claims
I would love to hear your opinion, feel free to agree or disagree in your comments. Please give it a (thumsup) if it makes any sense.
EURJPY SHORTPRICE IS STRUGGLING AT AN IMPORTANT STRUCTURE WHICH HAS ALSO FORMED A SMALL DOUBLE TOP. PRICE ACTION IS SHOWING THAT SELLERS ARE PROTECTING THIS LEVEL. THIS IS LOOKING LIKE A GOOD OPPORTUNITY TO GO SHORT IN LINE WITH THE DOWNTREND. IF PRICE MANAGES TO BREAK THE STRUCTURE LEVEL THEN THE NEXT LEVEL TO LOOK TO SELL IS AT THE 200 SMA WHICH HAS BEEN ACTING AS A DYNAMIC TRENDLINE/RESISTANCE AND IT IS ALSO IN CONFLUENCE WITH THE 61.8 FIB LEVEL WHICH IS MAKING THIS TARE A HIGH PORTABILITY WE COULD GET SOME DOWNSIDE PRESSURE. TARGET AT 126.000

#EURUSD Short Idea (Fibonacci, Structure, 50sma, Harmonics)#EURUSD Short Idea (Fibonacci, Structure, 50sma, Harmonics)
1. Daily Chart showing price may get attracted to 50sma (it may ultimately be forming Gartley to retest 1.2000 level)
2. on 4H:
a. Price has already hit 61.8 level but has closed above 200sma. That shows that it has potential to higher than 61.8
b. The next level of 78.6 has high fibonacci confluence
3. This zone had high supply in past too
4. Target 1:1
News/Fundamentals:
1. German ZEW economic sentiment expected 10:00 am London Time

#GBPNZD Cypher and Bat Short Idea#GBPNZD Cypher Short Idea
@TradeYodha (TradeYodha.com)
1. Cypher Pattern and Bat patterns complete in the zone
2. 200 sma in the region
I would love to hear your opinion, feel free to agree or disagree in your comments. Please give it a (thumsup) if it makes any sense.

GBPUSD 4 HOUR SHORT LOTS OF UNCERTAINTY WITH GBP BECAUSE OF THE ELECTION WHICH IS CAUSING THE POUND TO DEPRECIATE. PRICE BROKE OUT OF THE RANGE LAST WEEK AND IT IS NOW LOOKING TO RETEST THE RANGE LEVEL (SUPPORT TURNED RESISTANCE). THIS IS A TEXTBOOK TREND CONTINUATION PATTERN (BREAK,RETEST,CONTINUATION) IF PRICE MANHES TO RETRACE BACK UP TO MY SELL ZONE I ALSO HAVE 2 FIB CONFLUENCES WHICH ARE THE 38.2 AND 50 FIB LEVEL. TARGET BACK DOWN AT SWING LOW WHICH IS ALSO A PSYCHOLOGICAL LEVEL.(1.46000) ALSO PRICE SEEMS TO BE APPROACHING A DYNAMIC RESISTANCE (20SMA)

#NZDUSD Multiple Opportunities 4H/1H (Gartley, Structure)#NZDUSD Multiple Opportunities (Gartley, Structure)
@TradeYodha (TradeYodha.com)
1. 4H can form a Gartley Pattern but point B is a good support area so we can have a bounce from there too. It has 200sma in it.
This gives us 2 opportinities for Long. First at point B and second at D
2. Point B can be seen in 1H chart as lower zone. We can target 1:1 R/R
3. 1H is in downtrend and on 1H chart 50 sma is lagging behind which can attract the price to it creating a short opportunity. Take 1:1 R/R with extended targets into lower zone where we will take our long opportunity
I would love to hear your opinion, feel free to agree or disagree in your comments. Please give it a (thumsup) if it makes any sense.

#GBPCAD Daily/4H Short Idea (Cypher)#GBPCAD Daily/4H Short Idea (Cypher)
@TradeYodha (TradeYodha.com)
1. Cypher Pattern in the zone
2. 200 sma close to the zone
3. possible harmonic move
Wait for confirmation in the zone
I would love to hear your opinion, feel free to agree or disagree in your comments. Please give it a (thumsup) if it makes any sense.

#EURJPY Daily/4H Short Idea (Gartley, Harmonics, Structure)#EURJPY Daily/4H Short Idea
@TradeYodha (TradeYodha.com)
1. Daily 50sma in the zone
2. 4H 200sma is in the zone
3. Fibonacci Cluster
4. Possible harmonic move on 4H
5. Very good R/R ratio if market holds this level on Daily as well.
6. Gartley Pattern in the zone
Wait for confirmation in the zone
I would love to hear your opinion, feel free to agree or disagree in your comments. Please give it a (thumsup) if it makes any sense.
