HYPEUSDT.P 4H Chart Analysis | Volume Surges...HYPEUSDT.P 4H Chart Analysis | Volume Surges As Price Approaches ATH
🔍 Let’s break down the HYPE/USDT perpetual contract and scope out bullish momentum alongside key technical catalysts.
⏳ 4-Hour Overview
The 4-hour chart confirms an upward trend, reinforced by strong candle structure and sustained volume inflows. Price is approaching its all-time high (ATH) around $49.618, making this level crucial for the next directional move.
📊 Key Highlights:
- Volume: Noticeable volume convergence during the latest upward leg, demonstrating strong buyer interest as price accelerates toward ATH.
- 3SMA Trend: Moving averages (7, 25, 99) currently support the bullish structure, with price action maintaining strength above these key levels at $47.224, $45.752, and $41.744, respectively.
- Upward Trend: Higher lows and consistent higher highs define strong momentum, while the chart illustrates bullish continuation potential after consolidation.
- ATH Test: A breakout and hold above all-time high could open the door for further rallies, especially if volume continues to expand in sync with price.
🌐 DeFi Momentum
- Total Value Locked (TVL): DeFi markets are surging with $2.237B TVL across top protocols, underscoring broader sector confidence.
- Top 10: HYPEUSDT's movement mirrors strength seen among top DeFi assets, hinting at sector-wide bullish alignment.
🚨 Conclusion:
HYPEUSDT is building bullish energy as it tests the ATH with volume backing the move. Keep a close eye on price action near resistance—if buyers sustain momentum, next targets could materialize quickly. Support rests on 3SMA levels, with DeFi sector trends providing further tailwinds.
3sma

CHAINLINKUSDT Daily Chart Analysis | Channel BreakoutCHAINLINKUSDT Daily Chart Analysis | Channel Breakout & Bullish Momentum
🔍 Let’s dive into the ChainLink/USDT spot chart, analyzing key swings, channel dynamics, and fresh momentum signals for a bullish scenario.
⏳ 1-Day Overview
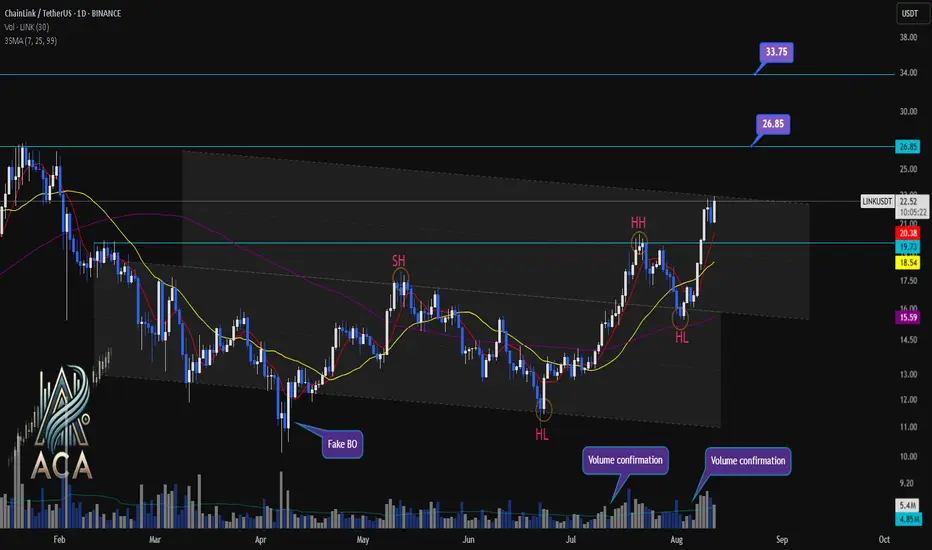
The daily chart shows LINKUSDT surging toward the RR1 (Risk-Reward 1) of its channel pattern, marked by powerful volume confirmations that help validate the move. Price has decisively broken above prior resistance zones and continues to print higher highs (HH) and higher lows (HL). The chart’s swing structure is clear: a series of ascending pivots signaling a bullish reversal from past lows.
🔺 Channel, Swings & Momentum:
- Price action is respecting the well-defined channel; current breakout and move to RR1 highlights bullish control.
- Swings are established: recent HL and HH confirm upward structure.
- Volume spikes on breakouts further confirm buyer strength, supporting the move out of consolidation.
- 3SMA (7, 25, 99) alignment shows short- and medium-term averages crossing above the long-term trend—often a leading indicator for the start of a strong uptrend.
- Next targeted levels stand at $26.85 and $33.75, while the long-term target remains a fresh All-Time High (ATH), should momentum persist.
- Past “Fake BO” (breakout) risk now superseded by true volume-backed move supported by technical confirmations.
📊 Key Highlights:
- Channel breakout with confirmation at RR1, swing HH/HL structure for bullish momentum.
- Volume surges on upward moves—critical for authenticating breakout strength.
- 3SMA configuration points to the potential beginning of a major trend extension.
- Upside targets: $26.85 for the next level, $33.75 as extension, and new ATH as the bold long-term bull case.
🚨 Conclusion:
ChainLink’s breakout above channel resistance signals bullish intent with strong volume and swing confirmation. Eyes on next targets: $26.85 and $33.75. If volume and trend continue, new ATH is on the horizon.
LDOUSDT Daily Chart Analysis | Strong Momentum BuildingLDOUSDT Daily Chart Analysis | Strong Momentum Building
🔍 Let’s dive into the LDO/USDT perpetual contract and analyze the latest price action, highlighting a powerful bullish setup and key technical signals on the daily chart.
⏳ Daily Overview
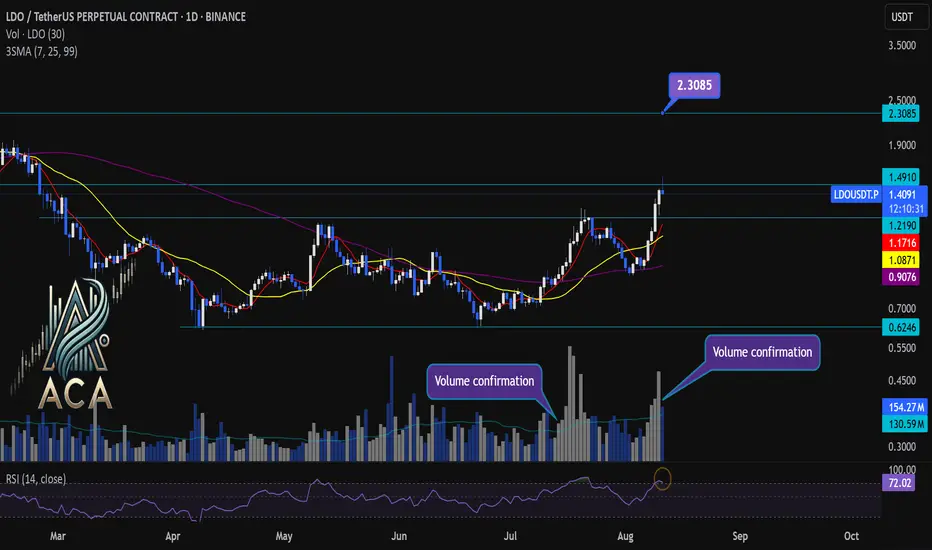
The daily chart reveals a strong surge in momentum as the price breaks out of its recent range, accompanied by a decisive uptick in trading volume. The 3SMA setup (short-term, mid-term, and long-term moving averages) is aligning bullishly, marking the beginning of a strong uptrend.
📊 Key Highlights:
- RSI (14) is entering the overbought zone (currently at 73.39), reflecting surging buyer demand and intensifying momentum.
- Price has broken out of the range box with elevated volume, confirming the move.
- Multiple volume confirmation spikes signal conviction behind the breakout.
- Immediate resistance is being challenged; the next key target to watch is $2.3085.
- For continued upside, we must see a daily candle close with solid volume above the current resistance level.
🚨 Conclusion:
Momentum is clearly accelerating on LDOUSDT, supported by volume and moving average bullish alignment. If price closes above resistance with strong volume, a continued rally toward the $2.3085 target is likely. Keep an eye on RSI levels and volume for further confirmations as this trend builds!
GMT Daily Analysis | Bearish Continuation Toward Key Support👀 Welcome to my Trading View Analysis and Trading Channel Here , we share the latest market analysis, trading signals, and key insights together .
Ready for smarter trades ? ⭐️
🧠 Technical Analysis of GMT Coin – Daily Timeframe
This analysis reviews the recent price behavior of GMT coin on the daily chart. Based on the current market structure, there are multiple technical signals suggesting the continuation of the downtrend and a possible entry into a consolidation phase.
1. 🚀 Sharp Uptrend Followed by a Correction Phase
Initially, GMT experienced a sharp bullish rally, accompanied by a noticeable surge in trading volume, pushing the price to higher levels. However, after the rally peaked, the price entered a corrective phase that still appears to be ongoing.
2. ❌ Breakdown of the Key $0.058 Support Level
One of the most critical developments during the correction was the breakdown of the $0.058 support zone. This level had previously acted as a strong support area. Its failure signals growing selling pressure and increases the likelihood of the downtrend continuing.
3. 📉 Bearish Reaction to the 3 SMA Indicator
During its downward movement, the price encountered the 3 SMA indicator (a combination of three Simple Moving Averages). The key observations are:
All recent candlesticks have closed below the SMA lines
This is considered a strong bearish confirmation in technical analysis
It also highlights the dominance of sellers at this stage of the market
4. 🛡 Major Support Area at $0.043
Given the ongoing bearish pressure, the $0.043 support level has become a critical area to watch. Historically, this level has successfully prevented further declines and may act as a strong support once again.
If the price reaches this zone, it may:
Show a supportive reaction (respect the level)
Enter a short-term consolidation range
Or potentially initiate a new bullish wave, depending on candlestick formations and trading volume around that level
✅ Final Summary:
The overall trend remains bearish for now
The break of $0.058 and candlestick closures below the 3 SMA confirm ongoing selling pressure
The $0.043 level is a critical support zone that could trigger a potential reversal or consolidation
🗞 Recent GMT Weekly Highlights
Here are the key developments from the past week in the GMT ecosystem:
1️⃣ 🔥 Buyback & Burn of 600M GMT Tokens
GMT DAO announced a massive buyback of 600 million tokens worth around $100M. After a community vote, these tokens may be burned — a move expected to reduce supply and potentially support price growth.
2️⃣ 👟 Adidas Partnership & NFT Sneakers
The STEPN project partnered with Adidas to launch 1,200 limited edition physical sneakers tied to NFTs. This collaboration aims to boost brand visibility and attract new users.
3️⃣ 🎁 Massive Community Airdrop
An additional 600 million GMT tokens will be distributed via airdrop to increase community engagement and encourage participation in DAO governance.
I love you all so much . 👀
don't forget about capital management and risk management .
Be careful with your positions . 🥇

LISTAUSDT | Rank : 1009👀 Welcome to my Trading View Analysis and Trading Channel Here , we share the latest market analysis, trading signals, and key insights together .
Ready for smarter trades ? ⭐️
⚡️Today , we're going to analyze the ALPINE (Alpine F1 Team Fan Token
) coin together on the daily timeframe and find triggers for our positions .
✨The outlook for the coming days looks very promising . We are witnessing a breakout from the descending trendline , which typically indicates positive changes in price . Additionally , a retest of this trendline has been performed and confirmed that the breakout is genuine and can be trusted .
🚀Moreover , the horizontal resistances that usually hinder price increases have now been cleared , and this is a sign of the strength of the upcoming bullish trend . In lower time frames , a bullish flag pattern has also formed , which generally indicates the potential for further price increases .
📊Given these conditions and the patterns observed in the market , we expect the price to double in the coming days , creating great investment opportunities . Therefore , we can confidently look forward to the bullish trend ahead and be prepared to enter the market! "
I researched this coin on CoinMarketCap on your behalf , and I'm sharing a summary of the information I gathered .
Read carefully , as you need to have this information . 🌈
The Alpine F1 Team Fan Token, also known by the symbol "ALPINE," is a type of non-fungible token (NFT) and fan token associated with the Alpine Formula One team. These tokens allow fans to participate in decisions related to the team and enjoy specific benefits.
### Key Features of the Alpine F1 Team Fan Token:
1. Fan Participation: By holding this token, fans can take part in polls and decisions concerning the team. These decisions may include choosing the color and design of the team's outfits or even naming certain elements of the team.
2. Benefits and Rewards: Holders of fan tokens typically receive special advantages such as ticket discounts, access to exclusive events, or closer interaction with the team.
3. Socio s.com Platform: The Alpine F1 Team fan tokens are usually offered on the Socios .com platform, allowing fans to buy and sell their tokens.
4. Exclusive Experiences: Token holders can gain access to unique and exclusive experiences, such as meeting drivers, attending special events, and more.
These tokens enable fans not only to show their support for the team but also to play a part in the team's management and decision-making processes. For more precise information, it's always recommended to refer to official resources and the team's website.
I love you all so much . 👀
don't forget about capital management and risk management .
Be careful with your positions . 🥇

Possible short from this zonePrice has retraced back into the 4hr 3sma DSR zone.
Wait for price action formation on a lower time frame (1hr) to confirm whether retracement is coming to an end.

Possible reveral from this zoneCADJPY is trending nicely on the 4hr chart. On the 1hr we can see the pullback retracement to this hot zone.
Wait for a price action/formation to hint that the main trend is continuing.
