BTC 4-year-cycle-theory , when&where next topIf we look at past cycle top to top the numbers are:
3927%, 1433%, 256% and 82% gain from top to next top which is clearly diminishing.
Time from top to top was: 910, 1470, 1428, 1428 days.
Finger in the air if next cycle again matches the past 4-year-cycles:
Between 25% and 60% gain until Q3 2029 from the last top (125k).
This would put you around 205k bull case, and 160k bear case.
4yearcycle

How deep will the Bitcoin bear market retrace?We have already hit the 0.382 linear retrace level and the Bitcoin price is still bearishly consolidating.
So further downside is to be expected.
The question is how deep and do we have any confluent levels comparing the two fibonnaci's.
The answer is YES around the 50 thousand mark..
Which is an obvious key level to probe and ask questions of IMO

Bitcoin a sinking ship...Why would I say such a thing..?!
Because early long term holders and whales are aggressively selling down their holdings.
Like Rats fleeing a sinking ship.
Creating unprecedented supply pressure.
While on-chain activity has stagnated since 2017 and BTC is underperforming less volatile risk assets like Tech stocks.
So in summation.
Active wallets on the network is steadily declining.
As there is no real usage as peer-to-peer cash.
LTH holder's are no longer buying the dips (they may step in at far lower prices ... i.e. sub $50k)
Fading demand. Search metrics have fallen off a cliff.
Poor Risk-Adjusted performance.
Higher Volatility and negligible outperformance (if any)
EASY GAINS are no longer available.
Market Timing is essential for outperformance.
#HODL narrative is dead.

BTC NEXT CYCLEFor BTC/USD, I have two plans for preparing for the next cycle. If the price is able to break through the FAIR VALUE GAP WEEKLY and turn it into an INVERSE FAIR VALUE GAP first, then it is highly likely that BTC/USD will enter a SUPER CYCLE. However, if the price breaks through the WEEKLY ORDER BLOCK first, BTC/USD will return to the 4-YEAR CYCLE. In this cycle, I will buy BTC/USD at the WEEKLY ORDER BLOCK or MONTHLY BALANCE PRICE RANGE. My TP target for both cycles is USD 229,780.00. However, I will partially take profit at 200,000.00 USD. I obtained this target from STANDARD DEVIATION - 4, which is the result of marking FIBBONACCI RETRACEMENT on the ATH cycle 2021 to SWING LOW cycle 2025. Why did I use this? because in the previous cycle, after BTC/USD touched around the STANDARD DEVIATION - 2 area, the price immediately dropped below and ended the cycle, so I use this as my reference for TP in this cycle. (DISCLAIMER ON)

Stay in channel or breakdown and fall out of channel?Been in these parallel channels based of the black trend line since q1, q2 of 2013 until now December 2025 where it's still inside, only falling out for a few weeks in q2 of 2013 and the first 3 quarters of 2015. Every time during this span when it hit the bottom of the bottom channel or fell under it was a low and good buying opportunity. Been in it over 10 yrs give or take besides when falling under the trendline and parallel channels. I'm not an experienced TA person or charter, so I don't know if it is more likely to stay in the channels and above the trendline making this a low, or if it's more likely for it to breakdown and fall under the trendline. If it's the latter then that would go with the 4yr bull/bear market pattern and theory that it is continuing right now and bear market started in October and the top is in. Idk if it is more likely than not if that's the case just by looking at the charts, or if the cycle pattern will break or change and extend, and this be a low before going higher to the top of one of the mini parallel channels and have an alt season before a bear market. Or if the whole structure in general is changing. So I'm putting this up to ask y'all more experienced charters to tell me your takes.

$BTC Cycle Analysis - ISM vs 4-Year CycleRiddle me this...
If crypto just runs off the ISM and it topped in March 2021 then why did we get a second HIGHER peak in November 2021 ???
All social and risk metrics topped at the same time as the ISM as well...
It's almost as if 🤔

A NEW YEARS GIFT! CHEAP SHITCOINS!OTHERS Index
Has a Clear head and Shoulders
That could see an acceleration and further deterioration of #Altcoins
With major Capitulation's possible
protocol's could suffer hacks, exploits and rugs
Be careful of leveraged positions
And be aware of the risks of certain #defi platforms.
#sol
#sui
#ada
#eth
#bnb
#pulsechain
#btc

BITCOIN's PUMPs are Getting LARGER this Bull Market...However, it may take a bit longer to realize those expansionary moves.
If Bitcoin adheres to the established cycle pattern, we can anticipate a minimum surge of 103% that should carry us into the fourth quarter of this year.
Consolidation ----> Fake breakdown ----> then expansion.
Are you ready?

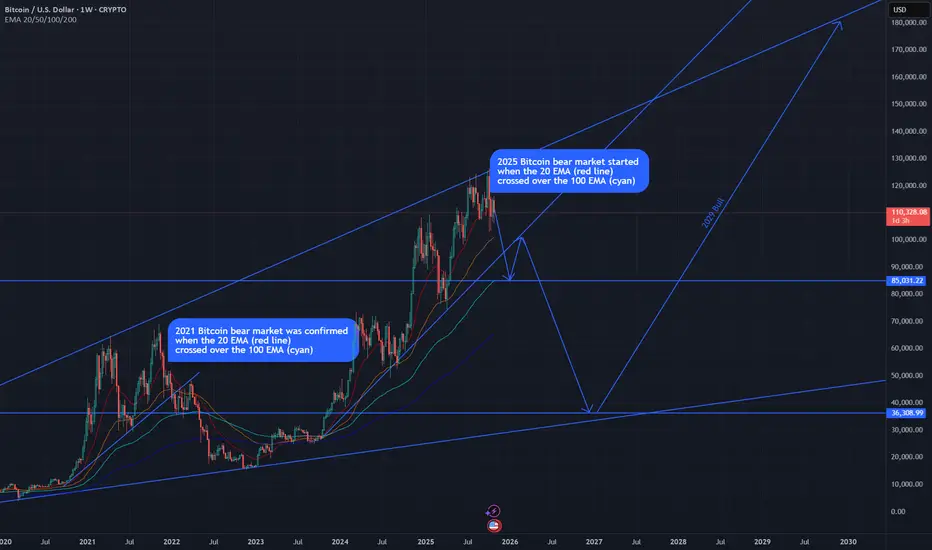
Bitcoin Beyond 2025, Path to 2029 Peak & 4 year cycleLikely bitcoin price movement for the rest of 2025 to the bear market bottom of 2026/27 and finally to the next bull peak of 2029
Check in early 2027 for accuracy

Bitcoin Beyond 2025, Path to 2029 PeakLikely bitcoin price movement for the rest of 2025 to the bear market bottom of 2026/27 and finally to the next bull peak of 2029
Check in early 2027 for accuracy
Bitcoin 2025-2029 CycleLikely bitcoin price movement for the rest of 2025 to the bear market bottom of 2026/27 and finally to the next bull peak of 2029
Check in early 2027 for accuracy

13/10/25 Weekly OutlookLast weeks high: $126,237.39
Last weeks low: $102,038.44
Midpoint: $114,137.92
Well that was an interesting week... A small reminder that when Trump talks about tariffs the markets move, and move fast!
From All-Time-High at the beginning of the week to a -19.2% move, a single hourly candle had -10.56% drawdown alone!
What can be learnt from this? Despite all the technical analysis in the world, if the President of the United States makes an announcement it can shift the market greatly causing a leverage unwind via liquidations that cascade aggressively. Although these large scale crashes are rare, they are inevitable in this market and this will not be the last of its kind.
This week will be very interesting because generally we do see a lot of backfilling the wick which would mean revisiting the key S/R level at 0.25 ($108,000). The bulls would not want to see price acceptance under this level or IMO this is the beginning of a bearish shift in HTF structure. This potential shift in structure would also line up with the 4 year cycle theory as October marks the end of the bull market.
On the other hand, the bounce from the low has been strong, although still some way off the origin of the dump a lot of ground has been recovered. In the past these liquidation events have marked local lows in the market and serve as a launchpad for the next leg up. I do think it's too early to tell if that is the case this time around, I am in no rush to position either way until at least Mondays range is established.
The altcoin market took a far worse turn, majors sinking as much as 80% in a single move! This week will be important to learn what projects are truly supported/fundamentally sound by how they recover.
Projects such as: ZEC, TAO, ANYONE and BNB have all closed higher than their original price before the crash, other projects may never recover.
Good luck this week everybody!

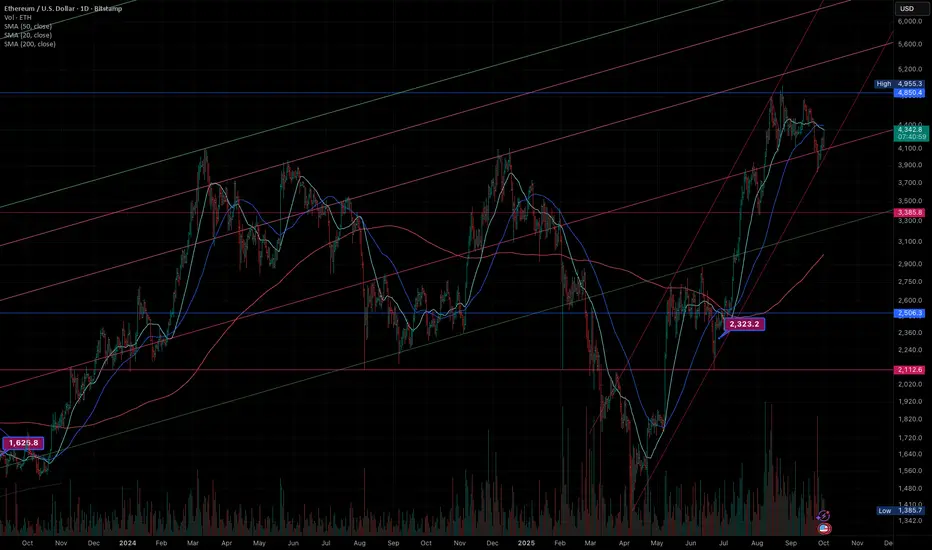
ETH Macro analysis and current cycle targets of $16k-20KI’ve been invested in Ethereum since 2020. Along the way, I took some profits above $4,000 and later rebuilt my position around $1,650. My conviction is rooted in direct experience—after 23 years working in IT, I clearly see both the strengths and limitations of the technology.
What I recognized back in 2020—its dominance, brand recognition, the credibility of its founder, and the trust it commands—is only now becoming clear to the broader market. This is reflected in the growing wave of ETH-based treasury products and institutional adoption.
For me, DeFi was never the main driver. While it has been an important use case, I believe Ethereum’s long-term value will come from its network dominance and trust, which will inevitably extend across multiple industries and verticals.
The logarithmic price chart of ETH since its inception illustrates this well. Historically, each cycle has peaked at roughly 3.4x the previous cycle’s high. If that pattern continues, it aligns with the upper band of the long-term log channel—suggesting potential in the $16K–$20K range during the next cycle.
I don't overthink; I go with what I see and what I know to be the macro trend.
28/09/25 Weekly OutlookLast weeks high: $115,537.51
Last weeks low: $108,606.86
Midpoint: $112,072.19
As BTC continued to trend down post FOMC the key HTF level of $108,500, after some chop at this level a late rally on Sunday has pushed BTC back to the Midpoint of the range for this week.
As September comes to a close we are at the point where banks window dress their balance sheets by de-risking going into Q4. Banks taking cash out of the market to appear there is less risk and more liquid to hide their true risk over the quarter. This lowers liquidity and for this reason I do not expect the bulls to be out of the woods yet and the weekly low ($108k) could be under attack again before the week closes.
The story is the same for much of the altcoin market, after continued downtrend majors are bouncing off key HTF S/R levels but conviction is still low due to quarter end.
This week I am looking at how BTC finishes the week once the month/quarter end is out of the way. If their is renewed optimism October.
In terms of seasonality October has an average return rate of 21.89% since 2019.
Should price break below weekly low the bullish HTF trend would be questioned and would open the door to a deeper correction. With the 4-year cycle predicted to end in late October there would be huge talk of the cycle repeating and the bear market beginning.
Good luck this week everybody!

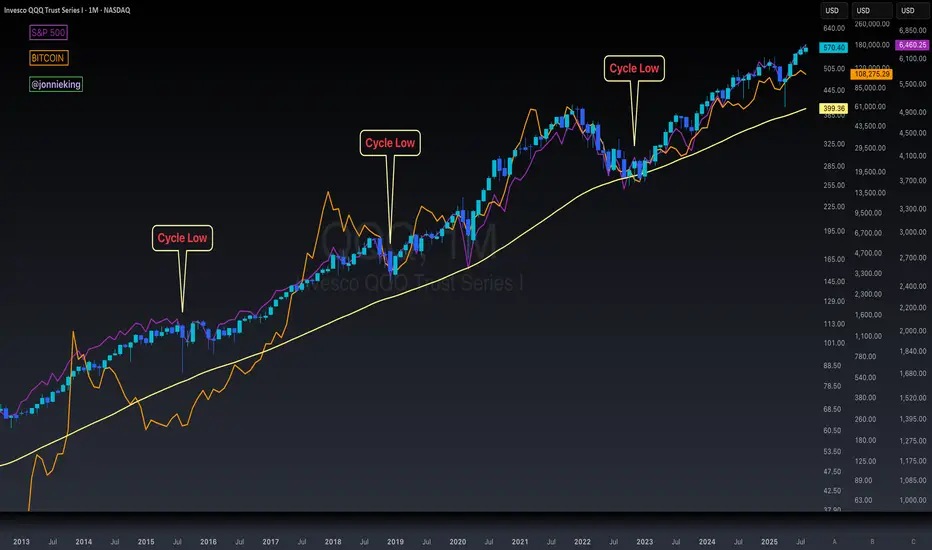
$BTC 4-Year Cycle Is NOT Dead According to $QQQ $SPXIt’s really weird cause everyone keeps telling me the ₿itcoin 4-year cycle is dead yet Nasdaq and S&P 500 follow nearly the exact same pattern with cycle lows 🤓
It’s almost as-if monetary and fiscal policy creates this boom and bust cycle every 4-years 🤔
Question for the “this time is different people”….
Will NASDAQ:QQQ and SP:SPX not have similar bear markets as we’ve seen in the past along with CRYPTOCAP:BTC ?
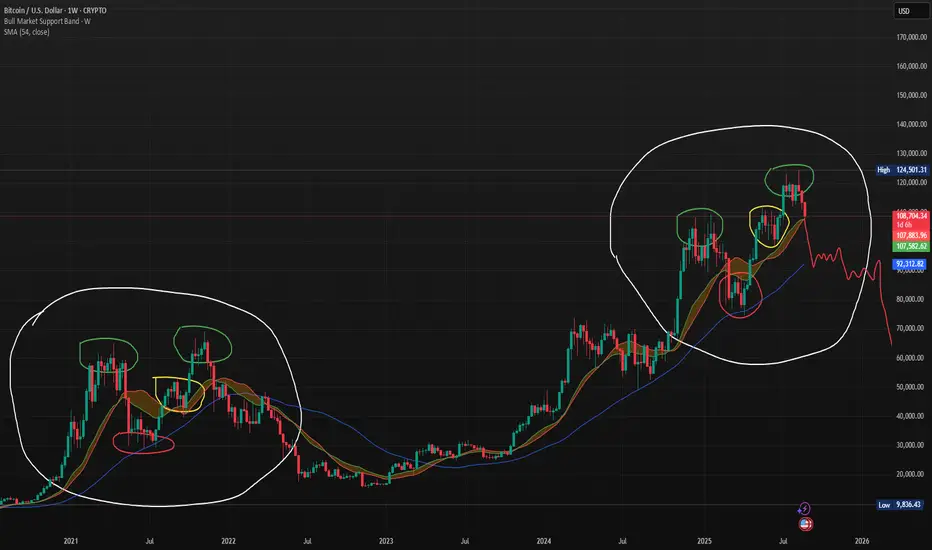
Bitcoin Weekly Chart – Is the 4 Year Cycle Over?This chart compares Bitcoin’s current weekly price action to its 2021 market structure. Both periods show striking similarities: double-top patterns (green circles), mid-cycle consolidations (yellow highlights), and support retests (red circles) within the bull market support band. The projection in red outlines a potential bearish scenario, where BTC could follow a similar path to the last cycle—breaking below support and entering a prolonged corrective phase. Traders should watch the $92K SMA and bull market support band closely as critical levels for trend confirmation.
A disappointing #Altcoin season? Maybe! OTHERS.d/BTC.dMaking gains in #Crypto has gotten harder and harder with each passing cycle for the vast majority of participants.
That is an unquestionable truth that I see and hear from people.
#Bitcoin itself is in it's 4th Hype cycle... which is bearish
2013 Mt Gox ponzi cycle top/collapse
2017 Eth/ICO craze, CME futures. CNBC XRP shill top.
2021 Uniswap/DEFI innovation , Elon doge /Coinbase IPO top.
2024/5 Memecoins craze --- topping signals are already appearing Andrew Tate / Iggy Azalea at NYSE. A Trump Election Win could be the final nail in the coffin whilst ppl celebrate the news and January 2025 Inauguration may seal crypto's fate.
The left translated 4 year cycle is a definite possibility as made popular by #BobLoukas
We know that retail investors are rejecting High valued VC backed projects and rather take high risk gambles on #Memecoins for a chance to be early... this is not bullish behaviour obviously!
As only a tiny percentage of people can win at that game and often it is not YOU!
Once that speculative capital & energy is rinsed many people will be left holding a worthless bag of tokens.
#Leverage trading destroys many people's lives
And a digital store of value whilst has obviously it's merits is unlikely to flip #Gold in marketcap imho
It cannot compete with a 5000 year history of storing wealth for generation to generation.
I can bury Gold coins in my garden and dig them up in 50 years knowing full well that they will have value.
Would you do that with a trezor? Lol.
So what do we do ... try to take advantage of the next 6 months and rotate S coin profits into
#Stablecoins and maybe a small allocation to #PAXG #XAUT (buyer beware on those gold backed #RWA coins obviously)
This should buy you enough time, to let you assess the fallout of any top that may occur this Christmas/new year.
Remember many people and especially the Bitcoin community will be partying and celebrating the 15 year journey of a $100k plus BTC.
You must avoid being sucked into that hype and cash in a good chunk of your crypto portfolio IMO
This is just a scenario I give to you ... and not a prediction ofc.
We are trying to predict the future irrational behaviour of humans, an almost impossible task. But as the wall St cheat sheet demonstrates speculative bubbles, generally do repeat often enough for us to try and capture profits from them.
So we watch and wait, place our bets and see where the chips may fall, one foot in and one foot out is my general kind of viewpoint of how most people should be thinking at this stage of the cycle.

$BTC Cheat Sheet They Don't Want You To See!THE CRYPTO CHEAT SHEET
After seeing this, don't let anyone tell you that trading the market is hard.
All you need is a 4-year mindset.
Sell in November (the latest) post-halving year, ie 2025
Buy in November the year after, ie 2026
It really is that simple.
CRYPTOCAP:BTC 👑

The quickening of #BTC RSI & price extremes!I don't make the rules.
:)
We are just surfing the waves of emotions,
of the crowds.
Here we have Monthly line chart with the RSI
It clearly shows a quickening of the trend and how the 4 year cycle is likely to fail this time around.
It is too well know as a theory and will be front ran.
(in my opinion)
We should get a RSI peak at this rate, around May (could be June ofc)
and second lower peak around November (or DEC )
As always good luck in your speculations
#Crypto's are highly speculative instruments as we all know
During these tops you will be told many stories
you must have the wherewith-all to ignore the noise.

4-Year Cycles [jpkxyz]Brief Introduction why Crypto moves in Cycles.
"Crypto is an expression of Macro."
The 2007-2008 global financial crisis was a pivotal moment that fundamentally transformed monetary policy, particularly in how central banks manage economic cycles through liquidity manipulation.
Before the crisis, central banks primarily used interest rates as a blunt instrument for economic management. The 2008 financial crisis exposed deep vulnerabilities in the global financial system, particularly the interconnectedness of financial institutions and the risks of unregulated credit markets.
In response, central banks, led by the Federal Reserve, developed a more sophisticated approach to economic management:
1. Quantitative Easing (QE)
The Federal Reserve introduced large-scale asset purchases, essentially creating money to buy government bonds and mortgage-backed securities. This unprecedented monetary intervention:
- Prevented a complete economic collapse
- Provided liquidity to frozen credit markets
- Kept interest rates artificially low
- Supported asset prices and prevented a deeper recession
2. Synchronized Global Monetary Policy
Central banks worldwide began coordinating their monetary policies more closely, creating a more interconnected approach to economic management:
- Coordinated interest rate decisions
- Shared information about economic interventions
- Created global liquidity pools
3. Cyclical Liquidity Management
The new approach involves deliberately creating and managing economic cycles through:
- Periodic liquidity injections
- Strategic interest rate adjustments
- Using monetary policy as a proactive economic tool rather than a reactive one
The 4-year cycle emerged as a pattern of:
- 2-3 years of expansionary policy
- Followed by a contraction or normalization period
This cycle typically involves:
- Expanding money supply
- Lowering interest rates
- Supporting asset prices
- Then gradually withdrawing support to prevent overheating
The 2007-2008 crisis essentially forced central banks to become more active economic managers, moving from a passive regulatory role to an interventionist approach that continuously adjusts monetary conditions.
This approach represents a significant departure from previous monetary policy, where central banks now see themselves as active economic architects rather than passive observers.

BITCOIN TOP INDICATORS...It's a great moment to assess whether any Bitcoin cycle top indicators are nearing extreme levels. Let's begin with the Pi Cycle indicator, which is currently looking quite robust.

The CryptoSniper's Bitcoin prediction --- $140kIf we can envision a Inverse Head and shoulders forming.
With a horizontal neckline coming in at around $47.5-48k
It gives us a LOG projection north of $140k
Draw it out yourself and see :)
A linear target would be much more subdued and give us a $80k target
And trap people below that magical figure for close to a decade , if u tack on a bear market that would follow.
That could really hurt #Bitcoin's traction in gaining new buyers going forward (especially on the retail level)
But lets's be optimistic and aim high
but recognise the value of having BOTH targets in mind.
@TheCryptoSniper Thank you for your ongoing education and dedication to your craft.

BTC POST HALVING History doesn't repeat itself, but it often rhymes...
We're now in the post-halving part of the Bullrun, and we can look back into Bitcoins history to help predict what might happen next.
Typically A bull cycle lasts 1065 days from the low to the high with the halving event in the middle. If we use that same timeframe and apply it to this Bullrun we can expect the peak for BTC to come in early October of 2025.
Now we know that once BTC has had it's top, altcoins regain some of the market dominance in an "Alt season" which is often a manic period of profits from BTC being poured into increasingly risky projects until the whole thing comes crumbling down, which then leads too...
The bear market which historically lasts for a full year from top to bottom. The bear market comes when most people least expect it as they are so used to price going up, complacency and greed can cost you all of the gains made in the last 3+ years. It's also important to note that BTC routinely goes through 25-30% corrections on the way up, and this is where many fall down. Knowing the difference between a correction and a top is the difference between making it and roundtripping everything. Have an exit strategy, take profit at key areas, don't let greed win.
The Fibonacci levels can be very useful when a project goes into price discovery as well as big even levels, your 100, 150, 200's etc. When Fib levels line up with these big evens you can expect resistance and therefor look to protect your capital.
Bitcoin is very close to a breakout from the '21 ATH level, we've been above SWB:69K before but swing failed to hit $56K, I am still a little worried about the GETTEX:52K +VE Orderblock as shown in green, it would make sense to revisit that area at some point however it does depend on this current SWB:69K S/R level.
