The growth vs value ratios are making higher lowsAt the above pane is the SP:SPX making new lows; I really thoght that the low was already made.
Then in red in Small Cap Growth vs Small Cap Value (IWO/IWN), in green is the S&P Growth vs S&P Value (SPYG/SPYV) and in yellow is the Consumer Discretionary vs Consumer Staples (XLY/XLP).
There are a lot more but these are the most common ratios to evaluate what kind of stocks are leading. And if you want a bull market, then growth should lead right?
Well, we are seeing the first steps to it. Look how all peaked before the S&P 500 and now are making higher lows. But remeber, first steps.
Look for stocks that are making 6mo highs and 12mo highs. These should be the ones to lead the next cycle.
NYSE:DV , NASDAQ:DGII & NASDAQ:AEHR are in the top of my watchlist.
What are yours?
52weekhighs

ACTION CONSTRUCTION EQUIPMENT LTD ACTION CONSTRUCTION EQUIPMENT LTD GOOD FOR SWING
Daily chart time frame breakout
volume is high
BUY 301.90
sp 267
1st target 333
2nd target 365
⚠️ Important: Always maintain your Risk & Reward Ratio.
✅Like and follow to never miss a new idea!✅
Disclaimer: I am not SEBI Registered Advisor. My posts are purely for training and educational purposes.

KSB NSE BULLISHVIEW ABOVE 1500 CMP 1545KSB NSE is bullish if 1500 holds. Near LIFETIME High. Fresh Breakout. Positive Trend.
Disclaimer: Educational Purpose Only. Not Buy Sell Reco. Not Sebi Registered.

JKS - Renewable Energy. Ascending triangle setupSigns of accumulation on the right side of this ascending triangle formation
JKS holding up nicely since March 2022 while the general market is going down
Outperforming the SPY, Sector and Industry
You don't need to know what's going to happen next to make money ~Mark Douglas
Anything can happen ~Mark Douglas

VIVO - Biotech setup making new 52wk highsSetup was nice. I missed the entry, no FOMO. Must now patiently wait for price to tighten up. There will always be a next train.
Risk: 90 bps
You don't need to know what's going to happen next to make money ~Mark Douglas
Anything can happen ~Mark Douglas
VLong

SHALIMAR PAINTS NSE BullishView above 150. CMP 158.5SHALIMAR PAINTS NSE is Bullish if 150 holds. Near 52 weeks High. Fresh Breakout. Positive Trend.
Disclaimer: Educational Purpose only. Not Buy/Sell Reco. Sebi unregistered.

ORIENT BELL NSE Bullishview above 660 CMP 677ORIENT BELL NSE is Bullish if 660 holds. Near LifeTime High. Fresh Breakout. Positive Trend.
Disclaimer: Educational Purpose only. Not Buy/Sell Reco. Sebi unregistered.

SDBL Som Dist & Bew Ltd NSE Bullishview above 73 CMP 74.85SDBL Som Dist & Bew Ltd NSE is bullish if 73 holds. New 52-Week High. Fresh Breakout. Positive Trend.
Disclaimer: Educational Purpose only. Not Buy/Sell Reco. Sebi Unregistered.

PHOENIX MILLS NSE BULLISHVIEW BOVE 1200 CMP 1218PHOENIX MILLS PHOENIXLTD NSE is bullish if 1200 holds. New Lifetime High. Fresh Breakout. Positive trend.
Disclaimer: Educational purpose only. Not Buy/Sell Reco. Not Sebi Registered.

VADILAL INDUSTRIES NSE BULLISH VIEW ABOVE 2100 CMP 2153VADILAL INDUSTRIES VADILALIND NSE is bullish if 2100 holds. new Lifetime High. Fresh Breakout. Positive Trend.
Disclaimer: Educational purpose only. Not Buy/Sell Reco. Not Sebi Registered.

DENORA NSE BULLISH VIEW ABOVE 837 cmp 845Debora NSE is bullish if 837 holds. New lifetime High. Fresh Breakout. Positive Trend.
Disclaimer: Educational purpose only. Not Buy/Sell Reco. Not SEBI registered.

PETRONM Breakout 52WEEK HIGHPETRONM breakout daily Resistance 7.320 with marubozu green candle and gap up.
Possible to continue on bullish run
PETRONM also breakout weekly and monthly resistance.
next resistance 7.620
chart looks in uptrend channel
18% retracement on daily chart before bullish run.
last candle close 52w high.

ZIM intraday swing playToday's trading idea is focusing on NYSE:ZIM
The stock is gapping up to $77 (pre-market) after Better than expected EPS .
The stock broke an all-time high of $75 that now became a support level .
The idea is to go long at the open when it will try to test the support level and fail.


Will Gold continue its bull Run? Since Jun'21 gold was trading in a range. The range was broken on 14th February, retested on 15th and toda it's trading above previous 52 week high. This may be an opportunity for buyers of gold (mcx) and goldbees (nse). What do you think?

RTX - Raytheon TechnologiesRecent breakout, pulling back in an orderly fashion to the 20-day line, exhibiting relative strength to the market indexes as they continue to falter.
Look for a bounce off of the 20-day line that clears Tuesday's (2/22/2022) high with a stop loss just under Tuesday's low.

CTVA - Corteva, Inc.Stock recently broke out of a ~10 month base and is forming a very tight VCP / high handle.
The stock continues to make new relative strength highs, giving very little back while the indexes struggle, showing its superior strength relative to the overall market.
Look for a breakout over the February 9 closing print of $51.54 with a stop just below the low of the VCP.

PITTIENG NSE BULLISHVIEW ABOVE 215PITTIENG NSE is bullish if 215 holds. New Lifetime High. Fresh Breakout.
*** Educational purpose only.
NSE:PITTIENG

NIITLTD NSE BULLISHVIEW ABOVE 387NIITLTD NSE is bullish if 387 holds. Near Lifetime high. Positive trend. Fresh Breakout on Monthly Chart.
**** Educational purpose only.
NSE:NIITLTD

ONWARDTEC NSE BULLISHVIEW ABOVE 282ONWARDTEC NSE is bullish if 282 holds. New Multiyear High. Fresh Breakout.
*** Educational purpose only.
NSE:ONWARDTEC

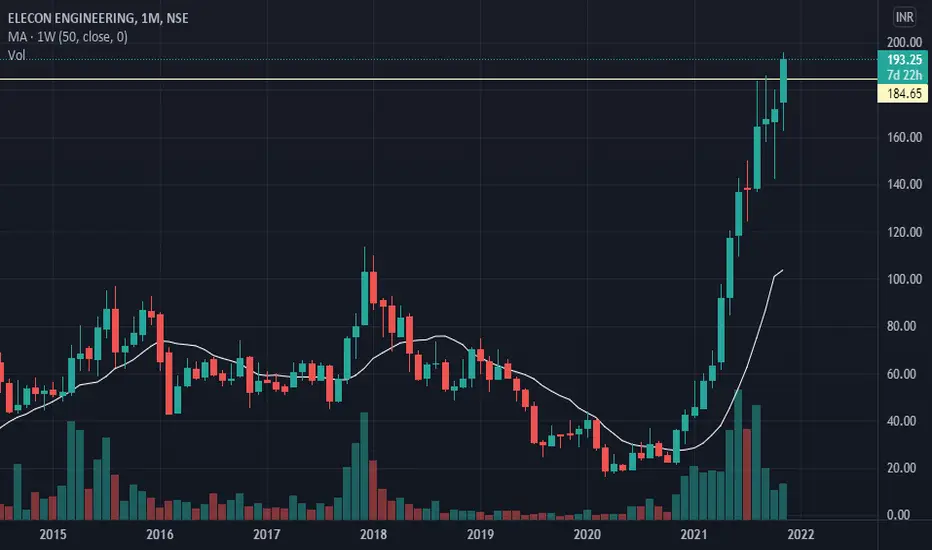
ELECON NSE Elecon Engineering Bussishview above 184ELECON NSE Elecon Engineering is bullish if 184 holds. New 52Week High. Fresh Breakout. New MultiYear High. Bullish Trend.
**** Educational purpose only.
NSE:ELECON
DHUNINV NSE BULLISHVIEW ABOVE 700DHUNINV NSE is bullish if 700 holds. New Lifetime High. Fresh Breakout.
**** Educational purpose only.
NSE:DHUNINV

LTTS NSE BULLISHVIEW ABOVE 5500.LTTS NSE L&T Technology is bullish if 5500 holds. New Lifetime High. Fresh Breakout.
**** Educational purpose only.
NSE:LTTS
