CTVA,,, WatchingUptrend
Passing out of a price level has been important for me especially if the level is major one.
I will get this position if it confirmed above this level properly by setting a SL about 53 and targeting around previous high.
Next report date
—
Report period
—
EPS estimate
—
Revenue estimate
—
0.79USD
735.00 MUSD
17.23 BUSD
695.96 M
About Corteva, Inc.
Sector
CEO
Charles V. Magro
Headquarters
Indianapolis
Website
Employees (FY)
22.5 K
Founded
1802
FIGI
BBG00BN969C1
Corteva, Inc. engages in the provision of seed and crop protection solutions, which engages in the agriculture industry and food supply. It operates through the Seed and Crop Protection segments. The Seed segment involves the development and supply of advanced germplasm and traits that produce yield for farms. The Crop Protection segment includes the global agricultural input industry with products for weeds, insects, other pests, and diseases protection, through nitrogen management and seed-applied technologies. The company was founded in 1802 and is headquartered in Indianapolis, IN.

Top stock picks for the next years No 9 Corteva Inc.I am publishing a series of the best stocks with the highest growth rates that I expect over the next few years. Today with the Corteva share with a target price of 91$

CORTEVA Stock Chart Fibonacci Analysis 121923 Trading Idea
1) Find a FIBO slingshot
2) Check FIBO 61.80% level
3) Entry Point > 45/61.80%
Chart time frame : C
A) 15 min(1W-3M)
B) 1 hr(3M-6M)
C) 4 hr(6M-1year)
D) 1 day(1-3years)
Stock progress : A
A) Keep rising over 61.80% resistance
B) 61.80% resistance
C) Hit the bottom
D) Hit the top
S

Something differentAgriculture commodities are coming back up pushing this stock up as well. I opened a small position today but I think is going to pull back so I'll add then. Looks like a bearish channel but also like a bull flag, either way it bounced off the bottom very hard and I think it will eventually break ou

$CTVA with a Bullish outlook following its earnings #Stocks The PEAD projected a bullish outlook for $CTVA after a Negative under reaction following its earnings release placing the stock in drift D.

$CTVA with a Bullish outlook following its earnings #Stocks The PEAD projected a Bullish outlook for $CTVA after a Negative over reaction following its earnings release placing the stock in drift C.

CTVA bull flaggingCTVA had a nice uptrend recently but has had a healthy pull back to the 78.6 fib, which it has held and now looks like it's flagging. In this choppy market, it's holding up well

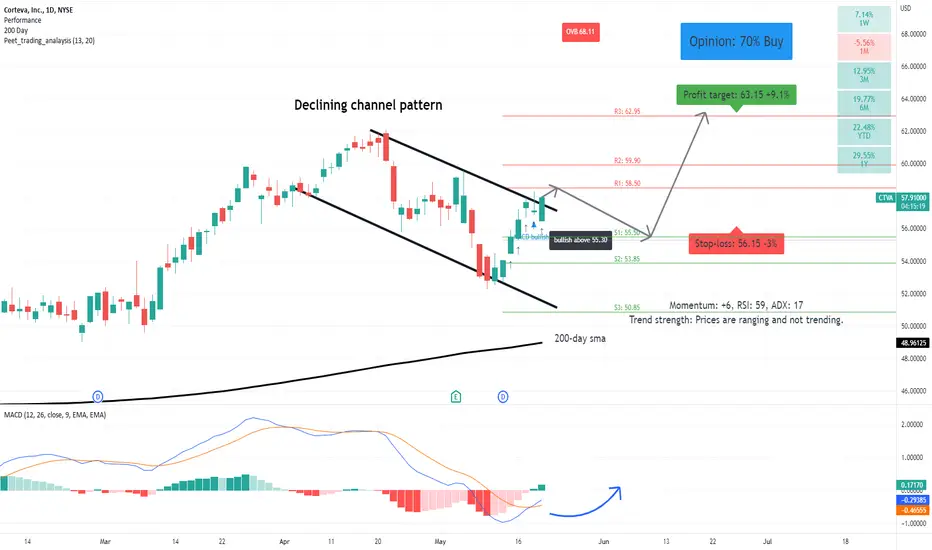
CTVA: bullish confluence breakStarting to break out of the declining channel pattern.
A price action above 55.30 supports a bullish trend direction.
Remains above its 200-day simple moving average.
Upside price momentum supports the bullish trend direction.
RSI leaves enough room for further upside price potential.
MACD crossove

CTVA New All Time HighsCTVA gapped up yesterday and made a New All Time Highs
Breakout Confirmed
Missed last earning by 5%
But overall earnings are fine
Volume is trading slightly above 50DMA
Pays out dividends

See all ideas
An aggregate view of professional's ratings.
Trade directly on the supercharts through our supported, fully-verified and user-reviewed brokers.


Frequently Asked Questions
The current price of CTVA is 55.39 USD — it has increased by 0.20% in the past 24 hours. Watch Corteva, Inc. stock price performance more closely on the chart.
Depending on the exchange, the stock ticker may vary. For instance, on NYSE exchange Corteva, Inc. stocks are traded under the ticker CTVA.
CTVA stock has risen by 0.20% compared to the previous week, the month change is a 4.69% rise, over the last year Corteva, Inc. has showed a 0.95% decrease.
We've gathered analysts' opinions on Corteva, Inc. future price: according to them, CTVA price has a max estimate of 69.00 USD and a min estimate of 56.00 USD. Watch CTVA chart and read a more detailed Corteva, Inc. stock forecast: see what analysts think of Corteva, Inc. and suggest that you do with its stocks.
CTVA reached its all-time high on Nov 2, 2022 with the price of 68.43 USD, and its all-time low was 20.38 USD and was reached on Mar 18, 2020. View more price dynamics on CTVA chart.
See other stocks reaching their highest and lowest prices.
See other stocks reaching their highest and lowest prices.
CTVA stock is 1.56% volatile and has beta coefficient of 0.49. Track Corteva, Inc. stock price on the chart and check out the list of the most volatile stocks — is Corteva, Inc. there?
Today Corteva, Inc. has the market capitalization of 38.53 B, it has decreased by 2.07% over the last week.
Yes, you can track Corteva, Inc. financials in yearly and quarterly reports right on TradingView.
Corteva, Inc. is going to release the next earnings report on Jul 31, 2024. Keep track of upcoming events with our Earnings Calendar.
CTVA earnings for the last quarter are 0.89 USD per share, whereas the estimation was 0.82 USD resulting in a 8.15% surprise. The estimated earnings for the next quarter are 1.72 USD per share. See more details about Corteva, Inc. earnings.
Corteva, Inc. revenue for the last quarter amounts to 4.49 B USD, despite the estimated figure of 4.65 B USD. In the next quarter, revenue is expected to reach 6.15 B USD.
CTVA net income for the last quarter is 419.00 M USD, while the quarter before that showed −253.00 M USD of net income which accounts for 265.61% change. Track more Corteva, Inc. financial stats to get the full picture.
Yes, CTVA dividends are paid quarterly. The last dividend per share was 0.16 USD. As of today, Dividend Yield (TTM)% is 1.16%. Tracking Corteva, Inc. dividends might help you take more informed decisions.
Corteva, Inc. dividend yield was 1.29% in 2023, and payout ratio reached 60.05%. The year before the numbers were 0.99% and 36.63% correspondingly. See high-dividend stocks and find more opportunities for your portfolio.
As of Jul 27, 2024, the company has 22.50 K employees. See our rating of the largest employees — is Corteva, Inc. on this list?
EBITDA measures a company's operating performance, its growth signifies an improvement in the efficiency of a company. Corteva, Inc. EBITDA is 3.23 B USD, and current EBITDA margin is 19.34%. See more stats in Corteva, Inc. financial statements.
Like other stocks, CTVA shares are traded on stock exchanges, e.g. Nasdaq, Nyse, Euronext, and the easiest way to buy them is through an online stock broker. To do this, you need to open an account and follow a broker's procedures, then start trading. You can trade Corteva, Inc. stock right from TradingView charts — choose your broker and connect to your account.
Investing in stocks requires a comprehensive research: you should carefully study all the available data, e.g. company's financials, related news, and its technical analysis. So Corteva, Inc. technincal analysis shows the strong buy rating today, and its 1 week rating is buy. Since market conditions are prone to changes, it's worth looking a bit further into the future — according to the 1 month rating Corteva, Inc. stock shows the buy signal. See more of Corteva, Inc. technicals for a more comprehensive analysis.
If you're still not sure, try looking for inspiration in our curated watchlists.
If you're still not sure, try looking for inspiration in our curated watchlists.