Gold Rises Not Due to Fed, But Capital Fleeing StocksThe global financial market is not just numbers, charts, or economic news; it is a living organism where large capital flows continuously, always seeking lower risk and optimal returns . Gold, equities, bonds, oil, and the USD never operate in isolation. Every movement is the result of strategic, invisible decisions —sometimes beyond what ordinary charts can explain.
Instability arises—stocks wobble, economic data worries investors, or political events spook the market—and smart money withdraws from risky assets . Gold and bonds become safe havens , preserving value. Falling bond yields lower the opportunity cost of holding gold , gradually shifting capital toward the precious metal. A strong USD both pressures equities and reinforces safe-haven positions, allowing smart money to exploit collective fear.
During periods of relative calm, the market enters a “breathing phase” . Capital does not rush into a single asset but spreads across USD, commodities, and low-volatility instruments. Gold and bonds pause, equities do not break out, yet behind the scenes, major players measure risk, evaluate liquidity, and prepare for the next wave . This is accumulation , where large capital controls the market’s rhythm.
Once risk is under control, capital returns to stocks, crypto, or energy commodities , igniting upward trends. Yet, even a minor warning can trigger a withdrawal from risky assets into gold or cash , creating sudden reversals. Smart money leverages these moments to trigger stop-losses, execute limit orders, and maximize profits . Most importantly, a single strategic capital move can ripple across global markets , demonstrating the true power of liquidity flows .
Gold does not rise because of the Fed; it rises because smart money seeks safe shelter . Understanding the market is not merely reading charts—it’s understanding global capital flows . Recognizing the rhythms of Risk-Off, neutral, and Risk-On phases reveals why gold, USD, or equities move in ways that conventional charts cannot explain.
"Those who understand the market read charts. Those who understand money flows read the global operating mechanism."
Community ideas

RISK MANAGEMENT – How Pros Stay AliveIf you’ve traded long enough, you’ll realize this:
Nobody blows up their account because of a bad prediction — they blow it up because they don’t know when to stop.
1. The First Survival Rule: Set a FIXED RISK Per Trade
Choose a fixed risk percentage that you’re comfortable with — 1%, 2%, or a maximum of 3% per trade.
That means:
If you have a $1,000 account and risk 2%, you can only lose $20 per trade .
Even if you lose 5 trades in a row, you still have 90% of your account to keep fighting.
Never increase your lot size because of a “gut feeling.”
Traders don’t lose because they analyze wrong — they lose because they increase risk when they feel too confident.
2. Set STOP LOSS with Logic, Not Emotion
Don’t place your stop loss “just to have one.”
Your stop loss should be at the point where, if price hits it, your idea is truly invalidated — not because you’re afraid of getting stopped out early.
Example:
If you’re buying in an uptrend, your SL should be below the last higher low , not just below the last red candle.
If your SL is 30 pips and you want to risk 2%, then your position size = 2% of your account ÷ 30 pips.
This formula keeps your trades balanced and prevents those small, annoying blow-ups.
If you don’t know exactly how much you’re risking per trade — you’re not really trading. You’re gambling.
3. No Overloading, No Revenge Trading
One of the fastest ways to blow up an account is adding more trades while losing .
The market doesn’t care how much you’re down — it only cares how much you still have left to lose.
Pro traders do the opposite:
When the trade moves in their favor → they trail the stop and lock profits.
When the trade goes wrong → they cut it quickly, no questions asked.
That’s why they last longer — they trade small when uncertain and go big only when the odds are clearly on their side.
4. Emotional Control = The Extension of Risk Management
Risk management isn’t just about numbers — it’s about discipline.
If you just took a loss and still want to “jump back in to make it back” — stop immediately.
No analysis, no revenge trade.
Just close the chart, grab a drink, take a walk, or hit the gym.
Because once emotions take over, no system in the world can save you .
5. Turn Risk Management into a Strategic Weapon
When you have your risk under control, you trade with a cold mind.
That’s when you can actually take advantage of big opportunities .
Example:
You risk 2% per trade and find a setup with R:R = 1:4.
If it wins, you make +8%. If it loses, you only lose -2%.
Even if you’re right just 3 out of 10 times — you’re still profitable.
That’s how pro traders make a living.
They don’t need an 80% win rate — they just need consistency and control.
💬 A Simple Drill for You:
For every trade, write this down:
“How much % am I willing to lose if I’m wrong?”
If you can’t answer within 5 seconds → don’t take that trade.
If you’re still losing because of discipline issues → restart by focusing only on limiting risk before thinking about profit.

The Formula to Make $10000 Daily👋 Hello traders!
If you’re looking for a real way to make $10000 every day from the markets, forget about the so-called magic strategies or secret expert tricks.
The truth is simple: there’s no overnight success formula. But there is a realistic path built on probability, discipline, and time — and that’s what I call The Formula to Make $10000 Daily .
⚙️ Step 1: Build a High-Probability Trading System
📊 This is your foundation.
A good trading system doesn’t have to be complex, but it must have clear rules and consistent logic .
You should always know:
✅ When to enter a trade
✅ When to stay out
✅ And most importantly — why you’re entering
Choose a strategy you can truly master and apply consistently — such as Break & Retest , Supply & Demand , or Market Structure Shift .
Every trade should have a Risk-to-Reward ratio (R:R) of at least 1:2 or higher.
💡 Example:
If you risk $2000 per trade and win just two out of three trades daily, you’ll make $4000.
Increase your lot size gradually and stay consistent — $10000 a day becomes a realistic outcome.
💼 Step 2: Capital Management – The Key to Survival
🧠 You can’t make $10000 daily if you lose $10000 in one bad trade.
Capital management isn’t just about protecting your balance — it’s about protecting your mindset and system.
Follow these golden rules:
💰 Risk only 1–2% per trade
🛑 Always use a stop loss
🎯 Set a clear take-profit target
With a $50,000 account, risking 1% equals $5000.
If your R:R ratio is 1:3, one winning trade a day earns $15000.
That’s not luck — that’s mathematics working in your favor .
🧘♂️ Step 3: Master the Trader’s Mindset
Once you have a solid system and money management plan, the final piece — and the most important — is your psychology .
Most traders don’t fail because their system is bad. They fail because they can’t control themselves .
Keep these principles close:
🚫 Don’t trade when emotions take control
🚫 Don’t revenge trade after losses
🚫 Don’t increase lot size out of greed
🚫 Don’t force yourself to take trades every day
A professional trader doesn’t aim to win every trade — they aim to lose less and lose smart .
🧩 The Real Formula
💎 (High-Probability System + Strict Risk Management + Strong Psychology) × Time = Sustainable Profit
There are no shortcuts.
No magic indicators.
Only you and your discipline .
📖 Real Story
One of my students, Ken, started with a $10,000 account.
He didn’t try to go big — instead, he aimed to earn 1% a day , or $1000.
After six months, by slowly increasing his trade size and staying disciplined, his average daily profit reached $10000 .
He told me:
“I didn’t need to change my system. I just needed to change myself.”
🎯 Final Thoughts
The formula to make $10000 daily doesn’t come from any special indicator, signal, or secret course.
It comes from understanding your system deeply, managing your capital wisely, and staying disciplined every single day .
💬 The market doesn’t reward the fastest traders. It rewards the most patient, consistent, and focused ones.
If you’re on your journey to becoming a professional trader, start today.
🔥 Build your own formula — and practice it every single day until it becomes second nature.

Macroeconomics and Investor Psychology Driving Gold PricesFirstly, macroeconomic policies , particularly monetary policy moves by the U.S ., will continue to have a significant impact on gold prices. Specifically, the upcoming decisions by the Federal Reserve (Fed) regarding interest rate cuts are expected to create positive momentum for gold, as investors turn to gold as a safe-haven asset in a low-interest-rate environment.
Secondly, the independence of the Fed is a key factor, not only directly influencing confidence in the USD but also strongly affecting trust in U.S. institutions. The stability and transparency of the Fed's policy decisions will continue to create significant market volatility, directly impacting gold prices.
In addition, gold is becoming increasingly attractive to investors due to the combination of two key factors. First, the increasing national debt in many countries is becoming a major risk, as global fiscal sustainability is in question, making gold a more reliable safe-haven asset. Second, the erosion and weakening of international systems and standards have led to diminishing confidence in financial systems and international approaches. This has further strengthened gold's position as a safe asset in the eyes of investors.
Another important factor influencing gold prices is the psychology of seeking global risk hedging . In the context of concerns about "bubbles" in the AI technology sector , if AI technology proves to be a bubble and bursts, gold and other assets will become even more attractive as strategic safe-haven assets.
With all these factors in play, gold is not only an attractive investment choice but also a strategic asset during times of financial and global economic instability.

Market analysis using bitcoin dominance & usdt dominance chartsWe aim to conduct an in-depth analysis of the correlations among four key indicators used to interpret the complex dynamics and investor sentiment in the cryptocurrency market — Bitcoin Dominance, USDT Dominance, TOTAL3, and the Coinbase Premium — and to share insights on how these can be effectively utilized in real trading strategies.
By analyzing these four indicators together, traders can identify the overall market trend, gauge the vitality of the altcoin market, and assess institutional participation, which provides a foundation for developing mid- to long-term trading strategies.
First, please click Boost (🚀) so that more people can see this post.
💡Understanding the Key Indicators
Bitcoin Dominance: CRYPTOCAP:BTC.D
The ratio of Bitcoin’s market capitalization to the total cryptocurrency market capitalization.
It represents Bitcoin’s market strength relative to altcoins.
USDT Dominance: CRYPTOCAP:USDT.D
The ratio of Tether (USDT) market capitalization to the total cryptocurrency market capitalization.
It helps identify risk-on/risk-off sentiment among investors and assess the level of market liquidity.
TOTAL3: CRYPTOCAP:TOTAL3
The total market capitalization of all altcoins excluding Bitcoin (BTC) and Ethereum (ETH).
It directly reflects the overall momentum of the altcoin market.
Coinbase Premium Index: TradingView Indicator
An indicator showing the price difference of BTC between Coinbase and other major exchanges (e.g., Binance).
It is used to indirectly gauge institutional buying pressure (positive premium) or selling pressure (negative premium) in the U.S. market.
⚙️Interaction of Indicators and Trading Strategies
These four indicators exhibit specific patterns under different market conditions.
By analyzing them comprehensively, traders can identify medium- and long-term trading opportunities.
Correlation between BTC price and indicators:
BTC price vs BTC.D: Complex correlation.
BTC price vs USDT.D: Mostly inverse correlation (USDT.D rising = market uncertainty and BTC decline)
BTC price vs TOTAL3: Mostly Positive correlation (BTC rise = TOTAL3 rise)
BTC price vs Coinbase Premium: Mostly Positive correlation (sustained positive premium = continued BTC uptrend)
✔️Scenario 1: Bullish Phase📈 (Bitcoin-led Rally)
BTC.D rises: Capital concentrates into Bitcoin
USDT.D falls: Increased risk appetite, cash inflows grow
TOTAL3 moves sideways or slightly upward: Altcoins remain weak or unresponsive
Coinbase Premium rises and stays positive: Institutional buying inflow
Interpretation:
Strong institutional buying of Bitcoin drives the market, with capital shifting from stablecoins into BTC.
Altcoins may lag behind this movement initially.
Strategy:
If the Coinbase Premium remains positive even during minor BTC corrections, it favors building long BTC positions.
When the positive premium persists and BTC breaks key resistance levels, it can be interpreted as a strong buy signal.
During early stages, focus primarily on Bitcoin rather than altcoins.
✔️Scenario 2: Strong Bull Market📈 (Altcoins Join the Rally)
BTC.D declines: Capital rotates from Bitcoin to altcoins
USDT.D declines: Ongoing risk appetite and continuous inflows
TOTAL3 rises: Peak momentum in the altcoin market
Coinbase Premium remains positive: Continuous liquidity inflow
Interpretation:
As Bitcoin stabilizes or trends upward, capital starts flowing aggressively into altcoins.
The rise in TOTAL3 reflects broad-based strength across the altcoin market.
Strategy:
Select fundamentally strong altcoins and build positions gradually.
During this phase, large-cap and small-cap thematic groups may experience rotational pumps — monitoring related narratives is crucial.
✔️Scenario 3: Bearish Market📉
BTC.D rises: Altcoins fall more sharply as BTC declines
USDT.D rises: Strengthened risk aversion and increased cash positions
TOTAL3 declines: Deepening weakness in the altcoin market
Coinbase Premium drops and stays negative: Institutional selling or halted buying
Interpretation:
Heightened market anxiety leads investors to liquidate risk assets and move into stable holdings such as USDT.
Institutional selling pressure pushes the Coinbase Premium negative or maintains it in a downward trend.
Altcoins are likely to experience the greatest losses in this phase.
Strategy:
Reduce crypto exposure or convert positions to stable assets (USDT) for risk management.
During technical rebounds, consider trimming positions or cautiously taking short opportunities (with higher risk).
✔️Scenario 4: Sideways or Correction Phase
BTC.D moves sideways: Range-bound consolidation
USDT.D moves sideways: Persistent risk aversion and lower market volume
TOTAL3 moves sideways: Altcoin market remains flat or slightly weak
Coinbase Premium stable: Fluctuates between positive and negative values
Interpretation:
The market enters a wait-and-see phase with sideways movement or mild correction.
The Coinbase Premium’s neutrality reflects uncertainty in institutional capital flows.
Strategy:
Monitor BTC and TOTAL3 reactions at major support levels before re-entering positions.
It may be prudent to stay on the sidelines until clear institutional accumulation or positive catalysts emerge to restore sentiment.
🎯TradingView Chart Setup and Usage Tips
Multi-Chart Layout: Use TradingView’s multi-chart feature to display BTCUSDT, BTC.D, USDT.D, and TOTAL3 simultaneously for comparative analysis. (Apply Coinbase Premium as an additional indicator.)
Timeframes: For short-term analysis, use 1H, 4H, or 1D; for medium- to long-term, use 1W or 1M charts. Confidence increases when multiple indicators align across the same timeframe.
Trendlines and Support/Resistance: Draw trendlines, support, and resistance on each indicator chart to identify key inflection points. Breakouts on USDT.D or BTC.D often signal major market shifts.
Supplementary Indicators: Combine RSI, MACD, or other technical indicators to detect divergences or overbought/oversold zones for added precision.
⚡Analytical Value and Considerations
Comprehensive Market Insight: Analyzing all four indicators together enhances overall market understanding.
Leading vs Lagging Indicators: Coinbase Premium can serve as a leading signal, while dominance and market cap metrics act as coincident indicators reflecting current conditions.
Probabilistic Nature: These indicators are not predictive tools but should be interpreted within a broader context of market variables.
Risk Management: Always apply stop-loss measures and manage exposure carefully. Be prepared for deviations from expected market behavior.
🌍Conclusion
Bitcoin Dominance, USDT Dominance, TOTAL3, and the Coinbase Premium Index are fundamental components in decoding the complex structure of the cryptocurrency market.
Analyzing them in conjunction enables a deeper understanding of market sentiment, anticipation of upcoming opportunities and risks, and the development of a more intelligent and stable trading strategy.
💬 If you found this analysis insightful, share your thoughts in the comments!
🚀 Don’t forget to hit Boost to support the post!
🔔 Follow to make sure you don’t miss the next market insight!
how to Stop Your Money Losing Value??Have you ever felt that despite your hard work, your purchasing power is fading? This is an invisible war, a war where your cash is on the losing side. But there are practical ways to protect your assets and even grow them in the long term.
Hello✌️
Spend 3 minutes ⏰ reading this educational material.
🎯 Analytical Insight on Ripple:
XRP is testing a strong support while moving on the descending channel. A confirmed breakout with solid volume could drive a 20% rally, targeting 2.80$. 📊🚀
Now , let's dive into the educationa l section,
🛡️ Understanding the Invisible Enemy
Inflation is the primary enemy of your capital. This phenomenon slowly but surely erodes the value of your money. When the bank interest rate is lower than the inflation rate, you are effectively losing your wealth. The main goal is to find a way to achieve returns higher than the inflation rate.
🌍 The Mindset of a Preserver
The first step is to shift your mindset from a "saver" to an "investor". Your money should work for you, not the other way around. This mindset forces you to always look for opportunities that not only preserve but also increase the value of your assets.
📈 Smart Diversification
Never concentrate all your assets in one investment class. A mix of different assets such as stocks, commodities, and digital assets can form a strong shield against market fluctuations. The principle of diversification significantly reduces the risk of losing your entire capital.
⚙️ The Art of Risk Management
Preserving capital takes priority over making profits. Only enter trades with capital whose loss would not affect your current lifestyle. Setting a stop-loss for every investment position is a necessity, not an option. This protects you from negative market surprises.
🧠 Mastering Psychology
Fear and greed are two powerful and destructive emotions in the market. The fear of missing out causes you to lose golden opportunities, and greed pushes you to hold investments at price peaks. To succeed, you must overcome these emotions and stick to your strategy.
🔍 Identifying Opportunities with Trading views Tools
This section focuses on the practical search for assets with potential. Analytical tools can provide you with a better perspective for this task.
Market Scanner: Use this tool to screen thousands of assets based on specific technical criteria. You can find assets that have crossed an important moving average or are consolidating within a specific range.
Creating Charts: Create different charts for one asset and use indicators in combination. Comparing an asset's performance against others can reveal its strengths and weaknesses.
Sharing Feature: Share your ideas and analyses with the large community of users and benefit from their feedback. This helps you see hidden aspects of a situation.
🎯Top Recommendations for Action
First, have a written trading plan for yourself and do not take any action without it. Second, always withdraw a portion of your profits from the market and convert them into lower-risk assets. Third, never stop learning; markets are dynamic, and yesterday's strategies may not work tomorrow.
🚀 Final Word
Preserving the value of money is not an event; it is a continuous process. This path is paved with education, consistent analysis, and emotional control. By using the right tools and adhering to principles, you can protect your assets against inflation.
✨ Need a little love!
We pour love into every post your support keeps us inspired! 💛 Don’t be shy, we’d love to hear from you on comments. Big thanks , Mad Whale 🐋
📜Please make sure to do your own research before investing, and review the disclaimer provided at the end of each post

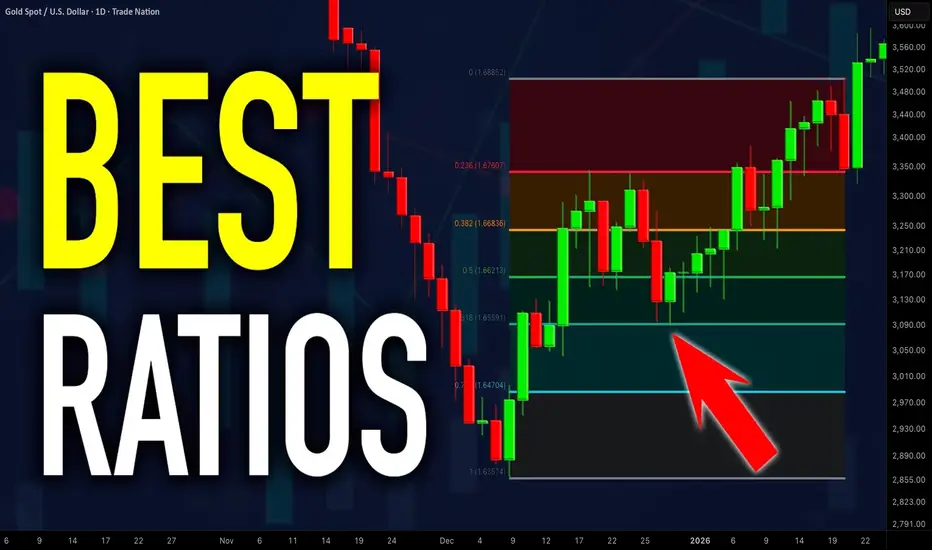
Powerful Fibonacci Trading Strategy For Beginners (GOLD FOREX)
I am going to reveal a powerful fibonacci trading strategy that I learned many years ago. It combines structure analysis, fibonacci retracement and extension levels and candlestick analysis, and it is suitable for beginners.
Step 1
Find a trending market - the market that is trading in a bullish or in a bearish trend on a daily time frame.
AUDUSD is trading in a bullish trend on a daily.
Step 2
Execute structure analysis - identify key horizontal and vertical structures on a daily time frame.
Have a look at key structures that I spotted on AUDUSD.
Step 3
Draw fibonacci retracement levels.
Here are the important ratios you should look for: 382, 50, 618, 786.
In a bearish trend,
draw fibonacci retracement levels from the high of the trend to current low based on wicks.
In a bullish trend,
You should apply fibonacci retracement from the low of the trend to a current high based on wicks.
Take a look how I draw the retracement levels,
I took the low of the trend and the high of the trend.
Step 4
Find confluence .
Look for fibonacci numbers that match - lie within key structures that you identified.
Support 1 matches with 382 retracement.
Support 2 matches with 786 retracement.
Remove other ratios from the chart.
Step 5
Wait for a test of one of the fibonacci levels that match with key structure
The price perfectly tested 382 retracement level.
Step 6
Wait for a confirmation on a 4h time frame.
Our confirmation will be a formation of an engulfing candle - a strong candle that completely engulfs the entire range of a previous candle with its body.
In a bearish trend, we will look for a formation of a bearish engulfing candle. Bearish engulfing candle indicates a strong selling pressure and the strength of the sellers.
In a bullish trend, we will look for a bullish engulfing candle. It indicates a strong buying reaction and imbalance.
Have a look at a bullish engulfing candle that was formed on AUDUSD on a 4H time frame after a test of 382 retracement.
Step 7
Open a trading position, set stop loss and choose the target.
After you spotted an engulfing candle, open a trading position.
Open short after a formation of a bearish engulfing candle and open long after a formation of a bullish engulfing candle.
If you sell , your safest stop loss will be 1.272 extension of the last bullish impulse on a 4H.
If you buy , your stop loss will be 1.272 extension of the last bearish impulse on a 4H.
In our example, our stop loss will be 1.272 extension of a bearish impulse leg on a 4H time frame. The extension is based on high and low of the impulse.
If you short , your take profit will be the closest key structure support on a daily.
If you buy , your take profit will be the closest key structure resistanc e on a daily.
Being applied properly, the strategy should generate 60%+ winning rate.
Always remember to check your reward to risk ratio before you open the trade. It should be at least 1.1/1.
Also, before you place a trade, always make sure that you trade WITH the trend and take only trend-following trades.
The strategy works perfectly on Forex, Gold, Silver, Oil, Indexes.
Good luck in your trading.
❤️Please, support my work with like, thank you!❤️
I am part of Trade Nation's Influencer program and receive a monthly fee for using their TradingView charts in my analysis.
Smart Liquidity IndicatorSmart Liquidity 📊 Indicator Guide
## Introduction
The Smart Liquidity Indicator is an advanced technical analysis tool designed to provide accurate signals about market liquidity levels. This indicator aims to help traders make informed decisions based on liquidity analysis and supply and demand levels.
**Note**: This tool is designed to assist your strategy in making the right decisions.
## Key Features
- **Entry and Exit Signals**: Provides precise signals to determine the best times to enter and exit trades.
- **Integration with Volume Profile**: Integrates with the volume profile to offer a comprehensive view of market movement.
- **Customizable Settings**: Allows users to adjust the indicator settings to suit different trading strategies.
## Tools and Concepts in the Script
- **SuperTrend**:
- A trend analysis tool that helps identify the overall market direction.
- Used to determine entry and exit points based on trend changes.
- **Volume Profile**:
- Displays high and low liquidity levels on the chart.
- Helps identify supply and demand zones.
- **Supply and Demand Zones**:
- Highlights areas where price is likely to reverse.
- Used to determine entry and exit points.
- **Candle Signals**:
- Relies on analyzing candlestick patterns to provide additional signals.
- **Oscillators**:
- Used to identify overbought and oversold conditions.
- Helps avoid trades when the market reaches extreme conditions.
- **Trend Lines**:
- Shows primary and secondary market trends.
- Used to identify potential reversal points.
## Visual Representation
- **Interactive Design**:
- The dashboard is designed to be user-friendly and interactive.
- Displays data in an organized manner for easy reading.
- **Dynamic Colors**:
- Uses dynamic colors to represent different market conditions.
- For example, green indicates an uptrend, while red indicates a downtrend.
- **Clear Visual Indicators**:
- Includes visual indicators such as arrows and circles to highlight entry and exit signals.
- High and low liquidity levels are displayed using distinct horizontal lines.
- **Customizable Display**:
- Users can customize colors, text sizes, and line styles through the settings.
- Includes options to show or hide specific elements as needed.
- **Real-Time Updates**:
- Data displayed on the dashboard updates instantly with market changes.
- Ensures that the information is always accurate and up-to-date.
- **Ease of Navigation**:
- The dashboard is designed for easy navigation between different sections.
- Displays the most important data upfront for a seamless user experience.
## How to Use
1. **Add the Indicator to the Chart**:
- Open the TradingView platform.
- Go to the Indicators section.
- Search for "Smart Liquidity 📊" and add it to the chart.
2. **Customize the Settings**:
- Click on the settings icon next to the indicator name.
- Adjust the settings according to your needs.
3. **Spot Opportunities and Exit at the Right Time**:
- Monitor high liquidity levels to identify supply and demand zones.
- Use entry signals to determine the best times to enter trades.
- Rely on exit signals to minimize risks and exit at the right time.
- Analyze the overall market trend and ensure signals align with your strategy.
**Note**: It is recommended to use the indicator in stable markets and perform backtesting to ensure its accuracy and suitability for your trading approach.
## Practical Examples
### Example 1: Identifying High Liquidity Zones
- Enable the "🔥 Show Volume Profile" option in the settings.
- Monitor areas with high liquidity (High Volume Nodes).
- Use these areas as potential support or resistance levels.
### Example 2: Using SuperTrend to Confirm Trend
- Enable the "📈 Use Trend Filter" option.
- If the trend is upward (SuperTrend line is green), look for buying opportunities.
- If the trend is downward (SuperTrend line is red), look for selling opportunities.
### Example 3: Combining Supply and Demand Zones with Volume Profile
- Enable the "📦 Show Order Blocks" and "🔥 Show Volume Profile" options.
- Identify supply and demand zones that coincide with high liquidity levels.
- Use these zones as entry or exit points.
## Acknowledgment
We extend our heartfelt thanks to the TradingView team for their continuous efforts in developing the platform and providing advanced analytical tools to users. Your ongoing support and the addition of new features to Pine Script make it possible to deliver innovative tools that meet the needs of traders worldwide.
We would like to emphasize that the "Smart Liquidity Indicator" is available for free and can be used by everyone to enhance their trading strategies. We hope this tool contributes to improving user experience and achieving their goals in financial markets.
---
**Disclaimer**: This indicator is a technical analysis tool and does not guarantee profits. Trading involves risks and may lead to capital loss.

The Psychology Behind Winning Trades The Psychology Behind Winning Trades 🧠💹✨
Introduction – Hook:
📊 “Why do some traders consistently win 💰 while others struggle 💔?”
It’s rarely the strategy—it’s the mindset behind the trade! 🧠🌟
Your emotions, thoughts, and biases control your decisions, even with perfect technical skills. 🎯
1️⃣ What is Trading Psychology?
Trading psychology is the study of how emotions and mental habits affect trading decisions. 🌈🧘♂️
It’s about understanding:
How fear 😨, greed 😍, or impatience ⏳ impacts your trades
Why you sometimes ignore your rules 📝
How discipline 💪 can make the difference between profit 🏆 and loss 💸
💡 Tip: Even the best strategies fail if your mind isn’t in control. 🧠✨
2️⃣ Common Psychological Traps & How They Appear in Trades
Trap Emoji Effect Example in Trading
Fear 😨 Exiting too early Closing a winning trade because you’re scared of losing profits 💔
Greed 😍 Holding losing trades Waiting for a loss to “come back” and losing more money 💸
FOMO 🏃♂️💨 Jumping impulsively Entering trades last minute because everyone else is trading 🚀
Revenge Trading 😤🔥 Emotional loss-chasing Trying to recover losses by taking bigger, risky trades 💣
💡 Insight: Recognizing these emotions is the first step to controlling them. 🌟
3️⃣ How to Master Your Trading Mind
1️⃣ Pre-Trade Preparation 🧘♀️✅
Check your emotional state before trading 🕊️
Confirm your trade plan is clear 📋✨
2️⃣ During the Trade ✋🎯
Stick to your rules, don’t let emotions take over 💪🔥
Avoid impulsive exits or entries ⏱️❌
3️⃣ Post-Trade Reflection 📖🖊️
Keep a Trading Journal: note emotions, mistakes & wins ✨📓
Review trades to improve your mindset over time 📈🌟
4️⃣ Pro Tips for Winning Psychology
🔥 Mindset Checklist:
Am I trading calmly? 😌💭
Am I following my plan? 📋✅
Am I chasing losses or profits emotionally? ⚖️💡
💡 Daily Mindset Practice: Meditation 🧘♂️, journaling ✍️, or reviewing trades 📊 can help you stay disciplined under pressure 💎🌟
5️⃣ Why It Matters
Trading without psychology = strategy leaks money 💸💨
Emotional control = consistency, higher win rates, confidence 🏆💪
Professionals don’t just trade charts—they trade themselves 🧠✨
6️⃣ Engagement Section
👇 Question for your audience:
“What’s the biggest psychological trap YOU’ve faced in trading? Share your story below! 💬💭💖”

ABCD Pattern Part 1: Double BottomsWe find the root of technical analysis in the systematic study of repetitive patterns in the historical price record. In the previous article, I explored key aspects of this discipline, such as its history and the fundamentals of its creation. Today, I will focus on a specific pattern, which I like to call the ABCD pattern , and specifically show its logic and practical uses for detecting entries in double bottoms. If my contribution is well received, I will soon show other variants.
ABCD is a basic price action structure; what would be an impulse (AB), a retracement (BC), and the continuation of the impulse (CD).
Historical Background
Classic authors such as R.N. Elliott, Goichi Hosoda, and Alan Andrews dedicated decades to the study of impulsive and corrective waves in the markets. Specifically, the ABC pattern (composed of an impulsive segment and a corrective one) has been a pillar in these theories. For R.N. Elliott, Fibonacci ratios were essential to predict future fluctuations in his Elliott Wave Theory. Alan Andrews developed his own tool, known as the Andrews Pitchfork, and Hidenobu Sasaki contributed to the popularization of Goichi Hosoda's methods in the 1990s, showing how his mentor used measurements to project waves and corrections.
As a contemporary reference, we have Scott M. Carney, a pioneer in harmonic trading. His methodology, inspired by the ideas of Elliott, W.D. Gann, J.M. Hurst, and H.M. Gartley, seeks to predict probable reversal zones in price action through Fibonacci ratios. Carney popularized the AB=CD pattern as a four-point structure where the initial segment (AB) partially retraces (BC) and then completes with an equidistant movement (CD), allowing the identification of entry opportunities at market extremes. This pattern, along with its alternate variants, forms the basis of his approach in books like The Harmonic Trader, where he emphasizes the convergence of ratios to maximize trading precision.
Let’s Keep It Simple: Description and Psychology of the ABCD Pattern
It is extremely harmful to memorize tricks, formulas, and patterns while discarding understanding. Price charts are, above all, a psychological phenomenon. Forgetting this, at best, would be underestimating our greatest advantage as technical analysts.
After investors profit from an impulsive wave (AB), at some point many will take partial or full closes of their positions, triggering a correction (BC). Once the price resumes its impulse in the direction of the prevailing force (CD), the eyes of many participants will be on the next correction or inflection point (D).
There are many psychologically attractive zones for taking partial position closes, and a Fibonacci extension is a useful tool, but there are so many implications of each ratio that investors will often feel overwhelmed by so much information.
Practical Use in Double Bottoms
Figure 1.1
In Figure 1.1, I show what would be a bearish impulsive wave making a correction. The horizontal lines show the zones where the price can approximately change direction, forming a double bottom.
Instead of memorizing and aligning Fibonacci combinations, I recommend detecting ABCD patterns over the zone, which will increase the effectiveness of our market entries. As confirmation, we will wait for a high-volume entry and a candle pattern that shows strength (false low, bullish engulfing candle, bullish hammer with a large wick or shadow).
A false low occurs when the price falls below the price action and bounces upward with force, leaving a wick or shadow at the bottom of the candle and an elongated body at the top (preferably without a wick or shadow), indicating strong rejection by buyers.
Figure 1.2
In Figure 1.2, we can observe a real example of the ABCD pattern application in corrections. Our lower line of interest is the one that truly confirms a double bottom thanks to a notable volume entry and an engulfing candle pattern.
It is necessary to train our eyes to volatile scenarios, quite unlike those we would find in books.
Figure 1.3
Figure 1.3 shows the scenario of an ABCD pattern at our first line of interest. Generally, the first line of interest will be around the 0.786 Fibonacci retracement zone, while the second line of interest is a bit more imprecise, but volume will tend to provide solid confirmation of buying strength.
Figure 1.4
Figure 1.4 shows in more detail how, over the zone of our first line of interest, we find a notable increase in volume. In this case, our entry confirmation would come from a false low.
Why is the second line of interest more imprecise to calculate than the first line of interest, but one of my favorites?
When the price reacts strongly below what would be a support zone in a double bottom, we are generally facing a bear trap, a scenario of extreme volatility.
Many bears who entered expecting the continuation of the downtrend will be forced to capitulate in the presence of strong buyer entry. This, added to the capitulation or partial closes of sellers who had positions taken previously, generates a scenario of extreme bullish volatility. I especially like these formations because of the notable volume presence that precedes them and the bullish force unleashed afterward.
Trade Management and the Importance of Break-Even
A Stop Loss (SL) adjusted below the zone where a bullish candle shows us strength will be extremely necessary in this type of formation, but it will be equally useful to understand that we want to use the force in our favor in the safest way possible.
A scenario where we ensure we don’t lose a penny will be psychologically comfortable, so setting an SL at a break-even zone once the price moves in our favor will be an excellent decision, especially in bear trap scenarios, where volatility will generally be high and consistent.
We should ensure a risk-reward ratio superior to 1:1, which will be straightforward if we use the SL as described before.
In Figure 1.5, you can see how a failed entry in interest zone 1 (which did not confirm correctly with a bullish candle pattern) would not mean a monetary loss if the SL had been moved to break-even; and in Figure 1.6, you will observe the correct trade management in a confirmed entry in interest zone 2.
Figure 1.5
Figure 1.6
Importance of the ABCD Pattern
The ABCD pattern reflects a part of investor psychology that, in the right context, can give us an extra point of statistical effectiveness. In double bottoms, I recommend taking entries at the first line of interest (around the 0.786 Fibonacci retracement) without neglecting the detection of the ABCD pattern and the always necessary volume and price confirmations.
At the second line of interest, considering that bear traps are extremely volatile, I believe we could overlook the detection of this type of pattern (ABCD), without discarding the notable volume entry and the candle pattern that confirms the entry.
Final Words
There are many contexts where an ABCD pattern will be our edge, but I have limited myself to addressing my personal application in double bottoms due to the complexity of the matter and the considerable time it would take me to exemplify each scenario.
If what is presented here proved useful, I will continue sharing in subsequent articles about different ways to establish effective entries using this pattern.
Bibliography
Bulkowski, T. N. (2005). The simple ABC correction. Technical Analysis of Stocks & Commodities , 23 (1), 52-55.
Carney, S. M. (2010). Harmonic trading, volume one: Profiting from the natural order of the financial markets. FT Press.
Elliott, R. N. (1946). Nature's law: The secret of the universe.
Morge, T. (2003). Trading with median lines: Mapping the markets. Market Geometry.

Digital Dominates the Market and Old Methods Fall Behind1. The Rise of the Digital Era
The digital era began with the advent of computers and the internet but truly accelerated with smartphones, artificial intelligence (AI), big data, and automation. These technologies didn’t just improve existing systems; they created entirely new ways of doing business. Digitalization allowed information to flow faster, decisions to be data-driven, and processes to be more efficient.
For instance, e-commerce giants like Amazon, Alibaba, and Flipkart have replaced traditional brick-and-mortar stores as dominant retail forces. Customers now shop online, compare prices instantly, and get deliveries at their doorsteps — conveniences that were unimaginable two decades ago. Similarly, in finance, digital payment systems like UPI, PayPal, and cryptocurrency have made cash transactions almost obsolete in many regions.
2. Speed and Efficiency: The Core of Digital Dominance
One of the most significant advantages of digital systems is speed. Digital tools can process massive amounts of data in seconds, something manual systems could never achieve. Businesses can now analyze trends, predict demand, and make instant adjustments in pricing or supply chains.
For example, algorithms in stock markets execute millions of trades per second, optimizing profits based on market data — a task that human traders simply cannot match. In logistics, GPS tracking and automated warehouses ensure timely deliveries and reduced operational costs.
Efficiency is also enhanced through automation. Robots, AI chatbots, and machine learning systems perform repetitive tasks, allowing human workers to focus on creativity and strategy. This blend of automation and intelligence has become the new norm in production, healthcare, and customer service.
3. Data: The New Currency
In the digital world, data is power. Every click, purchase, and search generates valuable data that companies use to understand consumer behavior. This information helps businesses personalize products, target advertisements, and improve customer satisfaction.
Old methods relied on surveys or assumptions to gauge customer preferences, which were often inaccurate or outdated. Today, real-time analytics tools like Google Analytics, Meta Ads Manager, and CRM platforms provide detailed insights within minutes. As a result, companies can make evidence-based decisions instead of relying on guesswork.
For instance, Netflix uses viewer data to recommend shows, while Spotify curates music playlists using AI algorithms. These personalized experiences are key to retaining customers in the digital marketplace.
4. The Fall of Traditional Business Models
Traditional business methods, which depended heavily on manual labor, paperwork, and face-to-face interactions, are struggling to compete in a digital-first environment. The COVID-19 pandemic accelerated this shift — businesses without a digital presence suffered major losses or closures, while those that embraced technology thrived.
Brick-and-mortar retail stores have been replaced by online platforms. Newspapers are losing readers to digital media outlets and social networks. Even traditional banking, once reliant on in-person visits, has moved online through mobile banking and fintech apps.
Moreover, digital marketing has replaced conventional advertising. Television and print ads are losing relevance as companies turn to social media, influencer collaborations, and targeted online campaigns to reach audiences more effectively.
5. Global Connectivity and Market Expansion
Digital technology has eliminated geographical barriers. A small business in India can sell products to customers in Europe or the U.S. through online platforms. Social media allows brands to build global reputations, while digital payment systems and logistics networks simplify international trade.
Old methods, which relied on local marketing and limited reach, could never achieve this level of global exposure. Today’s startups can scale faster than ever before because the digital world provides instant access to millions of potential customers.
6. Innovation and Adaptation: The Key to Survival
In this digital-dominated market, innovation is the ultimate survival strategy. Companies that fail to adapt risk becoming irrelevant. Kodak is a classic example — once a photography giant, it fell behind because it ignored the rise of digital cameras. Similarly, Nokia, a leading mobile manufacturer, lost market share after failing to adapt to smartphone technology.
In contrast, businesses that embrace digital transformation, like Apple, Tesla, and Google, continue to lead their industries. They innovate continuously, leveraging AI, machine learning, and automation to stay ahead of competitors.
The lesson is clear: technology evolves rapidly, and only those willing to evolve with it can sustain success.
7. Digital Transformation in Key Sectors
a) Finance:
Fintech innovations have revolutionized banking. Digital wallets, online trading platforms, and blockchain technology have reduced dependency on traditional banking.
b) Education:
E-learning platforms like Coursera and Byju’s have replaced conventional classrooms for millions, offering flexibility and accessibility.
c) Healthcare:
Telemedicine, AI diagnostics, and wearable devices now monitor patient health remotely, reducing hospital visits.
d) Manufacturing:
Smart factories use IoT (Internet of Things) and robotics to enhance production efficiency.
e) Media and Entertainment:
Streaming services have replaced cable television, and social media has become a primary source of news and engagement.
Each of these sectors illustrates how old systems fade as digital tools redefine efficiency and user experience.
8. The Challenges of Digital Dominance
While digital transformation brings numerous benefits, it also presents challenges. Cybersecurity threats, data privacy concerns, and the risk of automation-driven unemployment are major issues. Small businesses often struggle to afford the technology required to stay competitive.
Furthermore, digital dependence can lead to inequality — regions with poor internet connectivity or digital literacy may fall behind economically. Hence, governments and organizations must focus on digital inclusion and cybersecurity to ensure a balanced digital future.
9. The Future: A Fully Digital Ecosystem
Looking ahead, the world is moving toward complete digital integration. Artificial intelligence, quantum computing, and blockchain will dominate future innovations. Physical money may vanish, replaced entirely by digital currencies. Autonomous vehicles, smart cities, and virtual reality workplaces are becoming realities.
The Internet of Everything — where every object is connected — will redefine how people live and work. Old methods will not disappear entirely, but they will become niche or nostalgic alternatives rather than mainstream options.
10. Conclusion
The dominance of digital technology marks one of the most profound shifts in human history. It has redefined efficiency, speed, and accessibility while transforming every aspect of business and daily life. Traditional methods, though valuable in their time, can no longer meet the demands of an interconnected, data-driven economy.
In the digital age, adaptation is not optional — it is essential. Those who embrace change, invest in innovation, and harness the power of data will lead the future. The world has entered an era where the digital dominates the market, and the old methods, while respected, inevitably fall behind.
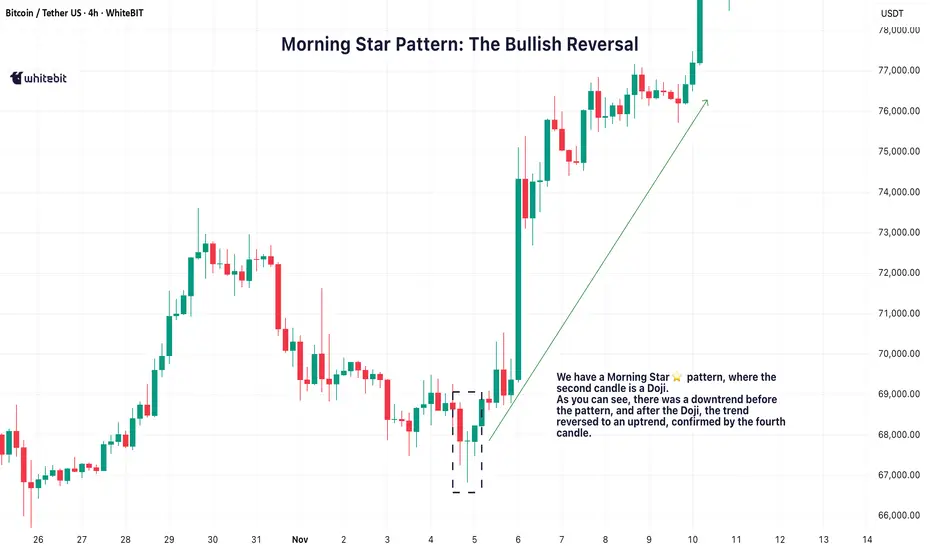
Mastering Trend Reversals: Morning & Evening Star PatternsSo, you're trying to nail those trend reversals? The Morning and Evening Star patterns are perfect for that. They show up right when the market’s about to shift, giving you a chance to get in before the move really takes off. Let’s break down how these setups work and why they’re such solid tools for traders like you.
🌅 Morning Star Pattern: The Bullish Reversal
The Morning Star pattern is one of the best ways to catch a trend reversal from bearish to bullish. It usually pops up after a downtrend, signaling that the market is about to make a move to the upside. It’s made up of three candles:
A long red candle that shows the market’s been selling off.
A small candle, often a Doji, that indicates indecision or a pause in the downtrend.
A big green candle that confirms the shift, showing buyers are taking control.
When you spot a Morning Star candlestick pattern, it’s a strong indication that the downtrend might be over and the bulls could be taking over. The third candle plays a crucial role here, confirming that the trend is likely reversing.
🌇 Evening Star Pattern: The Bearish Reversal
On the flip side, the Evening Star pattern is the bearish cousin of the Morning Star. It shows up after an uptrend and signals that the market is ready to start heading down. It also consists of three candles:
A long green candle that continues the uptrend.
A small candle, again often a Doji, that suggests the market’s losing momentum.
A big red candle that confirms the reversal, showing sellers are stepping in.
When you see the Evening Star candlestick pattern, it tells you that the market could be shifting from bullish to bearish. The third candle confirms that the reversal might be taking place.
💡 Trading the Star Patterns
Both the Morning Star trading pattern and Evening Star patterns are great for spotting potential trend reversals, but they shouldn't be relied on as the only signal. To increase the reliability of these patterns, consider confirming them with other indicators like RSI (Relative Strength Index) , MACD (Moving Average Convergence Divergence) , or volume analysis.
For example, if a Morning Star pattern candlestick appears and is followed by increasing volume, it adds strength to the reversal signal. Similarly, if the Evening Star shows up with an overbought RSI, it could provide further confirmation that the market is due for a pullback.
By using these additional tools, you can have more confidence in your analysis and make better-informed decisions.
📈 Why These Patterns Matter
The Morning Star and Evening Star patterns are powerful tools for identifying potential trend reversals. They give traders a visual cue that a market shift could be on the horizon, helping to spot potential turning points.
However, it’s crucial to make your trading decisions based on a combination of factors and not rely solely on these patterns. Always make sure to consider the broader market context and other technical indicators before acting on any pattern.
US Dollar's Abnormal BehaviorWhy am I saying it abnormal
- because typically DXY tends to weaken with a rate cuts
- In the last 2 month - there were 2 rate cuts,
- but since those "cuts", a declining dollar begins to show upward corrections (or started getting strong)
- Yesterday - ADP released a very strong labor statistics +42K from -29K in the previous month
- Now dollar must continue to strengthen & rise upon such positive data...........
- But today, DXY started with a gap-down and outlook looks further bearish today

Trading FX Spreads: Finding Fair Value & Spotting 'NO FLOW' DaysIn this video, I break down what's driving the flow with regards to FX Spreads. FX Spreads are my favorite synthetic instrument to trade because they say more than meets the eye. The spread is a pure measure of underlying relative value rather than being distorted by heavy directional momentum.
By combining the data with the Fair Value Price, it's easy to see if it's worth getting involved. In today's trade, you'll see the rare phenomenon I like to call a "NO FLOW" day. These are days where it's clear to see the majority of the market sitting on the sidelines.
GBP (Pound Move)
$OANDA:GBPNZD-FX:GBPUSD
FPMARKETS:GBPNZD OANDA:GBPCAD
CME:6B1!
Any move here is largely related to Chancellor Reeves telling the Budget watchdog that she plans to increase income tax as she seeks to repair the public finances.

How Global Markets Are Responding to Economic Shifts1. Price discovery and the immediate reaction
When new economic data or events arrive (jobs reports, CPI numbers, trade disruptions, or political shocks), markets move almost instantaneously to incorporate the information. High-frequency trading and algorithmic strategies often amplify initial moves — a surprise inflation print can trigger a sharp sell-off in bonds and a near-instant repricing of interest rate expectations. Equities typically show the widest variance by sector: interest-rate sensitive sectors (real estate, utilities) fall faster when rates spike, while commodity producers and cyclical industries may rally if the data imply stronger demand.
2. Interest rates and bond market mechanics
The bond market is the backbone of market response. Expectations about central bank policy — the path of short-term rates and the pace of balance-sheet actions — are priced into government yields globally. If inflation surprises on the upside or central banks signal tighter policy, yields rise and bond prices fall. This yields shock affects everything: higher yields increase the discount rate used to value equities, lower present values of future corporate earnings, and raise borrowing costs for companies and households. Conversely, signs of slowing growth or deflation risk push yields down, often boosting long-duration assets (growth stocks, long bonds).
3. Equity markets: winners, losers, and rotation
Stock markets reflect both macro outlooks and company-level fundamentals. In a growth-acceleration scenario, cyclicals, industrials, and small-cap stocks often outperform as investors rotate into riskier, higher-beta assets. In a growth-slowdown, defensive sectors (consumer staples, health care) and dividend-paying stocks usually offer relative safety. Market breadth and leadership shifts matter: when a handful of mega-cap tech companies are driving indices, the headline index may mask a narrower market. Active managers watch these leadership signals to rotate exposures.
4. Currency markets and capital flows
Currencies are real-time indicators of comparative economic strength and monetary policy. A central bank expected to raise rates will typically see its currency appreciate as yield-seeking capital flows in. Conversely, risk-off episodes trigger “flight-to-safety” flows toward reserve currencies (commonly the US dollar), pushing emerging-market and commodity-linked currencies lower. Persistent trade imbalances, capital controls, and sovereign risk perceptions also shape currency moves, which then feed back into inflation and corporate earnings through import costs and translation effects.
5. Commodities and real assets
Commodities react to both demand expectations and supply shocks. Energy prices surge with geopolitical tensions or supply disruptions, while industrial metals track global manufacturing health. Inflationary episodes often raise real asset prices — commodities and real estate can act as inflation hedges — but the relationship isn’t perfect and depends on real yields and growth expectations. Agricultural commodities can respond to weather and logistics as much as to macro demand.
6. Volatility, risk premia, and the cost of hedging
Economic shifts increase uncertainty, and volatility is the market’s “fear gauge.” Rising volatility raises the cost of hedging (options become more expensive), which alters trading strategies and risk management. Investors demand higher risk premia for holding volatile assets; this can push required returns up and valuations down. Institutional players often recalibrate portfolio risk — reducing leverage, increasing cash, or buying volatility protection — which can exacerbate short-term price moves.
7. Credit markets and corporate financing
Corporate bond spreads widen when growth fears or credit concerns rise, reflecting higher default risk or liquidity premiums. Tighter credit conditions hurt leveraged companies first, possibly slowing investment and hiring. Conversely, easier financial conditions (lower borrowing costs, ample liquidity) support refinancing, M&A activity, and risk-taking. The health of the banking system and non-bank lenders matters: stress in credit intermediation channels can transmit shocks to the broader economy quickly.
8. Policy responses and market feedback loops
Markets react not just to events but to the expected policy responses. Central banks and fiscal authorities monitor market signals closely. Sometimes markets move because investors anticipate policy easing or tightening; other times, central banks move because markets have moved (e.g., to restore stability). This two-way feedback can create virtuous cycles (confidence begets investment) or vicious ones (sell-offs trigger credit tightening). Transparency and forward guidance from policymakers help stabilize expectations, but surprises still cause sharp market adjustments.
9. Structural and technological influences
Market structure and technology have changed how responses unfold. Algorithmic trading, ETFs, and passive investment have altered liquidity patterns; large flows in and out of ETFs can amplify moves in underlying assets. Global interconnectedness means shocks travel faster — a manufacturing slowdown in one region quickly impacts supply chains and corporate earnings elsewhere. At the same time, data availability and analytics allow investors to react faster and to hedge with more precise instruments.
10. Longer-term asset allocation shifts
Sustained economic shifts—like a multi-year inflation regime change, deglobalization, or energy transition—reconfigure long-term allocations. Investors may favor real assets, shorten duration in fixed income, overweight certain regions, or increase allocations to alternatives (private equity, infrastructure) that offer different risk-return profiles. Pension funds and insurers, with long-dated liabilities, pay special attention to regime shifts because they directly affect funding ratios and required returns.
Conclusion — pragmatic lessons for investors
Markets are efficient at processing new information, but they are not always rational. Short-term reactions can be loud and disorderly; medium-term trends matter more for portfolios. Key practical takeaways: (1) watch interest-rate expectations and real yields — they shape valuations across assets; (2) track leadership and breadth in equity markets — it tells you if moves are broad-based or concentrated; (3) manage liquidity and hedging costs — volatility can spike unexpectedly; and (4) focus on scenario planning rather than prediction. A disciplined, diversified approach that explicitly considers how different assets respond to rate, growth, and inflation shocks will navigate economic shifts more successfully than one that chases yesterday’s winners.

Definition and Relationship between Interest Rates and InflationIntroduction
Interest rates and inflation are two of the most important macroeconomic variables that influence the health, stability, and direction of any economy. They play a vital role in shaping economic growth, consumption patterns, investment decisions, and monetary policy. Economists, central banks, and policymakers constantly monitor the movement of interest rates and inflation because they are closely interconnected. A change in one often triggers a response in the other. Understanding their definitions, types, and interrelationship provides insight into how monetary policy stabilizes the economy and controls price levels.
Definition of Interest Rates
An interest rate is the cost of borrowing money or the return earned on savings or investments, expressed as a percentage of the principal amount per unit of time (usually per year). Essentially, it represents the price of money. When individuals, businesses, or governments borrow funds, they pay interest as compensation to the lender for parting with liquidity and bearing risk.
From an economic standpoint, interest rates are a tool to balance the demand for and supply of money. Central banks, such as the Reserve Bank of India (RBI) or the Federal Reserve in the U.S., use interest rates as a primary monetary policy instrument to influence economic activity.
Types of Interest Rates
Nominal Interest Rate: The stated rate without adjusting for inflation. It represents the actual amount paid or received in monetary terms.
Real Interest Rate: The nominal rate adjusted for inflation. It reflects the true cost of borrowing and the real return to lenders. The relationship is given by:
Real Interest Rate
=
Nominal Interest Rate
−
Inflation Rate
Real Interest Rate=Nominal Interest Rate−Inflation Rate
Policy Rate: The rate set by the central bank to regulate credit in the economy. Examples include the repo rate and reverse repo rate in India.
Market Interest Rate: Determined by the forces of demand and supply of money in financial markets.
Definition of Inflation
Inflation refers to the sustained increase in the general price level of goods and services in an economy over a period of time. When prices rise, the purchasing power of money decreases, meaning that each unit of currency buys fewer goods and services.
Inflation is not inherently bad—moderate inflation encourages spending and investment. However, excessive inflation erodes the value of savings, disrupts economic planning, and may lead to social and economic instability. Conversely, deflation, or the decline in prices, can be equally harmful because it discourages spending and investment, leading to lower economic growth.
Types of Inflation
Demand-Pull Inflation: Occurs when aggregate demand exceeds aggregate supply, causing upward pressure on prices.
Cost-Push Inflation: Arises when production costs (like wages and raw materials) increase, leading to higher prices for goods and services.
Built-In Inflation: Stems from the wage-price spiral, where workers demand higher wages to keep up with rising prices, which in turn increases production costs.
Hyperinflation: Extremely rapid and uncontrolled inflation, usually above 50% per month.
Stagflation: A condition where inflation and unemployment rise simultaneously, posing a severe challenge for policymakers.
The Relationship between Interest Rates and Inflation
Interest rates and inflation share a strong, inverse, and dynamic relationship. Generally, when inflation rises, central banks increase interest rates to control it. Conversely, when inflation falls or economic growth slows, they reduce interest rates to encourage borrowing and spending.
The interaction between the two can be understood through the following mechanisms:
1. The Fisher Effect
The Fisher Effect, named after economist Irving Fisher, explains the relationship between nominal interest rates, real interest rates, and expected inflation. According to this theory, the nominal interest rate is equal to the sum of the real interest rate and the expected inflation rate.
𝑖
=
𝑟
+
𝜋
𝑒
i=r+π
e
Where,
𝑖
i = Nominal interest rate
𝑟
r = Real interest rate
𝜋
𝑒
π
e
= Expected inflation rate
If inflation expectations rise, lenders demand higher nominal rates to maintain the same real return. This mechanism ensures that real returns remain stable despite fluctuations in price levels.
2. Central Bank Policy Response
Central banks play a key role in managing the relationship between interest rates and inflation. When inflation rises beyond the target (for example, above the RBI’s comfort zone of 4 ± 2%), the central bank raises policy rates such as the repo rate. This increases the cost of borrowing, reduces money supply, and cools down demand, thereby reducing inflationary pressure.
On the other hand, during periods of low inflation or deflation, the central bank cuts interest rates to stimulate borrowing, investment, and spending, which helps increase demand and stabilize prices.
3. Transmission Mechanism
Changes in policy rates affect inflation through the monetary policy transmission mechanism:
Higher interest rates → Higher borrowing costs → Reduced consumer spending and business investment → Lower aggregate demand → Reduced inflation.
Lower interest rates → Cheaper credit → Increased spending and investment → Higher aggregate demand → Rising inflation.
This process, however, takes time, and the impact may vary depending on the economy’s structure and financial system efficiency.
4. Inflation Expectations and Real Interest Rate
Inflation expectations influence both consumer behavior and monetary policy. If people expect future inflation to be high, they tend to spend more now, further driving up prices. Central banks, therefore, aim to anchor inflation expectations by maintaining credibility in their policies. Real interest rates (nominal minus inflation) provide the true measure of whether monetary policy is expansionary or contractionary.
For instance, if the nominal rate is 6% and inflation is 5%, the real interest rate is only 1%, indicating easy monetary conditions. Conversely, if inflation is 2% and the nominal rate is 6%, the real rate is 4%, signaling a tighter policy stance.
Impact of Inflation on Interest Rates
Rising Inflation → Higher Interest Rates:
When inflation increases, lenders demand higher nominal interest rates to offset the loss in purchasing power. Central banks raise policy rates to control excess demand and price rises.
Falling Inflation → Lower Interest Rates:
Low inflation reduces the pressure on monetary authorities, allowing them to lower interest rates and stimulate growth.
Unexpected Inflation → Distorted Interest Rates:
If inflation rises unexpectedly, borrowers benefit because they repay loans with money that has less value, while lenders lose purchasing power.
Impact of Interest Rates on Inflation
Tight Monetary Policy:
Raising interest rates reduces credit availability, slows economic activity, and curbs inflationary trends.
Loose Monetary Policy:
Lowering interest rates encourages borrowing and spending, potentially leading to inflation if demand exceeds supply.
Interest Rate Lag Effect:
Monetary policy operates with a time lag. It may take several months for interest rate changes to influence inflation meaningfully.
Practical Examples
United States: In the 1980s, the Federal Reserve under Paul Volcker sharply increased interest rates to curb double-digit inflation, successfully restoring price stability.
India: The Reserve Bank of India often adjusts the repo rate in response to consumer price index (CPI) inflation. For instance, during high inflation periods such as 2013 or 2022, the RBI raised rates to maintain price stability.
Conclusion
The relationship between interest rates and inflation is one of the cornerstones of modern macroeconomic management. While inflation represents the rate at which prices increase, interest rates determine the cost of borrowing and the reward for saving. The two are intricately linked through expectations, monetary policy, and the overall balance of demand and supply in the economy.
An optimal policy aims to maintain a balance—interest rates that are neither too high to stifle growth nor too low to fuel inflation. Central banks, through careful monitoring and policy adjustments, strive to achieve price stability and sustainable economic growth. Understanding this delicate relationship is essential for investors, businesses, and policymakers in making informed economic decisions.
Evolution and Growth of the Hedge Fund Industry1. Origins of Hedge Funds (1940s–1960s)
The concept of hedge funds began in 1949 when Alfred Winslow Jones, a sociologist and financial journalist, launched the first modern hedge fund. Jones introduced the revolutionary idea of combining long and short positions to hedge against market fluctuations, aiming to reduce risk while maximizing returns. He also implemented performance-based fees, taking 20% of profits, a structure that became standard across the industry.
Jones’ approach—using leverage, short selling, and active management—distinguished his fund from traditional mutual funds, which were restricted by regulations and passive investment mandates. His strategy sought “absolute returns” regardless of market direction, laying the foundation for modern hedge fund philosophy.
Throughout the 1950s and 1960s, hedge funds remained relatively obscure, operating primarily as private partnerships for high-net-worth individuals. Their secrecy and exclusivity contributed to an aura of mystery that persists even today.
2. Expansion and Innovation (1970s–1980s)
The 1970s marked a period of economic volatility, including oil shocks, inflation, and market instability. These conditions provided fertile ground for hedge funds, which thrived on flexibility and alternative strategies. During this era, funds began to diversify beyond simple long-short equity plays into macro strategies, arbitrage, and event-driven investing.
The 1980s saw an acceleration of growth, largely driven by financial deregulation, advances in technology, and the rise of institutional investors. Hedge funds started attracting endowments and pension funds seeking diversification and higher returns. Managers like George Soros and Julian Robertson became iconic figures. Soros’ Quantum Fund famously made $1 billion by shorting the British pound in 1992, an event that showcased the power of hedge funds in global finance.
Hedge funds also began to operate across borders, benefiting from globalization and the liberalization of capital markets. Their ability to move swiftly in and out of markets made them powerful players in global finance, influencing currencies, interest rates, and stock indices.
3. Institutionalization and Mainstream Growth (1990s)
The 1990s were a turning point when hedge funds transitioned from exclusive private partnerships into an institutionalized investment industry. Large investors—such as university endowments, foundations, and pension funds—began allocating significant capital to hedge funds as part of diversified portfolios.
The proliferation of new strategies defined this decade. Hedge funds expanded into convertible arbitrage, fixed income arbitrage, global macro, distressed securities, and emerging markets. This diversification not only attracted new investors but also mitigated risks by spreading exposure across multiple asset classes.
The 1990s also brought increased attention to hedge funds’ impact on financial markets. The collapse of Long-Term Capital Management (LTCM) in 1998 highlighted both the sophistication and fragility of hedge fund strategies. LTCM’s use of massive leverage and complex derivatives led to a near-systemic crisis when markets turned against it. The U.S. Federal Reserve intervened to organize a bailout, illustrating hedge funds’ growing systemic importance.
Despite this setback, the industry continued to grow. Hedge funds became symbols of financial innovation and intellectual talent, often recruiting PhDs, mathematicians, and computer scientists to develop quantitative and algorithmic models that enhanced investment precision.
4. The Boom Years (2000–2007)
The early 2000s were the golden age of hedge funds. The industry’s assets under management (AUM) grew exponentially—from around $500 billion in 2000 to over $2 trillion by 2007. This growth was fueled by several factors:
Market turbulence following the dot-com crash increased demand for non-traditional investments.
Low interest rates and easy credit encouraged the use of leverage.
Institutional acceptance expanded, with funds-of-funds acting as intermediaries for smaller investors.
Globalization and technology enabled sophisticated strategies across markets and asset classes.
Hedge fund managers such as John Paulson, Ray Dalio, and David Einhorn became household names, with funds generating outsized returns. The diversity of strategies—from statistical arbitrage to credit default swaps—helped hedge funds outperform traditional asset classes.
However, the industry’s success also brought scrutiny. Critics argued that high fees, secrecy, and leverage created systemic risks. Regulators began exploring ways to increase transparency and oversight.
5. The Global Financial Crisis and Aftermath (2008–2012)
The 2008 global financial crisis was a defining moment for the hedge fund industry. Many funds suffered significant losses due to market collapses and liquidity freezes. However, hedge funds fared better than traditional asset managers overall, as their flexible strategies allowed quicker adaptation to market turmoil.
The crisis reshaped the industry in several ways:
Regulatory oversight increased, particularly through the Dodd-Frank Act in the U.S., which mandated registration, disclosure, and risk reporting.
Investor demands shifted toward transparency, liquidity, and risk management.
Fund closures and consolidations occurred as smaller or over-leveraged funds failed to recover.
Despite short-term setbacks, the post-crisis period laid the groundwork for a more stable, professionalized, and transparent hedge fund ecosystem.
6. Maturity and Technological Transformation (2013–Present)
In the 2010s and beyond, the hedge fund industry entered a mature phase marked by both stability and competition. Assets under management exceeded $4 trillion globally, with thousands of funds operating across diverse strategies.
The rise of quantitative funds and machine learning-driven strategies revolutionized the landscape. Firms like Renaissance Technologies, Two Sigma, and AQR Capital Management demonstrated how big data, artificial intelligence, and algorithmic trading could generate alpha with minimal human intervention.
Simultaneously, hedge funds faced new challenges:
Fee pressure due to underperformance relative to benchmarks.
Competition from passive investing (ETFs and index funds).
Demand for ESG (Environmental, Social, and Governance) integration as investors prioritized sustainability.
Regulatory constraints and increased compliance costs in multiple jurisdictions.
Yet, hedge funds continued to evolve. Many adopted hybrid models, blending traditional discretionary investing with automated systems. Others expanded into private credit, venture capital, and digital assets, reflecting their adaptive DNA.
7. Globalization and the Future Outlook
Today, hedge funds are an integral part of the global financial ecosystem. They operate across continents—from New York and London to Singapore and Hong Kong—serving a diverse investor base that includes sovereign wealth funds, pension funds, and family offices.
The future of hedge funds lies in innovation and adaptability. Artificial intelligence, blockchain, and decentralized finance (DeFi) are expected to reshape strategies, data analytics, and operational efficiency. Moreover, the increasing focus on sustainability and impact investing suggests a new generation of “green hedge funds” that align profit motives with ethical imperatives.
While traditional hedge fund models may face fee compression and rising competition, the industry’s agility ensures its relevance. The drive for alpha generation, risk diversification, and strategic flexibility remains the cornerstone of hedge fund success.
Conclusion
The evolution of the hedge fund industry—from Alfred Winslow Jones’ experimental partnership in 1949 to today’s global network of multi-strategy investment giants—illustrates a story of innovation, resilience, and adaptability. Each era brought unique challenges and transformations, from the intellectual revolution of long-short strategies to the data-driven frontiers of algorithmic trading.
Despite cyclical setbacks, hedge funds have consistently evolved to meet changing market conditions and investor demands. Their journey underscores a central truth: the pursuit of absolute returns and risk-adjusted performance will always attract investors seeking to outpace the market. The hedge fund industry, now a mature yet dynamic force, continues to shape the future of global finance—balancing secrecy with sophistication, and innovation with responsibility.

Challenges and Risks in Global Investing1. Introduction to Global Investing
Global investing refers to the practice of allocating capital across international markets, including stocks, bonds, mutual funds, and other financial instruments from different countries. While it offers opportunities to capture growth from emerging economies and diversification benefits, it also exposes investors to risks that stem from global interdependence. These risks may arise due to variations in political systems, market maturity, taxation, and macroeconomic conditions. Therefore, a well-informed global investor must carefully assess the potential threats and rewards before investing abroad.
2. Currency Risk
One of the most significant challenges in global investing is currency risk or exchange rate risk. When investors hold assets denominated in foreign currencies, fluctuations in exchange rates can affect investment returns.
For example, if an Indian investor invests in U.S. stocks and the Indian rupee strengthens against the U.S. dollar, the investor’s returns in rupee terms will decrease even if the stock’s price rises in dollar terms. Similarly, if the rupee weakens, the investor may benefit from favorable exchange rate movements.
Currency volatility is influenced by inflation, interest rate differentials, trade balances, and geopolitical factors. Investors can mitigate this risk through hedging strategies, such as currency futures or options, but these come with additional costs and complexities.
3. Political and Geopolitical Risks
Political instability is another major challenge in global investing. Changes in government, social unrest, corruption, or political uncertainty can severely affect the performance of investments in certain countries.
For example, political tensions between countries can lead to trade restrictions, sanctions, or expropriation of assets, directly impacting multinational companies. The Russia-Ukraine conflict in recent years, for instance, has led to economic sanctions that affected investors with exposure to those regions.
Similarly, sudden policy changes such as nationalization of industries, tax reforms, or foreign investment restrictions can negatively impact returns. Hence, political risk assessment is crucial when investing in developing or politically unstable nations.
4. Economic and Market Risks
Different economies move through cycles of expansion and contraction at varying times. This creates economic risk, which can impact the performance of international investments.
Emerging markets often offer high growth potential but may also experience sharp downturns due to weak economic structures, inflationary pressures, or currency devaluations. Developed markets, on the other hand, may provide stability but lower growth prospects.
Moreover, global market risks—such as recessions, interest rate hikes, or financial crises—can have widespread effects. The 2008 Global Financial Crisis demonstrated how interconnected financial markets are, as a collapse in the U.S. housing market triggered a worldwide recession.
5. Regulatory and Legal Risks
Each country operates under its own regulatory framework, which governs business practices, financial reporting, and investor protections. Differences in accounting standards, disclosure requirements, and corporate governance practices can pose serious challenges for global investors.
For example, while the U.S. follows GAAP (Generally Accepted Accounting Principles), many other countries use IFRS (International Financial Reporting Standards). These variations can make it difficult to compare companies across borders.
Legal systems in some countries may also lack transparency or enforceability. In extreme cases, investors may face fraud, corruption, or lack of legal recourse when disputes arise. Therefore, understanding the local legal and regulatory landscape is essential before making any international investment.
6. Cultural and Communication Barriers
Cultural differences play a subtle but significant role in global investing. Business practices, negotiation styles, corporate culture, and consumer behavior vary across regions. Misunderstanding these cultural nuances can lead to poor investment decisions.
For instance, a company operating successfully in the U.S. might not achieve the same results in Japan or India due to differences in consumer preferences, labor laws, or management styles. Similarly, language barriers can lead to misinterpretation of financial information or communication errors with local partners and institutions.
Investors need to account for these soft factors when analyzing global markets to ensure that cultural misalignment does not undermine business potential.
7. Liquidity Risk
Liquidity risk arises when investors are unable to buy or sell an asset quickly without affecting its price. In many foreign markets—especially in developing nations—financial instruments are less liquid than in major global exchanges.
For example, while shares on the New York Stock Exchange (NYSE) can be traded almost instantly, stocks listed on smaller exchanges in emerging economies may take days or weeks to execute. This can pose problems during times of market stress when investors need to exit positions quickly.
Investors must, therefore, assess the liquidity levels of foreign markets before investing and avoid overexposure to illiquid assets.
8. Information and Transparency Challenges
Access to reliable and timely information is a cornerstone of sound investment decisions. However, in many countries, financial transparency and disclosure standards are not as rigorous as in developed markets.
Incomplete or inaccurate data can lead to mispricing of assets and poor investment choices. Furthermore, language differences, lack of research coverage, and limited access to company executives can make it difficult for foreign investors to fully understand the market environment.
Global investors often rely on local analysts, financial news, or international advisory firms to bridge this information gap.
9. Taxation and Repatriation Issues
Each country has its own tax laws, including capital gains tax, dividend tax, and withholding tax. Navigating these differences can be complicated, especially when double taxation treaties are not in place.
Additionally, repatriating profits from foreign investments can be difficult due to restrictions on currency transfers or unfavorable exchange rate conditions. Investors must consult international tax experts and understand cross-border tax implications to avoid unexpected liabilities.
10. Technological and Cybersecurity Risks
As global investing increasingly relies on digital platforms, cybersecurity threats have become a significant concern. Online trading platforms, digital banking systems, and financial data networks are all vulnerable to hacking and data breaches.
Moreover, technological disparities between countries may also impact efficiency and transparency. In less developed markets, outdated trading infrastructure or lack of digital safeguards can increase operational risks.
Investors must prioritize cybersecurity and ensure their brokers or financial institutions follow robust digital protection standards.
11. Environmental, Social, and Governance (ESG) Risks
The growing importance of ESG factors in global investing introduces another dimension of risk. Companies that fail to comply with environmental regulations, labor rights, or ethical practices may face boycotts, fines, or reputational damage.
Investors must evaluate not only financial performance but also the sustainability practices of international firms. Ignoring ESG considerations can result in long-term losses as global markets increasingly reward responsible and transparent businesses.
12. Global Systemic Risks
Certain risks, such as pandemics, climate change, and global recessions, affect the entire world simultaneously. The COVID-19 pandemic, for instance, caused massive disruptions across industries and countries, showing that no market is entirely insulated from global shocks.
Such systemic risks highlight the importance of maintaining flexibility, diversification, and proper risk management strategies in global portfolios.
13. Strategies to Mitigate Global Investment Risks
While global investing carries challenges, investors can manage these risks through prudent strategies:
Diversification: Spreading investments across regions, sectors, and asset classes reduces exposure to any single market.
Hedging: Using derivatives like options or futures to protect against currency or commodity price fluctuations.
Research and Due Diligence: Conducting in-depth analysis of political, economic, and financial environments before investing.
Professional Guidance: Consulting international fund managers or advisors with local expertise.
Regular Monitoring: Continuously tracking geopolitical and economic developments that may impact returns.
14. Conclusion
Global investing offers immense opportunities for wealth creation and diversification, but it comes with complex challenges and risks. Factors such as currency volatility, political instability, regulatory differences, and global crises can significantly impact investment outcomes. Successful global investors must adopt a disciplined approach that combines research, diversification, and risk management. By understanding and navigating these challenges wisely, investors can unlock the full potential of global markets while safeguarding their capital against unforeseen global shocks.

Major Global Stock Exchanges1. Understanding Stock Exchanges
A stock exchange is an organized marketplace where securities—like stocks, bonds, and derivatives—are issued and traded. It provides liquidity to investors, transparency in pricing, and regulatory oversight to ensure fair practices. Each major exchange operates under a national financial authority but impacts global markets through interconnected trading systems and investor participation.
Stock exchanges help channel savings into productive investments and play a crucial role in economic development by enabling companies to raise capital for growth. The performance of major exchanges often mirrors the strength or weakness of their respective economies.
2. The New York Stock Exchange (NYSE)
The New York Stock Exchange, located on Wall Street, is the largest and most prestigious stock exchange in the world by market capitalization. Established in 1792 under the Buttonwood Agreement, the NYSE has been a symbol of American capitalism and financial power for more than two centuries.
Market Capitalization: Over $25 trillion (as of 2025).
Listed Companies: Around 2,400 from diverse sectors.
Index: The Dow Jones Industrial Average (DJIA) and the S&P 500 track major NYSE-listed stocks.
The NYSE operates under the Intercontinental Exchange (ICE) and uses both an electronic trading system and a physical trading floor. Its hybrid model ensures transparency, liquidity, and efficient execution of trades. Companies like Apple, Microsoft, Coca-Cola, and Johnson & Johnson are part of its listings.
The NYSE’s stability, regulatory standards, and investor confidence make it a global benchmark for equity trading and corporate governance.
3. NASDAQ (National Association of Securities Dealers Automated Quotations)
The NASDAQ is the second-largest stock exchange globally, established in 1971 as the world’s first electronic stock market. Unlike the NYSE, NASDAQ has no physical trading floor—it operates entirely electronically.
Market Capitalization: Around $22 trillion.
Focus: Technology-driven companies.
Major Index: NASDAQ Composite Index and NASDAQ-100.
NASDAQ is home to global technology giants such as Apple, Amazon, Google (Alphabet), Meta (Facebook), and Tesla. It revolutionized trading by introducing automation and electronic order matching, which reduced transaction costs and improved efficiency. Its success represents the digital transformation of global finance.
The NASDAQ’s role in nurturing high-growth tech companies has made it synonymous with innovation and modern capitalism.
4. London Stock Exchange (LSE)
The London Stock Exchange, one of the oldest exchanges, traces its roots to 1773. Located in the financial district of London, it is the primary market for securities in the United Kingdom and a vital global financial hub.
Market Capitalization: About $4 trillion.
Listed Companies: Over 1,900 from more than 60 countries.
Main Index: FTSE 100 (Financial Times Stock Exchange 100 Index).
The LSE operates under the London Stock Exchange Group (LSEG), which also owns other financial institutions like Refinitiv and Borsa Italiana. It plays a major role in global capital markets due to its international listings and strategic time zone, bridging Asian and American trading hours.
The LSE’s reputation for transparency, international participation, and regulatory integrity makes it a cornerstone of global finance.
5. Tokyo Stock Exchange (TSE)
The Tokyo Stock Exchange is Japan’s largest and Asia’s most influential exchange. Established in 1878, it is operated by the Japan Exchange Group (JPX).
Market Capitalization: Around $6 trillion.
Listed Companies: More than 3,700.
Major Index: Nikkei 225 and TOPIX (Tokyo Price Index).
The TSE has driven Japan’s post-war economic rise and continues to be a center for corporate excellence and technological innovation. Companies like Toyota, Sony, Honda, and SoftBank are major components of the exchange.
Japan’s exchange is known for its efficiency, advanced technology, and global investor participation. Its performance reflects not only Japan’s economy but also broader Asian market trends.
6. Shanghai Stock Exchange (SSE)
The Shanghai Stock Exchange, established in 1990, is one of the largest exchanges in the world and a crucial part of China’s rapidly expanding financial system.
Market Capitalization: Over $7 trillion.
Listed Companies: About 2,200.
Main Indices: SSE Composite Index and SSE 50.
The SSE is state-regulated and plays a vital role in China’s economic reforms and modernization. It lists large state-owned enterprises such as PetroChina, Industrial and Commercial Bank of China (ICBC), and China Mobile.
While foreign investor access was limited in the past, recent policy reforms have opened Chinese markets to global investors through programs like Stock Connect with Hong Kong. The SSE’s growth signifies China’s transition into a global financial superpower.
7. Hong Kong Stock Exchange (HKEX)
The Hong Kong Stock Exchange, founded in 1891, serves as a bridge between Mainland China and global investors.
Market Capitalization: Around $5 trillion.
Listed Companies: Over 2,500.
Main Index: Hang Seng Index (HSI).
HKEX has become one of the world’s leading fundraising platforms, particularly for Chinese companies seeking international exposure. It plays a strategic role by connecting Western capital with Asian corporations through its Stock Connect system with Shanghai and Shenzhen exchanges.
Its global connectivity, regulatory stability, and location make HKEX a powerful player in the global financial landscape.
8. Euronext
Euronext is a pan-European exchange, established in 2000 through the merger of exchanges in Amsterdam, Brussels, and Paris, later expanding to other European cities.
Market Capitalization: Over $7 trillion.
Listed Companies: Around 1,900.
Main Index: Euronext 100 Index.
Euronext operates in multiple countries, including France, the Netherlands, Belgium, Ireland, Portugal, and Norway. It provides a unified platform for European capital markets and promotes integration within the EU financial system. Its diversity and cross-border listings strengthen Europe’s position in the global economy.
9. Bombay Stock Exchange (BSE) and National Stock Exchange (NSE)
India hosts two major exchanges: BSE and NSE.
Bombay Stock Exchange (BSE): Established in 1875, it is Asia’s oldest stock exchange.
National Stock Exchange (NSE): Founded in 1992, it introduced electronic trading in India.
Market Capitalization: Combined over $5 trillion.
Main Indices: BSE Sensex and NSE Nifty 50.
These exchanges are key players in the emerging market landscape, attracting domestic and global investors. India’s robust regulatory framework under SEBI and its growing economy have made BSE and NSE vital centers for global investment.
10. The Role and Global Impact of Stock Exchanges
Major global stock exchanges are interconnected through technology and investor participation. Events in one market—such as policy changes, interest rate adjustments, or geopolitical crises—can cause ripple effects across others.
They influence foreign investment flows, exchange rates, and commodity prices. For instance, a market correction in the U.S. can affect investor sentiment in Europe and Asia. Similarly, innovations like cross-border listings, exchange-traded funds (ETFs), and derivative trading have deepened global financial integration.
Conclusion
The world’s major stock exchanges form the backbone of the international financial system. From the historical legacy of the NYSE and LSE to the technological dynamism of NASDAQ, TSE, and SSE, each plays a unique role in shaping global capital markets. They serve as economic indicators, facilitate investment, and foster innovation across industries.
In an era of globalization, technological transformation, and cross-border finance, these exchanges are more connected than ever—driving not just national economies but also the financial pulse of the entire world.
Objectives and Functions of the Federal ReserveIntroduction
The Federal Reserve System (commonly called “the Fed”) is the central banking system of the United States. Established in 1913 by the Federal Reserve Act, it was created in response to financial panics and instability that plagued the U.S. economy during the late 19th and early 20th centuries. Over time, the Fed has evolved into one of the most powerful financial institutions in the world, influencing not only the American economy but also global financial markets. Its primary purpose is to ensure a stable financial system, maintain price stability, and promote sustainable economic growth.
Objectives of the Federal Reserve
The Federal Reserve operates under what is known as the “dual mandate,” given by the U.S. Congress. However, in practice, it pursues three broad objectives: maximum employment, stable prices, and moderate long-term interest rates. Additionally, maintaining financial stability and ensuring the safety of the banking system are implicit objectives that guide its policies.
1. Price Stability
Price stability means controlling inflation—keeping it low and predictable. High inflation erodes purchasing power, distorts investment decisions, and creates uncertainty, while deflation (falling prices) can lead to reduced consumer spending and economic stagnation.
The Fed aims for an average inflation rate of around 2% per year, measured by the Personal Consumption Expenditures (PCE) price index. By maintaining price stability, the Fed helps create an environment conducive to sustainable growth and stable employment.
2. Maximum Employment
Another key objective is to achieve maximum employment, meaning that everyone who wants to work can find a job at prevailing wage levels. While the Fed cannot control employment directly, it influences labor markets through monetary policy. For instance, when the economy is weak and unemployment is high, the Fed can lower interest rates to stimulate borrowing, investment, and consumption, which increases job creation.
3. Moderate Long-Term Interest Rates
By controlling inflation and supporting employment, the Fed indirectly maintains moderate long-term interest rates. Stable rates encourage investment in productive assets like housing, infrastructure, and business expansion. This, in turn, promotes economic growth and stability.
4. Financial System Stability
The Fed also seeks to maintain the stability of the U.S. financial system. During times of economic crisis—such as the Great Depression (1930s), the 2008 Global Financial Crisis, or the 2020 pandemic—the Fed steps in to prevent systemic collapses by providing liquidity to banks and financial markets. It acts as a lender of last resort, ensuring confidence in the banking system.
5. Supervisory and Regulatory Objectives
Beyond monetary policy, the Fed regulates and supervises banks to ensure they operate safely and soundly. It aims to protect consumers’ financial interests, prevent excessive risk-taking, and uphold public confidence in the financial system.
Functions of the Federal Reserve
The Federal Reserve carries out its objectives through a range of critical functions that impact every aspect of the U.S. economy and global financial system.
1. Conducting Monetary Policy
Monetary policy is the Fed’s most important function. It involves managing the supply of money and credit to achieve its macroeconomic objectives. The Federal Open Market Committee (FOMC) is responsible for setting monetary policy.
a. Open Market Operations (OMO)
Open market operations are the primary tool for controlling short-term interest rates. When the Fed buys government securities, it injects liquidity into the economy, lowering interest rates and encouraging spending. Conversely, selling securities withdraws money from circulation, raising interest rates to control inflation.
b. Discount Rate
The discount rate is the interest rate charged to commercial banks that borrow directly from the Federal Reserve. Lowering this rate makes borrowing cheaper for banks, stimulating lending, while raising it tightens credit conditions.
c. Reserve Requirements
Banks are required to hold a certain percentage of their deposits as reserves. By adjusting this requirement, the Fed can influence how much money banks can lend. Though rarely used today, it remains a powerful monetary policy tool.
d. Interest on Reserves
Since 2008, the Fed pays interest on the reserves banks hold at the central bank. Adjusting this rate helps the Fed manage short-term interest rates and control liquidity in the financial system.
2. Supervising and Regulating Banks
The Federal Reserve ensures the soundness of the banking system through supervision and regulation. It oversees bank holding companies, state-chartered banks that are members of the Federal Reserve System, and certain foreign banking organizations.
Its regulatory functions include:
Monitoring bank capital adequacy and liquidity.
Enforcing consumer protection laws (like the Truth in Lending Act).
Conducting periodic stress tests to ensure banks can withstand economic shocks.
Preventing excessive risk-taking that could endanger financial stability.
This oversight protects both depositors and the broader economy from banking crises.
3. Maintaining Financial System Stability
The Fed plays a crucial role as a lender of last resort. During financial crises, it provides liquidity to prevent bank runs or market freezes.
For example:
In 2008, the Fed injected trillions into the banking system to stabilize credit markets.
In 2020, during the COVID-19 pandemic, it implemented emergency lending programs to support businesses, state governments, and households.
Through these actions, the Fed helps prevent the collapse of the financial system and restores market confidence.
4. Providing Financial Services
The Federal Reserve acts as a bank for banks and the U.S. government. It provides various financial services, including:
Clearing and settling interbank payments.
Distributing and maintaining the supply of U.S. currency and coins.
Managing the Treasury’s accounts and issuing government securities.
Operating the Fedwire Funds Service, which handles large-value transfers between banks.
These services form the backbone of the nation’s payment and settlement system, ensuring smooth financial operations.
5. Managing the Nation’s Payment Systems
The Fed plays an essential role in ensuring the safety, efficiency, and accessibility of payment systems in the U.S. It manages systems that process electronic payments, checks, and funds transfers. Additionally, it works with private financial institutions to modernize payment technologies, such as the development of the FedNow instant payment system launched in 2023.
6. Serving as the Fiscal Agent for the U.S. Government
The Federal Reserve assists the U.S. Department of the Treasury in various ways:
Issuing and redeeming Treasury securities.
Processing government payments, such as Social Security and tax refunds.
Managing the federal debt efficiently.
By doing so, the Fed supports the fiscal operations of the government and ensures the smooth execution of public financial activities.
7. Conducting Economic Research and Data Analysis
The Federal Reserve System employs thousands of economists who analyze economic data, study financial trends, and forecast future developments. Their research supports monetary policy decisions and provides valuable insights for the public, academic institutions, and policymakers.
Each of the 12 regional Federal Reserve Banks contributes to this research function, offering a localized perspective on economic conditions across the U.S.
Conclusion
The Federal Reserve stands at the heart of the U.S. and global financial systems. Its objectives—maintaining price stability, achieving maximum employment, and ensuring moderate long-term interest rates—form the foundation of economic stability and prosperity. Through its multifaceted functions, including monetary policy, bank supervision, financial system stability, and payment services, the Fed ensures that the U.S. economy operates smoothly even in the face of domestic and global challenges.
In an increasingly interconnected world, the Federal Reserve’s actions extend beyond American borders, influencing exchange rates, global capital flows, and international economic stability. Its careful balancing of inflation, employment, and growth makes it one of the most significant institutions shaping the global financial landscape.
Objectives of the IMF in Currency StabilizationIntroduction
The International Monetary Fund (IMF) is one of the most influential international financial institutions established to maintain global economic stability. Formed in 1944 at the Bretton Woods Conference and coming into existence in 1945, the IMF’s primary mission was to ensure the stability of the international monetary system — the system of exchange rates and international payments that enables countries to transact with one another. One of the most critical aspects of the IMF’s function is currency stabilization, which involves maintaining orderly exchange rates, preventing competitive devaluations, and ensuring that member countries can sustain balance-of-payments stability.
In an increasingly interconnected global economy, fluctuations in exchange rates can have profound effects on trade, investment, inflation, and growth. Therefore, the IMF plays a vital role in providing both financial assistance and policy guidance to member nations to stabilize their currencies and strengthen their economies. This essay explores the objectives of the IMF in currency stabilization, the mechanisms it employs, and its broader implications for global economic stability.
1. Promoting Exchange Rate Stability
One of the core objectives of the IMF is to promote exchange rate stability. The organization seeks to prevent drastic fluctuations in exchange rates that can disrupt international trade and investment. Exchange rate instability often leads to uncertainty in global markets, discourages foreign investments, and can lead to inflationary pressures.
By promoting stable exchange rates, the IMF aims to:
Encourage predictability in international transactions.
Maintain confidence in global financial markets.
Support economic growth through stable trade relationships.
To achieve this, the IMF monitors exchange rate policies of its member countries, provides guidance on appropriate macroeconomic adjustments, and discourages practices like competitive devaluation — where countries deliberately devalue their currencies to gain an unfair trade advantage. Stability in exchange rates fosters a more predictable environment for both imports and exports, which is essential for long-term economic planning.
2. Maintaining Balance of Payments Stability
A critical function of the IMF in currency stabilization is to help member countries maintain balance-of-payments equilibrium — the condition where a nation’s total international payments and receipts are balanced. Persistent balance-of-payments deficits often lead to currency depreciation, as demand for foreign currency exceeds supply.
The IMF provides financial assistance to member countries facing temporary balance-of-payments crises. This helps them avoid drastic devaluations or restrictive measures such as import controls. By lending short- and medium-term funds, the IMF enables countries to correct underlying imbalances in their external accounts without destabilizing their domestic economies.
For example, during financial crises like those in Latin America (1980s), Asia (1997), and Europe (2010–12), the IMF intervened by providing stabilization programs aimed at restoring confidence and equilibrium in foreign exchange markets.
3. Preventing Competitive Currency Devaluations
One of the key lessons from the Great Depression of the 1930s was the destructive impact of competitive devaluations. During that period, many countries devalued their currencies to make exports cheaper and imports more expensive, in an attempt to gain short-term trade advantages. However, these “beggar-thy-neighbor” policies led to global economic instability and reduced international trade.
To prevent such occurrences, the IMF’s Articles of Agreement require members to avoid manipulating exchange rates to gain unfair competitive advantage. The Fund encourages countries to adopt exchange rate regimes that reflect economic fundamentals and discourages abrupt or unjustified currency movements.
By promoting cooperation among nations and establishing a multilateral system of payments, the IMF ensures that currency policies are used for economic stability rather than as tools of economic warfare.
4. Providing Financial Assistance for Currency Support
When a country’s currency faces downward pressure due to economic shocks, trade imbalances, or capital flight, the IMF provides short-term financial assistance to stabilize it. Such support helps countries rebuild foreign exchange reserves, restore investor confidence, and prevent excessive depreciation.
IMF loans are typically provided under specific arrangements such as the:
Stand-By Arrangements (SBA) — short-term support for temporary balance-of-payments problems.
Extended Fund Facility (EFF) — medium-term assistance for structural reforms.
Flexible Credit Line (FCL) — precautionary support for countries with strong fundamentals but exposed to external shocks.
By offering these facilities, the IMF ensures that member countries can access foreign currency liquidity when needed, thereby preventing currency crises from escalating into broader economic collapses.
5. Promoting International Monetary Cooperation
Currency stability cannot be achieved in isolation; it requires international coordination and cooperation. The IMF acts as a global forum where countries can discuss their monetary and exchange rate policies. Through regular consultations, surveillance, and policy dialogue, the IMF fosters cooperation among its 190+ member nations.
By promoting dialogue and transparency, the IMF helps countries anticipate and manage potential currency risks. This cooperative framework also allows member states to exchange experiences, share policy solutions, and align their monetary strategies to avoid spillover effects from one economy to another.
6. Monitoring Global Exchange Rate Policies
The IMF has an ongoing responsibility to monitor and assess global currency developments. This process, known as IMF surveillance, involves continuous review of member countries’ macroeconomic and exchange rate policies.
Through its Article IV consultations, the IMF evaluates each member’s economic performance, identifies risks, and recommends corrective measures to ensure monetary stability. These assessments are shared publicly, providing transparency and influencing policy decisions worldwide.
Moreover, the IMF’s global monitoring enables it to detect early signs of currency misalignment or potential crises, allowing timely intervention to prevent contagion effects across regions.
7. Facilitating Economic Adjustment Programs
Another objective of the IMF in currency stabilization is to guide countries through economic adjustment programs aimed at correcting structural weaknesses that lead to currency instability. These programs often include fiscal discipline, monetary tightening, trade liberalization, and structural reforms.
While IMF adjustment programs have been criticized for imposing strict austerity measures, their ultimate goal is to restore macroeconomic stability and strengthen the value of domestic currencies. Successful implementation of these reforms improves investor confidence, stabilizes exchange rates, and supports long-term economic growth.
8. Supporting Developing and Emerging Economies
Currency instability is particularly damaging for developing economies, which often rely on imported goods, foreign loans, and external investments. The IMF plays a key role in supporting these nations by offering technical assistance, training, and concessional loans.
Programs such as the Poverty Reduction and Growth Trust (PRGT) provide low-interest loans to low-income countries to stabilize their currencies while promoting sustainable development. The IMF’s involvement also helps these nations build credible monetary institutions and adopt policies that reduce dependence on foreign currencies.
9. Building Confidence in International Payments System
Another important objective of the IMF is to maintain confidence in the international monetary system. By ensuring that countries can meet their external obligations and that exchange rates remain stable, the IMF helps preserve trust in global financial interactions.
This stability encourages international investment and trade, as businesses and investors feel more secure in dealing across borders. A stable international payments system also prevents disruptions in capital flows, which can otherwise lead to severe currency volatility.
10. Promoting Long-Term Global Financial Stability
Ultimately, the IMF’s overarching objective in currency stabilization is to ensure global financial stability. Exchange rate volatility can quickly spread across markets, affecting commodity prices, capital flows, and inflation worldwide.
By supporting sound monetary policies, encouraging transparency, and coordinating global responses to crises, the IMF acts as a stabilizing force in the international financial system. Its interventions have often prevented regional currency crises from developing into global depressions.
Conclusion
The International Monetary Fund serves as a cornerstone of global economic governance. Its objectives in currency stabilization — promoting exchange rate stability, maintaining balance-of-payments equilibrium, providing financial assistance, preventing competitive devaluations, and fostering international cooperation — are essential to ensuring a stable and prosperous world economy.
In a world where financial markets are deeply interconnected, currency stability is not merely a national concern but a global necessity. The IMF, through its policy advice, financial support, and surveillance mechanisms, plays an indispensable role in maintaining this stability. Although its policies sometimes attract debate, the IMF remains the key international institution devoted to safeguarding monetary stability and preventing crises that could endanger the global financial system.
FVG & ORB5-Minute ORB + FVG Day-Trading Playbook (ES/NQ)
What you need
Platform: TradingView for markup; your execution platform (e.g., TopstepX / your broker) for orders.
Chart: ES (S&P 500 futures) or NQ (Nasdaq futures). Timeframe: 5 minutes.
Indicators:
Volume
Fair Value Gap
Key Levels (15-Min/5-Min Opening Range, New York Session or London)
Chicago time (your local): NY cash open is 8:30 a.m. CT. The “US evening reopen” (the Globex reopen) is 5:00 p.m. CT (use with caution; liquidity can be thin).
The strategy in one page
1) Define the Opening Range
Use the first 5-minute bar after the NY cash open (8:30:00–8:34:59 CT).
Mark ORH = that bar’s high, ORL = that bar’s low.
2) Direction filter = FVG
Bearish setup: Price breaks below ORL, and there is a bearish FVG nearby that has not been fully filled.
Bullish setup: Price breaks above ORH, and there is a bullish FVG nearby that has not been fully filled.
If an FVG fills/invalidates immediately after the break, skip the trade.
3) Entry
Enter on the break (or on a tiny retrace back to the level) in the FVG direction:
Below ORL with a short bias when a bearish FVG stands.
Above ORH with a long bias when a bullish FVG stands.
4) Stop & Target (bracket)
Stop: default at the opposite OR level (conservative).
Short below ORL → stop just above ORL (or the nearest invalidation level if tighter is justified).
Long above ORH → stop just below ORH.
Target: aim for 2R (risk:reward = 1:2), close above half, and trail the rest.
Example: If your stop is 10 ES points (=$500 per contract), target 20 ES points (=$1,000 per contract).
5) Risk per trade
Pick a fixed dollar risk that protects your account limits. With a $50k evaluation & ~$2,000 trailing max loss, many traders use $100–$300 per trade and micros (MES/MNQ) to scale precisely.
Contract & tick quick-ref
ES: 1 point = $50 (tick = 0.25, $12.50/tick)
NQ: 1 point = $20 (tick = 0.25, $5/tick)
MES (micro ES): 1 point = $5
MNQ (micro NQ): 1 point = $2
Sizing example, with MES (conservative)
You want a max loss of $200~300.
Signal requires 4 ES points to stop (=$200/contract).
Trade 1 ES or 4 MES (same risk), target 8 ES points for 2R.
Exact checklist (print this)
Pre-market
Chart on 5m, session = New York.
Mark ORH / ORL after the first 5-min bar closes.
Confirm bias by FVG: bullish FVG above / bearish FVG below, still unfilled.
News/Volatility check (FOMC/CPIs/major earnings): be extra cautious or skip.
Entry
Price breaks ORH/ORL in the same direction as the FVG.
No immediate fulfillment of that FVG.
Place bracket: Stop at opposite OR level (or clear invalidation), Target = 2R.
Manage
Set-and-forget if you struggle with tinkering.
If it snaps back and fully fills the FVG, early flattening is allowed by your rules (consistency > perfection).
No averaging losers.
Post-trade
Journal the screenshot, OR values, FVG state, R multiple, and any deviation from the plan.
When to skip
The first break immediately reverses and fully fills the FVG.
The OR is abnormally wide; the stop would exceed your risk budget.
Chop: multiple whipsaws through ORH/ORL within a few bars.
Event risk minutes away (e.g., CPI/FOMC); spreads/volatility unpredictable.
Low volume conditions (late sessions, holidays), unless your data says you have an edge there.
A realistic take on funded accounts & pacing
Evaluations often have daily loss, trailing drawdown, and max position rules. Treat the trailing specifically as if it’s glued to your closed PnL high-water mark—don’t let one impulsive add blow the account.
Keep resets rare by capping loss/day (e.g., 1–2R). One clean 2R win can offset two 1R losses.
Micros let you keep your exact dollar risk steady as the OR width changes day to day.
Routines that help
Two windows: TradingView (markup) and Execution DOM/ladder. Copy ORH/ORL and draw a rectangle for the FVG if your execution platform lacks the indicator.
Auto-brackets: pre-define your $ risk and 2R target so every entry is consistent.
Two sessions max: NY opens first; optionally, the US evening reopens (5:00 p.m. CT) only if your data says you have positive expectancy there.
Trade less, filter more: It’s normal to get 2–3 quality trades/week. No setup → no trade.
A compact rules card (copy/paste)
Timeframe: 5m. Levels: First 5-min bar → ORH/ORL.
Filter: Trade only with an unfilled FVG in the same direction as the OR break.
Entry: Break of ORH (long) or ORL (short).
Invalidation: FVG fully filled right after break → stand down/exit.
Stop: Opposite OR level (or nearest structure that truly invalidates).
Target: 2R.
Risk: Fixed $ per trade; use micros to fit the plan.
Daily max: 1–2R down → stop for the day.
Journal every trade (screenshot + R result + notes).
Journal template (quick)
Date / Ticker / Session (NY/Evening)
ORH / ORL values; OR width (points)
FVG direction & location (filled? unfilled?)
Entry price & rationale (break + FVG alignment)
Stop (points/$), Target (points/$), Size (contracts)
Outcome (R): __
Did I follow the plan? Y/N (what deviated?)
Screenshot link
Guardrails (important)
“Making money in days” is possible but not typical; survivorship bias is real. Your edge is strict filtering + small, repeatable risk + patience.
Commissions/slippage matter—micros help sizing but raise the per-rake cost %; include this in your journaling.
Don’t scale to full contracts until your live track record shows consistency over at least 20–30 trades following the exact rules.
Screener:
www.tradingview.com

The Swing Strategy, I been usingZone‑to‑Zone Trading
1.1 Drawing the Zones
What is a zone?
A price area (not a single line) where the market repeatedly reacts: flips from support→resistance (S/R) or resistance→support (R/S), stalls, or coils.
Priority by timeframe:
Monthly ≥ Weekly ≥ Daily ≥ Hourly. Higher‑timeframe zones carry more weight.
How to mark zones
Start on monthly, and highlight obvious S/R bands.
Drill down to weekly, refine, or add.
Drill down to daily, refine, or add.
Drill down to hourly for tactical entries.
Clues for a quality zone
Prior breakout level that later flips to S/R on retest and consolidates before resolution.
Clear historical reaction clusters (wicks, bodies, or gaps).
Visible “sensitivity” (multiple rejections/holds in the same area).
1.2 Trading the Zones
Entry: Wait for local consolidation near a zone, then take the breakout.
Stops:
Conservative: Below the box low (consolidation floor).
Tight: Mid‑box (accept higher stop‑out rate, better R).
Filter:
Longs only above 50 SMA, shorts only below 50 SMA (trend filter).
1.3 Range vs. Exact Level
Treat zones as bands, not one price tick. I would take the pivot close to the opening of the first red candle if it's a bullish pivot.
At times a single line is acceptable (e.g., clean, repeated close‑basis pivot), but default to ranges.
2) Box System
2.1 Market Phases
Sideways (consolidation) → build energy (boxes form between zones).
Trending → series of HH/HL (up) or LH/LL (down).
2.2 Trend Structure
Trends breathe via consolidation → expansion → consolidation.
Breakouts can:
Go with no retest
Retest the boundary and go
Brief incursion back into box, then full resolve
The first inner zone inside the box is critical: if a new uptrend is valid, the price shouldn’t revisit below it.
Stops: below that first inner zone.
Note: Zone‑to‑Zone shines in non‑trendy markets (FX, many dividend names).
2.3 Types of Boxes
MA roles (fractal):
9 SMA → short‑term momentum
50 SMA → intermediate momentum
21 SMA → the inflection between 9 and 50; often reacts first
2.3.1 Base Box
Both the 9 & 50 SMA flatten for an extended period.
Highest stored energy; breakouts can start major trends.
2.3.2 50 SMA Box
Sideways price, 9 SMA flat, 50 SMA rising/falling into price as dynamic S/R.
Breakout after the 50 SMA reaches the box.
2.3.3 9 SMA Box
Shorter coil (≈ 3–4 candles).
9 SMA catches up; breakout follows.
Shortest consolidation; quicker moves.
2.3.4 9 vs 50 Comparison
9 SMA trend: 2× HH/HL supported by 9. Parabolic (≈20% of cases): each candle’s low should not undercut the prior candle’s low.
9 SMA box: brief sideways until 9 SMA “tags” price → quick reaction.
50 SMA boxes: longer coil; 50 “arrives,” 9 often flat.
Base box: 50 is inside & flat; price crossed above/below multiple times.
2.4 System Objectives Checklist
Trend-following or mean-reversion?
Entry conditions?
Exit logic?
System expectancy?
Risk model?
Entries
Box breakout (bullish): Prefer consolidation at the top‑right of the box before break → higher probability.
Zone‑to‑Zone: Look for a lower‑TF coil at a higher‑TF zone → break of coil for entry.
Profit & Exits
Next zone target; or
Exit when an uptrend fails to make an HL (i.e., breaks prior swing low).
Stops
Box breakout: Below the first inner zone or box low.
Zone‑to‑Zone: Based on the lower‑TF coil used for entry.
Position Size = 4% per trade or less.
2.5 Trading the Boxes
Four box archetypes: 9 SMA, 21 SMA, 50 SMA, and Base.
Base Box
More false starts; longest runs when it goes.
Prefer equity or bull‑put spreads; ride while price > 50 SMA.
50 SMA Box
The first 50‑box after a base is the most reliable.
Daily 50‑box usually follows 3–4 weeks of coil; expect ≈1.5–2 weeks of trend leg.
Tactics: Stock and swing options (expiry ≈ coil length or slightly more).
9 SMA Boxes
Breakout leg ≈2–3 days, then another coil.
Tactics: Scalps with 1–1.5 weeks to expiry; 1–2 OTM strikes.
Quick Summary
Base: most power, least timing precision.
50: first after base = best reliability; second is weaker.
9: short, sharp, tactical.
2.6 Overall Market Environment
If indices trend up above the latest daily zone, 8/10 breakouts can succeed.
If indices chop under the latest daily zone, expect ≈5/10 to work.
Compare QQQ vs. SPY strength to gauge risk‑on/off.
Rules of thumb
Upside bias: Index above the latest daily zone (or proxy 9 SMA if approximating).
Scalping bias: Above the latest hourly zone.
2.7 Box System & Long‑Term Investing (LTI)
Markets are fractal; weekly = daily = hourly in pattern, not speed.
Trend rule: in an uptrend, price should not break prior swing low (mirror for downtrend).
Trailing stop logic
Uptrend: trail to recent swing low once confirmed.
Downtrend: trail to recent swing high.
MA benchmarks:
Hard breaks of 9 SMA → likely consolidation.
50 SMA for longer bias.
Caveat: large‑cap growth rarely trends cleanly down (index dependency & fund flows).
2.8 Watchlist Creation
Three steps
Scan sectors for consolidations (boxes).
Check relative strength vs. SPY (e.g., XLK/SPY).
Review the top 10–20 holdings.
Tiers
A‑List: Box about to break + high options liquidity.
B‑List: Box about to break but low options liquidity.
C‑List: Boxes are still developing.
2.9 Role of the 21 SMA
Acts as the inflection between 9 and 50.
The highest failed‑break probability occurs at 21 boxes.
After a 9‑trend ends, watch 21 for the reaction:
Back to recent highs and breaks, or
Failed break; or
Reject at 9 after 21 reactions.
2.10 SPX Intraday Scalp Pattern
Don’t chase the open; wait 1–2 hours for the market to form an intraday box (2–3 h coil).
Enter as the range breaks: you benefit from direction and rising IV (“double whammy”).
2.11 SQUEEZE Pro Indicator (SQZPRO)
Concept: A squeeze occurs when Bollinger Bands compress inside the Keltner Channels (BB inside KC) → energy building.
Dot codes (suggested):
Green: No squeeze
Black: Mild squeeze (BB within 2 ATR KC)
Red: Tight squeeze (BB within 1.5 ATR KC)
Yellow: Very tight (best odds for expansion)
Heuristic: The tighter the compression, the stronger the potential release.
2.12 Backtesting & Strategy Creation
Use TradingView Replay. Segment by regime (bull, bear, or chop).
Test entries, exits, and risk variants.
Purpose: build statistical confidence to keep your “monkey brain” from hijacking.
2.13 QQQ vs SPY for Intraday
SPY: S&P 500 (market‑cap weighted, broader economy).
QQQ: NASDAQ‑100 ex‑financials (tech‑heavy, risk‑on).
Scenarios
Bullish clean: QQQ > SPY, and both above hourly 9.
Bearish clean: QQQ < SPY, and both below hourly 9.
Chop, green day: Market up but QQQ < SPY → grindy.
Chop, red day: Market down and SPY < QQQ → grindy.
Read strength: Compare % change vs prior close.
2.14 Gaps: What & Why
Markets aren’t 24/7; exogenous events (earnings, geopolitics) reset expectations → open ≠ prior close.
How to trade gaps
Treat the gap range as support (gap‑up) or resistance (gap‑down); draw a gap box.
Unfilled gaps are potent S/R. Above, a bullish gap favors continuation until filled.
If the gap is huge, rely on historic zones to seed new levels within.
2.15 Scalps vs Swings
Scalps: minutes–hours; TF ≤ 1h.
Swings: days–weeks; TF ≥ 1h (prefer daily baseline).
Drill down one TF for refined entries; manage to the anchor TF.
Expiration (rules of thumb)
Stocks (scalps): Mon/Tue → same‑week; Wed/Thu/Fri → next‑week.
Indices (scalps): 1–2 DTE, 1–2 OTM.
Swings: Expiry ≥ consolidation length (often 1–1.5× coil duration).
2.16 Which Timeframe Should You Trade?
Real Trading Hours, 1-2 HR → Day trading & scalps (≤1h TF).
After Hours, 1–2 hr → Swings (≥1 hr, ideally daily).
Less than 1 HR → Multi‑week swings or LTI (weekly charts).