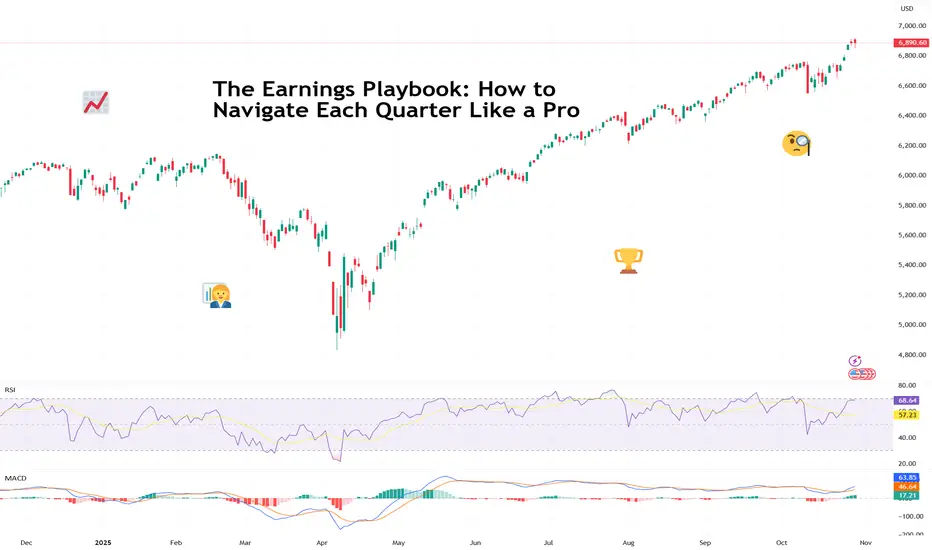
The Earnings Playbook: How to Navigate Each Quarter Like a ProTraders are in the heat of the earnings season and euphoria is sweeping every corner of the market.
The charts twitch, traders stop talking about the Fed for five minutes ( not this week, though ), and online forums turn into a parade of watch-me-trade sessions.
It’s that glorious stretch when companies pop open the books and reveal what’s really been happening behind the scenes.
For professional investors, it’s data heaven. For retail traders, it’s emotional cardio. Stocks can rise 20% on a single upbeat forecast — or plummet before your coffee cools. The trick isn’t just to survive it. It’s to navigate it like a pro.
💼 Know the Seasons (and the Mood Swings)
Earnings season comes four times a year — January, April, July, and October — and each has its own flavor.
Q1 (April): That’s the hangover quarter. Holiday sales meet new-year cost cuts. Traders recalibrate expectations and reality collides with ambition.
Q2 (July): The mid-year checkup. CEOs brag about “momentum,” analysts start sharpening their red pencils. Markets get twitchy.
Q3 (October): The credibility test. Guidance revisions and cautious tones dominate. If the year’s been good, this is where the victory laps start.
Q4 (January): The scoreboard reveal. Everyone tallies their annual wins and losses, and traders begin to bet on who carries the next year’s momentum.
Each cycle has a similar rhythm: hype, reaction, digestion, and speculation. Think of it like a four-act play.
📊 Mind the Gap
One thing to keep in mind whenever you find yourself in the earnings bonanza: the actual numbers matter less than the narrative. ( Looking at you, Oracle NYSE:ORCL )
A company can beat on revenue, miss on profit, and still rally — if the CEO sells a compelling story about the next quarter. Conversely, it can post record earnings and tank because analysts wanted even more.
The pros know to look beyond the headline EPS. They dig into guidance, margins, and segment performance. Is revenue growing because of genuine demand, or just creative accounting? Are margins improving, or did the company quietly cut R&D?
Markets don’t price what’s happened — they price what’s next. That’s especially true for growth stocks like t echnology companies .
🎯 Don’t Chase the Knee-Jerk
Every earnings season has its share of instant overreactions — the “up 10% at open, down 8% by lunch” kind of chaos. That’s when seasoned traders sit back and let volatility do the heavy lifting.
Smart money avoids buying into the frenzy or shorting into despair. Instead, they wait for the second move — when dust settles, algorithms calm down, and humans return to their desks.
🧠 Build Your Own Playbook
To trade earnings season like a pro, you need a plan. Here’s how the veterans prep:
Start early. Check the earnings calendar and mark high-impact names in your portfolio or watchlist.
Study the setup. Look at how the stock’s performed heading into earnings. A big pre-report rally can mean expectations are too high.
Focus on guidance. Earnings beats are old news — future commentary moves markets.
Use position sizing. Never bet the farm on one report. Even the best setups can go sideways.
Don’t forget the macro. Rate cuts, inflation prints, or a stray tweet from the US President can overshadow the best earnings beat.
🕹️ The Big Picture: Earnings as Market GPS
Earnings season is the market’s health check because it tells you which sectors are thriving, which are limping, and how CEOs feel about the future (watch the language: “headwinds” and “volatility” are polite ways of saying buckle up).
Taken together, earnings trends shape the broader narrative — from interest rate expectations to sector rotations. In other words, earnings season is where short-term trading meets long-term investing.
Now go and prepare for the next batch of earnings — Big Tech is on deck this week with Apple NASDAQ:AAPL and Amazon NASDAQ:AMZN reporting today.
Off to you : What’s your strategy this earnings season? Buying the hype or waiting to buy the dip? Share your thoughts in the comments!
Community ideas
Trading Bots: The Future of the Markets?Let’s be real, the idea of a trading bot sounds like the holy grail.
Set it up, go to bed, and wake up to profit.
If only it were that simple.
Most bots don’t fail because of bad code, they fail because of bad logic.
A bot is only as good as the rules you give it.
What a Trading Bot Actually Does
A bot doesn’t predict the market, it reacts to it.
It follows a defined strategy:
Buy when X happens, sell when Y is confirmed, cut losses if price breaks Z.
That’s all.
No fear. No greed. No “maybe I’ll wait for one more candle.”
The power of bots isn’t in magic,it’s in consistency.
They do what most traders can’t: follow the plan exactly as written, every single time.
Why Most Bots Fail
The truth?
Most traders plug in random bots they find online without understanding what’s inside.
They win a few trades, feel invincible… and then lose it all when volatility spikes.
The reason isn’t the bot, it’s the lack of testing and understanding.
If you don’t know your system’s weak spots, you’ll eventually find them the hard way.
That’s why backtesting matters.
Backtesting: Your First Line of Defense
Backtesting shows how your logic performs over hundreds of trades — across bull, bear, and sideways markets.
It reveals your system’s strengths, weaknesses, and drawdowns before you risk a dollar.
A good backtest should tell you:
Your average win rate and risk/reward ratio.
How your system handles volatility.
How often it hits consecutive losses.
Whether your edge actually holds over time.
If your bot looks good in backtests and performs similarly in live conditions — you’re onto something real.
*Example of one of our indicator
How Bots Can Enhance Your Trading
You don’t have to hand everything over to automation.
In fact, many great traders use bots to handle the mechanical side, while keeping the decision-making human.
Here are a few examples:
Trade Execution: Let the bot enter trades instantly after your setup triggers.
Risk Management: Bots can move stop-losses, take partial profits, or scale positions automatically.
Signal Filtering: Use automation to scan hundreds of pairs and alert you only when conditions align.
Backtesting Sandbox: Test new ideas safely with data before deploying them live.
Bots don’t replace traders, they multiply efficiency.
They free your mind from execution so you can focus on refinement.
The Real Lesson
A trading bot isn’t a shortcut.
It’s a mirror, it reflects your discipline, your rules, and your logic.
If your plan is solid, a bot will make it unstoppable.
If your plan is weak, it’ll just lose money faster.
Automation doesn’t fix bad habits, it exposes them.
So learn the logic, test it hard, then let the system do what humans struggle with most: follow the plan.

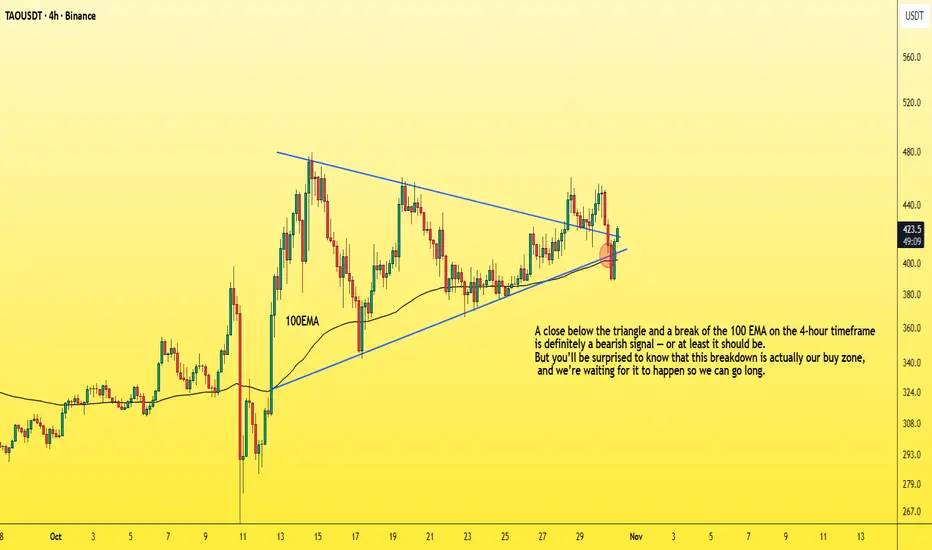
How to enter a successful futures tradeDrop everything and let me show you how to enter a successful long position with the lowest possible risk.
You need to understand that the market maker usually acts against us at major support areas on the chart — like the 100 EMA, 0.618 Fibonacci level, or a trendline.
To make this clearer, let’s take TAO as an example and I’ll explain why.
TAO has strong momentum and a large market cap,
so don’t apply what I’m about to say to meme coins, for example.
Now let’s go step by step on how to enter a futures position after choosing the coin 👇
1. First, wait for a bullish pattern to form — like a triangle — and for the coin to break it upwards with increasing long momentum.
2. The price will then retest the trendline, encouraging people to enter with larger positions, and those who missed the first breakout will likely place buy orders at the retest zone.
3. Then, the market surprises them — it drops back inside the triangle, giving a small bounce at the lower side.
4. But it doesn’t stop there — it continues dropping, breaking below the triangle and closing below the 100 EMA on the 4-hour chart.
This makes you panic and close your long position.
Others start entering shorts thinking it’s a real breakdown.
5. That’s when the market reverses sharply upward,
trapping short traders in losses,
while long traders who exited too early also lose.
In the end, only those who placed buy orders slightly below the strong support level (not directly on it, like under the 100 EMA) — and of course the market maker — end up winning.
So basically, the long traders lose, the short traders lose,
and only a small percentage of smart traders and the market maker win.
Small things to pay attention to 👇
-Your entry point should be slightly below the support, not too far below it.
(That support could be the 100 EMA, below the triangle pattern, or the 0.618 Fibonacci level, as we mentioned.)
-Don’t use high leverage — x5 should be your maximum.
-Place your stop loss 5% below your entry zone,
which equals about 25% loss if you’re using x5 leverage.
And with that, you’ve got yourself a long setup with over a 90% success rate,
and you can apply the same logic in reverse when taking a short position.
Best Regards:
Ceciliones🎯
Halloween Special: The Risk “Treats” That Keep You Alive!🧠 If October has a lesson, it’s this: fear is useful, panic is fatal. Great traders don’t fight the monsters; they contain them.
Here’s my Halloween mindset & risk playbook:
🧪 Keep your “lifeline” small: Risk a fixed 1% per trade until your balance moves ±10%, then recalibrate. This makes loss streaks survivable and hot streaks meaningful.
⏰ Set a nightly curfew: a max daily loss (e.g., 3R or 3%). Hit it? Close the platform. No “one last trade.” Curfews save accounts.
🛑 Define your invalidation before you enter: If that level prints, you’re out, no arguments, no “maybe it comes back.” Plans beat feelings.
🎯 Hunt asymmetry: If you can’t see at least 2R cleanly (preferably 3R), pass. You don’t need more trades; you need better trades.
🧟 Kill the zombie trade: the one you’re babysitting, nudging stops, praying. If you’re managing hope more than risk, exit and reset.
🧘 Protect your mind equity: Two back-to-back losses? Take a 20-minute break. After a big win? Journal before you click again. Calmness compounds.
📜 Make a ritual: pre-trade checklist → position size → entry → stop → targets → log. Rituals turn uncertainty into routine, and routine into consistency.
What’s your #1 rule that keeps the “revenge-trading demon” out of your account❓
⚠️ Disclaimer: This is not financial advice. Always do your own research and manage risk properly.
📚 Stick to your trading plan regarding entries, risk, and management.
Good luck!
All Strategies Are Good; If Managed Properly!
~Richard Nasr

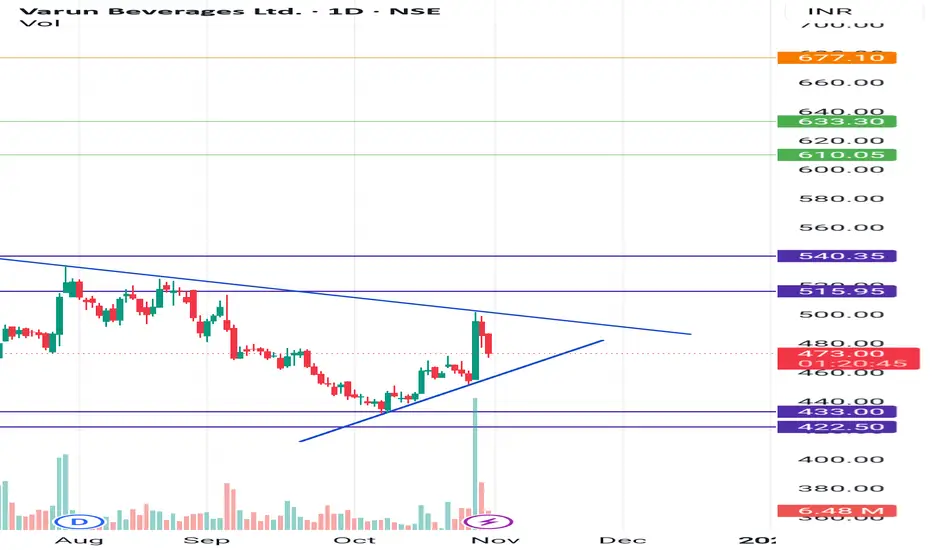
VBL Vbl is breaks this trend line , target is high ,
Quarterly results, yearly result increasing, revenue,PAT increasing, new partnership with carlsberg in south africa , p a potential multibagger
The Billy Big Balls MomentA trader reached out to me by direct message here on Trading View highlighting a challenge that many of us face from time to time. We’re talking about self sabotage. That moment you know what to do - but do something entirely different and get a result that frustrates the **** out of you.
Follow along, I hope this helps.
BUT FIRST
NOTE – This is a post on mindset and emotion. It’s not a trade idea or strategy designed to make you money. My intention is to help you preserve your capital, focus, and composure so you can trade your own system with calm and confidence.
Here's a scenario you might be familiar with...
You nail a sequence of trades.
Precision. Flow. Everything lines up.
And then something flips.
You start pushing harder, sizing up, breaking your own rules.
A few minutes later, you’re staring at a screen wondering,
“What the hell just happened?”
It’s not lack of discipline nor is it a technical problem.
You have an emotional pattern that hasn’t been mapped out yet.
This pattern has roots into your subconscious and it’s sabotaging your efforts.
WHATS REALLY HAPPENING AND WHERE DOES THE DRIVER REALLY COME FROM
When you start winning, your brain gets flooded with dopamine , the chemical of reward and anticipation.
If your nervous system has ever learned that success leads to loss, losing control, losing safety, losing connection it quietly associates “winning” with risk .
The mind says, “Let’s keep this going.” Deeper down though is the silent warning … “This isn’t safe.”
Doesn’t sound logical right? It’s not. It’s emotional. Deeply embedded in your psyche and activated whenever the mind feels that familiar feeling again.
The mind wants to go forward - the body wants to intervene. And so you get an internal split. A moment of pressure that your mind just has to resolve. And the fastest way the subconscious knows to relieve that pressure… is to end the win.
So you do something impulsive, not because you want to fail,
but because deep down, you're trying to protect yourself or believe or not, you might be even trying to punish yourself.
Weird stuff happens in the subconscious.
That’s why the sabotage happens right after a run of success.
It’s not logic breaking down.
It’s the mind trying to restore an emotional equilibrium.
HOW TO CATCH IT BEFORE IT HAPPENS
Listen. The moment you size up impulsively is not random.
It’s a repeatable signal that your emotional system has been triggered.
You can’t fix what you can’t see - so start tracking it.
1. Notice your signature cue.
For some, it’s tension in the chest or a fidgety feeling of restlessness.
For others, it’s the need to “just check one more chart.”
For you it might be something else. Pay attention and start to become aware of what comes up for you.
2. Map the pattern
Keep a short log : what happens right before you go rogue?
Notice the time of day, physical tension, thoughts.
You are looking for a repeatable sequence.
3. Identify your threshold
There’s always a tipping point where clarity narrows: your breath shortens, attention tunnels or you start fantasising about bigger gains.
That’s your signal.
4. Interrupt the pattern and create a recovery plan (as you notice the cues)
Physically step away from the desk.
Exhale through the mouth long, slow, 6 seconds.
Let your eyes rest on something still . This shifts the nervous system out of fight-or-flight and back into focus.
This isn’t about controlling emotion.
Its about expanding your capacity so emotion doesn't control you.
Next time you’re on a hot streak, notice where focus ends and thrill begins.
That’s the edge that makes or breaks the run.

Why Your Next Trade Means Nothing
🧠 The Notebook Process #2 — Understanding the True Nature of Trading.
Some laws govern everything we do, and trading is no exception, even if it often feels like pure chaos.
Every tick looks random. Every trade feels unique. Yet beneath that noise, a hidden law quietly shapes your results. It’s one of the cornerstones of statistics, and it rules every trading account on Earth: The Central Limit Theorem.
Don’t worry, no math coming your way: just an intuitive truth you can plug directly into your trading mindset.
📖 The Nature of Trading.
Your true profitability, your average win or loss, only begins to emerge and, more importantly, stabilize after a large number of trades.
That’s it. That’s the law.
A single trade? Meaningless. Ten trades? Still noise.
Hundreds of trades? That’s where the truth starts to show. What you see after enough repetitions isn’t randomness anymore: it’s your edge revealing itself.
That’s the Law of Large Numbers and the Central Limit Theorem in motion: pure science.
☑️ What This Means for Traders.
Your system’s real strength, its expectancy, only appears through repetition.
A handful of trades? Still luck. Pure variance, random ups and downs that mean nothing.
A few hundred? Now you’re seeing skill: the signal rising above the noise. In plain English:
“A trading journey can only be evaluated after a large number of trades. That’s why your process matters more than your last result, no matter how good or bad it looked.”
And that’s exactly what The Notebook Process #1 was about: 👉 Evaluate in blocks, not single trades.
💸 Let’s Put the Law to Work:
1️⃣ Take your trading record and compute: Average win, Average loss, and Win rate.
2️⃣ Calculate your expectancy using this simple formula:
(Avg Win × Win Rate) – (Avg Loss × (1 – Win Rate))
3️⃣ That number tells you how much you make (or lose) per trade on average, and more importantly, what you can expect to make in the future.
If it’s positive, you’re trading with an edge. Keep going: reproducibility is what makes it stable.
If it’s negative, stop immediately. The bleeding won’t stop until the math changes.
That’s it. Pure math applied to trading: and believe me, you don’t want to fight this law.
🌍 The Gravity of Trading.
The difference between a trader who understands and one who only tries isn’t talent, it’s focus.
Focus on expectancy, not the win rate, not the reward to risk ratio.
It might seem basic, but so is gravity, and like gravity, it governs you whether you believe in it or not.

Fair Value Gaps: The Market Secret You Shouldn’t IgnoreEver scrolled through a chart and spotted a weird empty space in the candles — like the market just skipped a beat? That’s a Fair Value Gap (FVG). It’s one of those subtle price imbalances smart traders love to hunt for. Understanding how these gaps form and how price reacts around them can seriously level up your chart-reading game.
What Is a Fair Value Gap in Trading?
A Fair Value Gap happens when there’s a sudden surge in buying or selling pressure that causes price to move so fast, it doesn’t fully balance out between buyers and sellers. In simple terms, it’s an imbalance — a zone where the market skipped over potential orders.
When you hear traders talking about FVG in trading, they’re referring to those little pockets of unfilled liquidity left behind during strong moves.
So, what is FVG in trading, and why does it matter? Because price often comes back to those areas later to “rebalance” — filling the gap before continuing in the original direction. That’s the core logic behind Fair Value Gap trading.
Bullish and Bearish FVGs
There are two main types of Fair Value Gaps — bullish and bearish:
Bullish Fair Value Gap (bullish FVG): Forms during a strong upward move, when aggressive buyers push price higher, leaving a void below. Price might later dip back into that zone before continuing upward.
Bearish Fair Value Gap (bearish FVG): Forms in a sell-off, when sellers dominate and the market drops quickly, skipping over potential buy orders. Later, price often retraces upward to “fill” that gap.
Both can act as magnets for liquidity — areas where smart money likes to re-enter the market.
Fair Value Gap Example
Let’s say Bitcoin jumps from $110,000 to $120,000 in a single bullish candle, with almost no trading in between. That sudden move leaves a Fair Value Gap — the zone between the candle’s high and low where little to no trading took place.
If the market later pulls back to that range and finds support before bouncing, you’ve just witnessed a textbook Fair Value Gap example in action.
Using a Fair Value Gap Indicator
You can spot these zones manually by looking for three-candle structures — one candle that “leaves the gap” and two surrounding it that don’t overlap. But if you prefer automation, you can use a Fair Value Gap indicators:
Fair Value Gap Trading Strategies
Fair Value Gap trading isn’t about chasing price — it’s about waiting for the market to come back to you. Within Smart Money Concepts, traders often combine FVGs with CHoCH (Change of Character) to confirm a potential shift in structure before entering.
A common approach is to mark recent FVGs, identify the broader trend, and wait for price to revisit a gap in line with that trend.
In a bullish trend , traders look for bullish FVGs below current price as potential demand zones — ideally after a CHoCH confirms that buyers are stepping back in.
In a bearish trend , they watch for bearish FVGs above current price as potential supply zones, again validated by a CHoCH showing a shift in control.
Still, it’s important to remember — these setups are not guarantees. The market doesn’t owe you a fill. Use FVGs and CHoCH as part of the Smart Money framework, not as standalone signals. Always manage risk and make your own trading decisions based on your personal strategy and comfort level.
Final Thoughts
So, what is a Fair Value Gap really? It’s not magic — just the market showing where it moved too fast. Learning to read Fair Value Gaps gives you insight into liquidity, momentum, and potential reversals. Whether you use a Fair Value Gap indicator or mark them by hand, mastering FVG in trading can give you a serious edge in spotting high-probability zones.
Just keep in mind — no indicator or setup replaces good judgment.
Observe, adapt, and let the charts speak for themselves.

Fed Overview: The Good and the Not So GoodDriven by an euphoric phase, the S&P 500 has approached 7,000 points, nearing its 2000 valuation record, with six consecutive months of gains without retracement.
The key question for investors is now clear: has the Federal Reserve provided enough justification for this confidence, or does Jerome Powell’s caution mark the beginning of the end of this euphoric phase?
1) A Fed slowing the pace without complacency
On Wednesday, October 29, the Fed announced another 25-basis-point rate cut, bringing the federal funds rate into the 3.75%–4.00% range. This is the second consecutive reduction, aimed at countering the labor market slowdown.
However, the FOMC vote revealed strong internal divisions: one member wanted a deeper cut, another preferred no change. This reflects the delicate balance between supporting employment and avoiding renewed inflationary pressure.
Another key signal: the Fed decided to pause its balance sheet reduction (quantitative tightening) starting December 1st, in order to preserve financial system liquidity, as credit markets show early signs of stress. Powell clarified that this pause does not imply a lasting return to an expansionary stance.
Finally, Powell cooled expectations for another rate cut in December, stating that “nothing is guaranteed.” Money markets now price roughly a 70% chance of a hold in December, down from nearly 90% odds of a cut before the meeting.
2) Between monetary realism and market excess
The Fed is not ruling out further easing, but it refuses to fuel a bullish rally in the S&P 500 that is now considered excessive relative to fundamentals.
Current valuations rely heavily on expectations of continued rate cuts. If that narrative weakens, the likelihood of a technical correction in the S&P 500 rises.
At this stage, however, the index has not yet signaled a reversal.
DISCLAIMER:
This content is intended for individuals who are familiar with financial markets and instruments and is for information purposes only. The presented idea (including market commentary, market data and observations) is not a work product of any research department of Swissquote or its affiliates. This material is intended to highlight market action and does not constitute investment, legal or tax advice. If you are a retail investor or lack experience in trading complex financial products, it is advisable to seek professional advice from licensed advisor before making any financial decisions.
This content is not intended to manipulate the market or encourage any specific financial behavior.
Swissquote makes no representation or warranty as to the quality, completeness, accuracy, comprehensiveness or non-infringement of such content. The views expressed are those of the consultant and are provided for educational purposes only. Any information provided relating to a product or market should not be construed as recommending an investment strategy or transaction. Past performance is not a guarantee of future results.
Swissquote and its employees and representatives shall in no event be held liable for any damages or losses arising directly or indirectly from decisions made on the basis of this content.
The use of any third-party brands or trademarks is for information only and does not imply endorsement by Swissquote, or that the trademark owner has authorised Swissquote to promote its products or services.
Swissquote is the marketing brand for the activities of Swissquote Bank Ltd (Switzerland) regulated by FINMA, Swissquote Capital Markets Limited regulated by CySEC (Cyprus), Swissquote Bank Europe SA (Luxembourg) regulated by the CSSF, Swissquote Ltd (UK) regulated by the FCA, Swissquote Financial Services (Malta) Ltd regulated by the Malta Financial Services Authority, Swissquote MEA Ltd. (UAE) regulated by the Dubai Financial Services Authority, Swissquote Pte Ltd (Singapore) regulated by the Monetary Authority of Singapore, Swissquote Asia Limited (Hong Kong) licensed by the Hong Kong Securities and Futures Commission (SFC) and Swissquote South Africa (Pty) Ltd supervised by the FSCA.
Products and services of Swissquote are only intended for those permitted to receive them under local law.
All investments carry a degree of risk. The risk of loss in trading or holding financial instruments can be substantial. The value of financial instruments, including but not limited to stocks, bonds, cryptocurrencies, and other assets, can fluctuate both upwards and downwards. There is a significant risk of financial loss when buying, selling, holding, staking, or investing in these instruments. SQBE makes no recommendations regarding any specific investment, transaction, or the use of any particular investment strategy.
CFDs are complex instruments and come with a high risk of losing money rapidly due to leverage. The vast majority of retail client accounts suffer capital losses when trading in CFDs. You should consider whether you understand how CFDs work and whether you can afford to take the high risk of losing your money.
Digital Assets are unregulated in most countries and consumer protection rules may not apply. As highly volatile speculative investments, Digital Assets are not suitable for investors without a high-risk tolerance. Make sure you understand each Digital Asset before you trade.
Cryptocurrencies are not considered legal tender in some jurisdictions and are subject to regulatory uncertainties.
The use of Internet-based systems can involve high risks, including, but not limited to, fraud, cyber-attacks, network and communication failures, as well as identity theft and phishing attacks related to crypto-assets.
Origins of Modern Trade Wars in the World MarketIntroduction
The term trade war refers to an economic conflict between nations characterized by the imposition of tariffs or other trade barriers against each other. In essence, it is a battle for economic dominance fought through policy, not arms. While trade wars have existed since the rise of mercantilism in the 16th century, the modern trade war is a more complex phenomenon, deeply rooted in globalization, technological advancement, and national security concerns.
In today’s interconnected world, trade wars affect not just the warring nations but also global supply chains, financial markets, and consumer prices. The origins of modern trade wars can be traced to a combination of historical protectionism, geopolitical rivalry, and the changing structure of the global economy. This essay explores the evolution of trade wars, their causes, major examples, and the underlying forces shaping them in the 21st century.
Historical Background: From Protectionism to Globalization
Trade conflicts have long been tools of economic strategy. In the early centuries of global commerce, nations viewed trade surpluses as a measure of power. The 17th and 18th centuries saw the rise of mercantilism, where colonial powers such as Britain, France, and Spain imposed trade barriers to protect their domestic industries and accumulate wealth.
In the 19th century, industrial revolutions and colonial expansion spread free trade ideas, most notably through the British-led global trade system. However, the Great Depression of the 1930s reversed this progress. The U.S. Smoot-Hawley Tariff Act (1930), which raised tariffs on thousands of goods, triggered a global retaliatory cycle, deepening the depression.
After World War II, world leaders sought to prevent such destructive economic nationalism. They created institutions like the General Agreement on Tariffs and Trade (GATT) in 1947, which later evolved into the World Trade Organization (WTO) in 1995. These institutions aimed to promote global trade liberalization, reducing tariffs and establishing dispute resolution mechanisms.
Yet, even as globalization accelerated, protectionist instincts never disappeared. By the early 21st century, trade wars had transformed from simple tariff conflicts into strategic economic weapons, targeting technology, security, and intellectual property.
The Rise of the Modern Trade War
Modern trade wars differ from historical ones in both scale and motivation. They are not merely about tariffs or market access — they reflect deeper struggles over technological supremacy, economic sovereignty, and geopolitical power.
The post-Cold War world initially saw unprecedented economic cooperation. The 1990s and early 2000s were marked by open markets, rapid global trade growth, and the rise of multinational corporations. Countries like China and India emerged as manufacturing powerhouses, while the U.S. and Europe focused on innovation and services.
However, the same globalization that integrated economies also created vulnerabilities. Wealth inequality widened, industrial jobs in developed economies disappeared, and dependency on foreign supply chains increased. These developments laid the groundwork for nationalist economic movements and the resurgence of trade conflicts.
Key Triggers of Modern Trade Wars
1. Globalization’s Backlash
Globalization, once hailed as a force for prosperity, became politically controversial. Many Western workers felt displaced by cheaper imports and outsourcing. Factories in the U.S. and Europe shut down as companies moved production to low-cost countries like China and Vietnam. This economic discontent fueled protectionist policies, with leaders promising to “bring back jobs” and “protect national industries.”
2. The U.S.–China Rivalry
No relationship defines the modern trade war era more than the rivalry between the United States and China. For decades, the U.S. supported China’s integration into the world economy, hoping economic liberalization would lead to political openness. However, as China’s technological and military strength grew, Washington began viewing Beijing as a strategic competitor.
In 2018, under President Donald Trump, the U.S. imposed tariffs on over $360 billion worth of Chinese goods, accusing China of unfair trade practices, currency manipulation, and intellectual property theft. China retaliated with tariffs on American products like soybeans, automobiles, and chemicals. The conflict disrupted global supply chains and forced multinational companies to rethink their dependence on China.
The U.S.–China trade war marked a turning point: trade policy was now a tool of geopolitical containment rather than mere economic correction.
3. Technology and National Security
Another defining feature of modern trade wars is the fusion of technology with national security concerns. Nations increasingly view technology — particularly in areas like semiconductors, 5G, and artificial intelligence — as strategic assets.
For instance, the U.S. imposed sanctions on Huawei, China’s leading telecom firm, citing espionage risks. It also restricted semiconductor exports to China, aiming to curb its access to advanced chips. In response, China accelerated its “Made in China 2025” policy, seeking self-sufficiency in high-tech sectors.
This represents a shift from tariffs to tech-based trade restrictions, signaling that modern trade wars are as much about digital dominance as about trade balances.
4. Supply Chain Security and Reshoring
The COVID-19 pandemic and subsequent global disruptions exposed how dependent nations had become on foreign suppliers. Shortages of essential goods, from medical equipment to microchips, triggered a wave of economic nationalism. Countries began promoting reshoring (bringing production home) and friend-shoring (trading with allies instead of rivals).
This policy direction — seen in the U.S. CHIPS Act and India’s Production-Linked Incentive (PLI) schemes — reflects the idea that economic independence is a form of security, even if it reduces efficiency.
5. Energy and Resource Control
Energy politics also play a major role in modern trade wars. The Russia–Ukraine conflict (2022) led to Western sanctions against Moscow, which retaliated by cutting energy supplies to Europe. This sparked global price surges in oil, gas, and food commodities, proving that trade and geopolitics are inseparable.
Resource nationalism — countries restricting exports of vital minerals like lithium, rare earths, or fertilizers — has become another front in trade conflicts, particularly as nations race to secure green energy resources.
Major Examples of Modern Trade Wars
1. U.S.–China Trade War (2018–Present)
This remains the most significant trade conflict of the 21st century. It began with tariffs but expanded into technology bans, export controls, and investment restrictions. While both nations signed a Phase One Trade Agreement in 2020, tensions persist, especially in technology and defense sectors. The conflict has reshaped global trade flows, encouraging companies to diversify production to countries like Vietnam, India, and Mexico.
2. U.S.–European Union Disputes
Though allies, the U.S. and EU have engaged in repeated trade disputes — from Boeing vs. Airbus subsidies to digital taxes on U.S. tech giants like Google and Apple. Tariffs on steel, aluminum, and agricultural goods have also flared intermittently, reflecting underlying competition for global industrial leadership.
3. Japan–South Korea Trade Restrictions (2019)
In Asia, Japan and South Korea clashed when Japan restricted exports of key materials used in semiconductors, citing national security. The dispute was partly rooted in historical grievances but had serious consequences for tech industries worldwide.
4. Russia and Western Sanctions
Following the annexation of Crimea in 2014 and the 2022 invasion of Ukraine, Western countries imposed unprecedented economic sanctions on Russia. Moscow retaliated by banning exports and redirecting trade to Asia. This confrontation effectively created a bifurcated global trading system, dividing economies along political lines.
Economic and Market Impacts
Modern trade wars have profound consequences for the world economy:
Rising Costs and Inflation:
Tariffs increase the cost of imported goods, leading to inflation. Consumers ultimately bear the burden through higher prices.
Disrupted Supply Chains:
Global manufacturing relies on integrated networks. Trade barriers force companies to relocate or diversify production, often at higher costs.
Market Volatility:
Stock markets react sharply to trade tensions. For example, during the 2018–2019 U.S.–China dispute, global equities saw major sell-offs amid uncertainty.
Shifting Investment Patterns:
Countries like India, Vietnam, and Mexico have gained foreign investment as companies seek alternatives to China, illustrating the realignment of global supply chains.
Reduced Global Growth:
The International Monetary Fund (IMF) estimates that prolonged trade wars could shave off 0.5–1% of global GDP, dampening investment and productivity.
Geopolitical Dimensions
Trade wars are increasingly intertwined with geopolitical rivalries. Economic measures have replaced traditional warfare as a tool of statecraft. Sanctions, export bans, and tariffs are now used to coerce adversaries or reward allies.
For example, the U.S. uses trade policy to contain China, while China leverages its dominance in rare earth minerals to influence global industries. Similarly, Europe’s green transition policies also carry a strategic dimension — reducing dependence on Russian energy and Chinese solar components.
The emergence of trade blocs like BRICS, ASEAN, and the Indo-Pacific Economic Framework reflects nations’ attempts to secure regional economic influence in a multipolar world.
The Role of the WTO and Global Governance
The World Trade Organization (WTO), once the central arbiter of global trade disputes, has struggled to keep pace with modern challenges. Its mechanisms are slow, and its rules were designed for a different era — one dominated by goods, not digital or technology trade.
The paralysis of the WTO’s Appellate Body since 2019 has allowed nations to act unilaterally, bypassing multilateral dispute resolution. This vacuum has emboldened major economies to engage in aggressive trade policies without fear of meaningful retaliation through international law.
The Future of Global Trade Relations
Looking ahead, trade wars are unlikely to disappear — they are evolving. The new era of “geo-economic competition” will revolve around:
Technology control: Chip manufacturing, AI, and green tech will be the new battlegrounds.
Economic security: Nations will prioritize resilience over efficiency.
Regional trade networks: Supply chains will become more localized and politically aligned.
Digital trade rules: The next frontier of regulation will involve data sovereignty and cyber-exports.
While globalization will not end, it is shifting toward fragmented globalization, where countries trade selectively based on security and political alignment.
Conclusion
The origins of modern trade wars lie in a complex interplay of history, politics, and economics. What began as a quest to protect domestic industries has evolved into a multidimensional struggle for technological dominance, national security, and geopolitical power.
In today’s world, trade wars are not just about tariffs or deficits — they are about who controls the future of global innovation, energy, and information. The challenge for policymakers is to balance national interests with global stability, ensuring that competition does not destroy cooperation.
Ultimately, while trade wars may bring short-term political victories, history shows that economic nationalism rarely produces lasting prosperity. True progress will depend on rebuilding trust, reforming global trade institutions, and recognizing that in a deeply interconnected world, economic conflict anywhere can trigger consequences everywhere.

The Pillars of Global Trade Dynamics1. The Economic Foundation: Supply, Demand, and Comparative Advantage
At the heart of global trade lies the principle of comparative advantage, introduced by David Ricardo in the early 19th century. This concept explains why nations trade — even when one nation can produce everything more efficiently than another. Instead of self-sufficiency, countries specialize in producing goods where they have a lower opportunity cost, leading to mutual benefit through exchange.
For example, if India focuses on software services and textiles while importing advanced machinery from Germany, both countries benefit from efficiency and specialization. This principle underpins global trade structures and ensures that resources — from labor to capital — are utilized optimally.
Global supply and demand dynamics also play a critical role. When consumer preferences shift or production costs change, global trade adjusts rapidly. The pandemic, for instance, disrupted both supply chains and demand patterns, forcing the world to reconsider its dependence on certain countries and industries. Similarly, rising middle-class consumption in Asia has altered global demand, turning countries like India, China, and Indonesia into consumption powerhouses.
Economic interdependence has deepened as well. A smartphone assembled in China, using components from South Korea, software from the United States, and raw materials from Africa, showcases how global production networks interlink economies. This interdependence creates efficiencies but also vulnerabilities, as seen during trade disruptions, geopolitical tensions, or shipping crises.
2. Policy and Governance: The Regulatory Pillars of Trade
Trade doesn’t occur in a vacuum; it is guided and regulated by policies, agreements, and global institutions. The World Trade Organization (WTO), International Monetary Fund (IMF), and World Bank form the triad of international governance that promotes free and fair trade.
These institutions were established after World War II to prevent the economic nationalism that contributed to the Great Depression and global conflict. The WTO, for instance, provides a platform to settle disputes and negotiate trade liberalization, ensuring countries abide by agreed-upon rules.
However, in the 21st century, trade policy has become a strategic weapon. Tariffs, sanctions, and subsidies are now tools of economic diplomacy. Trade wars, such as the U.S.–China conflict, illustrate how policy decisions ripple across the global economy — raising costs, shifting supply chains, and altering investment flows.
Moreover, regional trade agreements (RTAs) such as the European Union (EU), North American Free Trade Agreement (now USMCA), and the Regional Comprehensive Economic Partnership (RCEP) have reshaped trade patterns. These blocs promote intra-regional cooperation and reduce barriers, allowing countries to integrate economically and enhance competitiveness.
In contrast, protectionist policies — often driven by domestic political pressures — can distort markets and fragment global trade. The balance between globalization and protectionism remains one of the defining policy challenges of our era.
3. Technological Advancement: The Catalyst of Modern Trade
Technology has revolutionized every facet of global trade — from production and logistics to finance and communication. The digital revolution, automation, and artificial intelligence (AI) have made trade faster, more efficient, and more data-driven.
In logistics, innovations like real-time tracking, blockchain-based shipping records, and automated ports have streamlined global supply chains. The containerization revolution in the mid-20th century was one of the earliest technological breakthroughs that drastically cut transport costs and boosted trade volumes.
In manufacturing, technologies such as robotics, 3D printing, and Internet of Things (IoT) are reshaping the global distribution of production. Countries with advanced infrastructure and technological expertise now dominate high-value segments of the global value chain, while developing economies specialize in labor-intensive manufacturing.
Furthermore, the digital economy has expanded trade beyond physical goods. Digital services — from cloud computing and fintech to online education — are now significant components of international commerce. A freelancer in the Philippines, a software firm in India, and a design studio in the U.S. can collaborate seamlessly in real time, thanks to digital trade platforms.
However, this technological leap also brings challenges. Automation threatens traditional manufacturing jobs in developing nations, while data localization laws and digital protectionism create new trade barriers. As the world moves toward digital globalization, ensuring inclusive access and digital equity becomes a new trade priority.
4. Financial and Monetary Systems: The Flow of Global Capital
Trade cannot function without finance. The global financial system — encompassing currency exchange, cross-border payments, and investment flows — acts as the bloodstream of trade. The U.S. dollar, long the dominant reserve currency, facilitates most international transactions, while central banks and financial institutions provide the credit and liquidity necessary for trade expansion.
Trade finance — letters of credit, guarantees, and export financing — ensures that exporters get paid and importers receive goods. The stability of global finance directly impacts trade volumes. For instance, during the 2008 global financial crisis, liquidity dried up, leading to a sharp contraction in global trade.
Exchange rate fluctuations also affect trade competitiveness. A weaker currency makes exports cheaper and imports costlier, influencing trade balances. Hence, countries often intervene in foreign exchange markets to maintain favorable trade positions — a practice sometimes criticized as “currency manipulation.”
Additionally, capital mobility — the ability of investors to move funds across borders — has made financial markets more intertwined with trade. Foreign direct investment (FDI) fuels industrial growth, infrastructure, and technology transfer, while portfolio investments reflect global confidence in economies.
As digital currencies and blockchain-based payment systems evolve, the future of global trade finance may shift toward decentralization. Central Bank Digital Currencies (CBDCs) could make international payments faster and cheaper, redefining the global monetary order.
5. Infrastructure and Logistics: The Physical Backbone of Trade
Trade relies heavily on physical connectivity — ports, roads, railways, and airports form the arteries of global commerce. Efficient infrastructure determines how fast and cost-effectively goods move from producers to consumers.
Maritime transport carries around 80–90% of world trade by volume. Hence, modern ports like Shanghai, Singapore, and Rotterdam serve as critical global trade hubs. The expansion of the Panama and Suez Canals, along with new infrastructure projects like China’s Belt and Road Initiative (BRI), reflects the growing emphasis on connectivity.
Poor infrastructure, on the other hand, remains a major bottleneck in developing countries. Delays, congestion, and high logistics costs reduce competitiveness and deter investment. Therefore, trade infrastructure investment is not just an economic necessity — it’s a strategic imperative for sustainable development.
The logistics revolution has also introduced new efficiencies. Just-in-time (JIT) inventory systems, global freight management software, and last-mile delivery innovations have minimized waste and improved responsiveness. Yet, as the pandemic revealed, these lean systems can also be fragile when global shocks occur.
6. Geopolitical and Social Factors: The Human Dimension of Trade
Global trade is deeply intertwined with geopolitics. Trade routes, resource control, and economic influence are often used as instruments of national power. Countries form alliances or impose sanctions based on strategic interests, shaping the flow of trade and investment.
The rise of geoeconomics — where economic tools are used for geopolitical aims — marks a major shift. Energy trade, for instance, has been a central element in international relations, with oil-producing nations wielding significant influence. Similarly, rare earth minerals — vital for electronics and renewable technologies — have become a new front in global trade rivalries.
Social factors are equally important. Labor standards, human rights, and environmental sustainability now shape consumer choices and corporate strategies. The ESG (Environmental, Social, and Governance) movement has pushed multinational corporations to adopt responsible sourcing and ethical production practices.
Moreover, trade influences societies by transforming employment patterns, income distribution, and cultural exchange. While globalization has lifted millions out of poverty, it has also widened inequalities in some regions. Thus, social equity and inclusivity have become essential considerations in modern trade policy.
7. Sustainability and the Green Trade Transition
The future of global trade depends on its ability to align with sustainability. As climate change intensifies, nations and businesses are rethinking supply chains, energy sources, and production methods. The concept of “green trade” emphasizes reducing carbon footprints, promoting renewable energy, and developing circular economies.
Green policies — such as the European Union’s Carbon Border Adjustment Mechanism (CBAM) — are reshaping trade norms. Exporters to such markets now face carbon pricing, pushing industries to adopt cleaner technologies. Similarly, green finance and ESG-focused investments are channeling capital toward sustainable trade infrastructure.
Sustainability is no longer an optional pillar but a central force defining competitiveness and resilience in global trade.
Conclusion: Interconnected Pillars for a Shared Future
The pillars of global trade dynamics — economic principles, policy frameworks, technology, finance, infrastructure, geopolitics, and sustainability — together uphold the vast structure of global commerce. Each pillar is interdependent, reinforcing and influencing the others.
The coming decades will witness a reconfiguration of trade networks — driven by technological innovation, climate imperatives, and shifting geopolitical alignments. The challenge lies in ensuring that trade remains inclusive, sustainable, and equitable — balancing efficiency with resilience, and growth with environmental stewardship.
Ultimately, global trade is more than an economic process; it is a reflection of human collaboration and interdependence. As nations navigate the complexities of the 21st century, strengthening these foundational pillars will determine not just the direction of commerce, but the shared prosperity of the global community.
How Currency Valuations Impact Exporters and ImportersIntroduction
Currency valuation is one of the most powerful forces shaping global trade dynamics. Every day, trillions of dollars’ worth of goods, services, and investments cross borders, and the exchange rates between currencies determine how much value each participant gains or loses. A small shift in the rupee, dollar, euro, or yen can have a massive impact on exporters’ earnings, importers’ costs, and even a country’s overall trade balance.
For exporters and importers, understanding currency valuation is not just a financial technicality — it is a survival strategy. Whether a company sells machinery to Europe, imports raw materials from China, or outsources services to the U.S., fluctuations in exchange rates directly affect profitability, competitiveness, and strategic planning.
This essay explores how currency valuations influence exporters and importers, the mechanisms behind exchange rate movements, their implications on pricing, profitability, and policy decisions, and how businesses can manage the risks associated with currency fluctuations.
Understanding Currency Valuation
Currency valuation refers to the market-determined worth of one currency relative to another. It is usually expressed as an exchange rate — for example, ₹83 per U.S. dollar means that one dollar can be exchanged for 83 Indian rupees.
Exchange rates fluctuate due to a combination of factors such as:
Inflation differentials
Interest rate variations
Trade balances
Foreign investment flows
Central bank policies
Market speculation
When a currency appreciates, its value rises compared to others, meaning it can buy more foreign currency. When it depreciates, it loses value, meaning more domestic currency is needed to buy the same amount of foreign currency.
These movements, while often subtle on a daily basis, can have profound effects on international trade.
Impact on Exporters
Exporters earn revenue in foreign currencies but often bear costs in their home currency. Therefore, currency depreciation usually benefits exporters, while currency appreciation tends to hurt them. Let’s explore both situations.
1. Currency Depreciation: A Competitive Advantage
When a country’s currency depreciates, its goods and services become cheaper in foreign markets. For example, if the Indian rupee weakens from ₹75 to ₹85 per U.S. dollar, an American buyer can now buy more Indian products for the same amount of dollars.
This creates several benefits for exporters:
Price Competitiveness: Products appear cheaper abroad, boosting demand.
Higher Profits: Exporters earn more in domestic currency when converting foreign sales revenue.
Market Expansion: Depreciation can help penetrate new markets or outcompete suppliers from stronger-currency nations.
For instance, India’s textile and IT service exporters often benefit when the rupee weakens against the dollar. Their revenues in dollars translate into higher rupee earnings, improving margins even if prices remain constant.
2. Currency Appreciation: A Profit Squeeze
When a domestic currency strengthens, exporters face a dual challenge:
Their products become more expensive for foreign buyers, reducing competitiveness.
Their foreign revenues shrink in domestic terms.
For example, if the rupee appreciates from ₹85 to ₹75 per dollar, the same $1 million export sale now converts into ₹75 million instead of ₹85 million — a clear loss in rupee terms.
Unless exporters hedge their exposure or increase prices (which may hurt demand), their profit margins shrink significantly.
Industries that rely heavily on exports — such as automobiles, textiles, or pharmaceuticals — are particularly sensitive to such changes.
3. Long-Term Effects on Export Strategy
Persistent currency appreciation can force exporters to rethink their strategy:
Shift production abroad to reduce currency exposure.
Focus on higher value-added goods where price sensitivity is lower.
Increase use of financial hedging instruments.
On the other hand, a consistently weak currency can encourage export-led growth but might raise inflation due to costlier imports (like energy or components).
Impact on Importers
Importers face the opposite situation. They pay for foreign goods and services in foreign currencies but sell them domestically in their local currency. Hence, currency appreciation generally benefits importers, while currency depreciation hurts them.
1. Currency Appreciation: Lower Import Costs
When the domestic currency strengthens, importers gain purchasing power. They can buy more goods from abroad for the same amount of domestic currency.
For example, if the rupee appreciates from ₹83 to ₹78 per dollar, a $10,000 machine from the U.S. costs ₹7.8 lakh instead of ₹8.3 lakh.
The benefits include:
Reduced Import Costs: Lower costs for raw materials, equipment, or finished goods.
Lower Inflation: Cheaper imports can reduce overall price pressures in the domestic economy.
Improved Margins: Importers or retailers can either lower their selling prices or increase profit margins.
Industries such as electronics, oil, and automobiles — which rely heavily on imports — often welcome currency appreciation.
2. Currency Depreciation: Costly Imports
Depreciation has the opposite effect. The domestic currency buys fewer foreign goods, increasing import costs.
For example, if the rupee depreciates from ₹83 to ₹88 per dollar, that same $10,000 machine now costs ₹8.8 lakh.
This can lead to:
Higher Input Costs: Import-dependent manufacturers face rising costs of raw materials or components.
Inflationary Pressure: Costlier imports can push up consumer prices, especially for fuel or food.
Profit Margin Squeeze: Importers may struggle to pass higher costs to consumers, hurting profitability.
A prolonged depreciation phase can thus make it difficult for import-driven sectors like energy, technology, and healthcare to maintain stable pricing structures.
Exchange Rate Pass-Through: Linking Valuation to Pricing
The concept of exchange rate pass-through (ERPT) explains how much of the currency movement is reflected in the final price of goods.
Full Pass-Through: Exporters/importers adjust prices completely in line with exchange rate changes.
Partial Pass-Through: Companies absorb part of the exchange rate impact to remain competitive.
For example, if the rupee weakens 10% but an exporter only raises prices abroad by 5%, the remaining 5% is absorbed in margins.
The degree of pass-through depends on market conditions, demand elasticity, and brand power. Highly competitive markets (like garments) show low pass-through, while niche products or monopolistic services show higher pass-through.
Case Examples
1. Indian IT and Pharmaceutical Exporters
When the rupee depreciates, these sectors thrive because they earn in dollars but spend in rupees. During 2020–2023, rupee weakness benefited companies like Infosys, TCS, and Sun Pharma, improving operating margins despite global volatility.
2. Oil and Gold Importers
India imports most of its crude oil and gold. When the rupee weakens, import bills rise sharply, widening the current account deficit and creating inflationary pressure. This shows how currency valuation directly influences macroeconomic stability.
3. Japanese Yen and Export Competitiveness
Japan has long relied on a weak yen to maintain export competitiveness in automobiles and electronics. When the yen strengthens sharply, companies like Toyota or Sony face reduced foreign earnings, prompting shifts in production to other regions.
Macroeconomic Implications
1. Trade Balance Effects
Currency depreciation tends to boost exports and reduce imports, improving the trade balance. Conversely, appreciation may widen trade deficits.
However, the J-Curve effect suggests that after depreciation, the trade deficit may initially worsen (as import bills rise before export volumes adjust) before eventually improving.
2. Inflation and Interest Rates
A weaker currency can stoke inflation through higher import costs, prompting central banks to raise interest rates. A stronger currency can have a disinflationary effect, allowing for looser monetary policy.
Hence, exporters and importers must watch not just exchange rates but also central bank reactions.
3. Investment Flows
Stable currency values attract foreign investment, while volatile or overvalued currencies deter it. Export-oriented economies like China and South Korea often manage currency levels strategically to maintain competitiveness.
Risk Management and Hedging Strategies
Given the volatility in currency markets, exporters and importers use various tools to manage risk:
Forward Contracts: Lock in future exchange rates to avoid uncertainty.
Options and Futures: Provide flexibility to benefit from favorable moves while limiting losses.
Natural Hedging: Matching foreign currency revenues and expenses (e.g., using dollar earnings to pay dollar liabilities).
Diversification: Expanding trade across multiple markets to reduce dependency on one currency.
A disciplined hedging strategy protects profit margins and ensures financial stability despite volatile exchange rates.
Policy and Central Bank Interventions
Governments and central banks often intervene in foreign exchange markets to prevent excessive currency swings.
Managed Float Systems: Authorities allow market forces to determine exchange rates but step in during volatility.
Reserve Management: Buying or selling foreign reserves to influence currency supply.
Export Incentives and Import Duties: Used to balance the impact of currency movements on trade sectors.
For example, the Reserve Bank of India (RBI) actively manages rupee liquidity to avoid sharp fluctuations that could harm exporters or spike import costs.
The Balance Between Exporters and Importers
While a weaker currency aids exporters, it hurts importers and raises inflation. Conversely, a stronger currency benefits importers and consumers but reduces export competitiveness.
Thus, an optimal exchange rate — not too strong, not too weak — is crucial. The goal for policymakers is to maintain stability rather than favor one side.
In the long run, productivity, innovation, and diversification are more sustainable sources of competitiveness than currency manipulation.
Conclusion
Currency valuation stands at the crossroads of global trade, linking the fortunes of exporters, importers, investors, and entire economies. A fluctuating exchange rate is more than a number on a financial screen — it is a reflection of economic strength, investor confidence, and trade competitiveness.
For exporters, a weaker domestic currency can mean opportunity; for importers, it can mean challenge — and vice versa. But those who understand the mechanics of currency valuation, hedge their risks, and adapt strategically can turn volatility into advantage.
In a globalized era, exchange rate literacy is as essential as market knowledge. Whether you’re shipping goods overseas or sourcing materials from abroad, managing currency exposure is not merely financial prudence — it’s the foundation of resilient international business.

Understanding Global Market SensitivitiesIntroduction
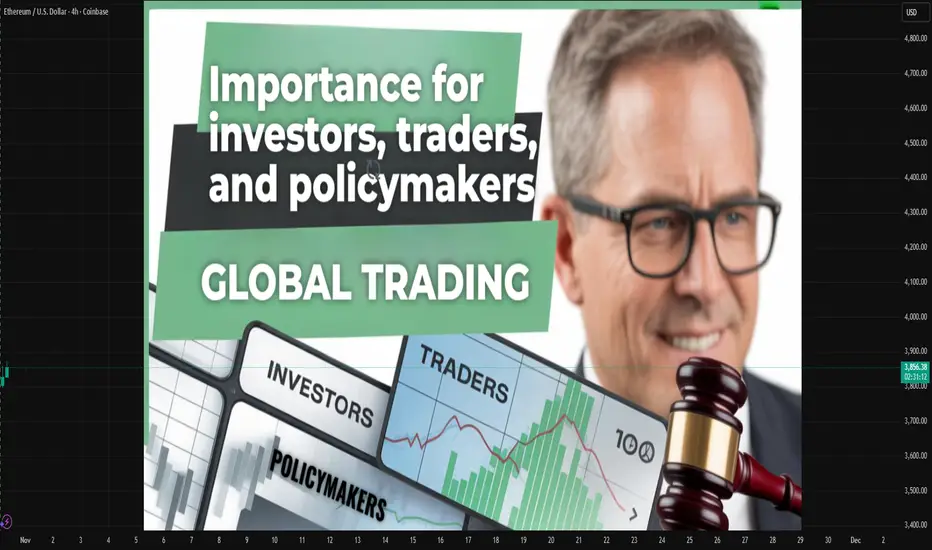
In an increasingly interconnected world, the global financial system behaves like a finely tuned orchestra—each instrument (country, industry, currency, or commodity) affects the harmony of the whole. When one note goes off-key, the impact resonates far beyond borders. These reactions, known as global market sensitivities, refer to how markets respond to changes in economic indicators, geopolitical tensions, interest rates, and investor sentiment.
Understanding these sensitivities is essential for investors, traders, and policymakers because even a minor shock in one part of the world can ripple across continents. Whether it’s a central bank rate decision in the U.S., a natural disaster in Asia, or an oil supply disruption in the Middle East, the effects are quickly transmitted through the arteries of global trade and finance.
1. What Are Global Market Sensitivities?
Global market sensitivities describe how financial markets react to internal and external stimuli—events or decisions that influence economic expectations, trade flows, and capital movement.
In simple terms, they are the emotional and structural responses of global markets to changing realities. These sensitivities are not random; they are shaped by a complex network of factors such as interest rates, inflation, political stability, supply-chain disruptions, and investor psychology.
For instance:
A spike in U.S. inflation may lead to fears of tighter monetary policy, strengthening the dollar but weakening emerging market currencies.
A conflict in the Middle East might cause oil prices to surge, impacting transportation, manufacturing costs, and inflation worldwide.
Thus, global market sensitivities are a mirror reflecting the pulse of the world economy.
2. The Role of Economic Indicators
Economic data releases are among the strongest triggers of global market movements. The most influential indicators include:
Gross Domestic Product (GDP) — Reflects a nation’s economic health. A strong GDP growth rate signals expansion, attracting investment and strengthening currency.
Consumer Price Index (CPI) — Measures inflation. Rising CPI data can pressure central banks to raise interest rates, which impacts global equity and bond markets.
Unemployment Rate — Indicates labor market strength. Lower unemployment often signals robust consumer spending, while rising unemployment hints at a slowdown.
Purchasing Managers’ Index (PMI) — Reveals the pace of industrial and service activity, providing an early indication of economic direction.
Each of these indicators can cause significant short-term volatility and long-term adjustments in asset allocation. For example, a surprising jump in U.S. inflation data might trigger a global equity sell-off as investors anticipate aggressive rate hikes.
3. The Sensitivity to Monetary Policy
Central banks, particularly the U.S. Federal Reserve, the European Central Bank (ECB), and the Bank of Japan (BoJ), play a pivotal role in global market reactions. Their decisions on interest rates, liquidity, and quantitative easing ripple across the financial world.
When central banks tighten monetary policy:
Bond yields rise.
Stock valuations often fall.
The domestic currency strengthens.
Emerging markets see capital outflows.
Conversely, when they loosen policy through rate cuts or asset purchases, risk assets like equities and commodities usually rally.
The 2020–2021 pandemic period is a perfect example. Central banks worldwide slashed interest rates and flooded economies with liquidity, triggering a global bull run in equities, real estate, and even cryptocurrencies. But when inflation surged in 2022, the reversal of these policies caused sharp corrections.
4. Geopolitical Events and Market Sensitivity
Geopolitical events—wars, trade conflicts, sanctions, and elections—often spark sudden and unpredictable market movements.
Trade Wars: The 2018 U.S.-China trade tensions disrupted global supply chains, increased tariffs, and caused stock market volatility worldwide.
Wars and Conflicts: The Russia-Ukraine war led to energy price spikes, global inflation, and shifts in commodity trade routes.
Elections and Policy Changes: The uncertainty surrounding major elections (like the U.S. Presidential race) often results in cautious trading and market rebalancing.
Markets dislike uncertainty. When geopolitics introduce unpredictability, investors typically move capital to “safe-haven assets” such as gold, the U.S. dollar, or U.S. Treasury bonds. These shifts highlight how sensitive global capital is to changes in stability and governance.
5. Currency Market Sensitivities
The foreign exchange (forex) market is perhaps the most sensitive of all. Currency movements respond instantly to changes in macroeconomic expectations, trade balances, and interest rate differentials.
For example:
If the U.S. Federal Reserve hikes rates while the European Central Bank holds steady, the USD tends to appreciate against the EUR.
Conversely, if China reports stronger-than-expected manufacturing growth, Asian currencies might gain due to improved trade sentiment.
Currency sensitivity also impacts export-import competitiveness. A stronger domestic currency makes exports expensive but reduces import costs—shaping the trade balance and corporate profitability.
6. Commodity Market Sensitivities
Commodities like oil, gold, copper, and wheat are highly sensitive to global demand, supply shocks, and geopolitical risk.
Oil prices often surge during geopolitical crises or supply disruptions (e.g., OPEC decisions, wars in oil-producing regions).
Gold, considered a safe-haven asset, rallies during times of uncertainty, inflation, or currency depreciation.
Industrial metals like copper and aluminum respond to global manufacturing data and infrastructure spending.
For investors and policymakers, understanding these sensitivities helps in forecasting inflation trends and industrial performance, since commodity costs directly affect production and consumer prices.
7. Interconnected Financial Systems
Today’s global markets are deeply interconnected through cross-border investments, supply chains, and digital financial systems.
A single event in one market can rapidly influence others:
A drop in Chinese manufacturing output can lower global metal prices.
A surge in U.S. bond yields can draw funds away from emerging markets.
European energy crises can trigger global shifts toward alternative energy investments.
This interdependence is both a strength and a weakness—it enhances global growth but also increases vulnerability to contagion effects. The 2008 financial crisis and 2020 pandemic shock illustrated how tightly woven these systems have become.
8. The Role of Technology and High-Frequency Trading
Modern markets are far more sensitive than those of the past due to algorithmic trading, AI-driven models, and instant information flow.
High-frequency trading systems can react to economic news within milliseconds, amplifying volatility. Social media and online news platforms also shape sentiment faster than traditional media. A single tweet from a political leader or a corporate executive can move billions in market capitalization.
This technological sensitivity adds a new dimension to global financial behavior—markets now respond not only to fundamentals but also to the speed of perception and reaction.
9. Emerging Markets and Capital Flow Sensitivity
Emerging economies such as India, Brazil, and Indonesia are especially vulnerable to shifts in global investor sentiment.
When global liquidity is high and risk appetite strong, these markets attract capital inflows seeking higher returns. However, when global rates rise or crises occur, these funds often exit rapidly, causing currency depreciation and stock market declines—a phenomenon known as “hot money” reversal.
For example, during the Fed’s 2013 “Taper Tantrum,” several emerging markets faced currency crises as investors pulled funds back to U.S. assets. This highlights the importance of global monetary sensitivity for developing economies.
10. Investor Sentiment and Behavioral Sensitivity
Markets are not purely rational—they are deeply psychological. Fear, greed, and herd mentality drive short-term market movements more than data.
Fear leads to sell-offs during crises.
Greed fuels rallies and bubbles during optimism.
Herd behavior causes investors to follow trends even when fundamentals don’t support them.
This emotional sensitivity explains why markets often overreact to news before stabilizing. Understanding behavioral dynamics is essential for traders aiming to anticipate volatility rather than react to it.
11. Risk Management in a Sensitive Global Market
In a world of interlinked sensitivities, risk management becomes critical. Investors and policymakers must monitor not only domestic data but also global developments.
Some strategies include:
Diversification: Spreading investments across geographies, sectors, and asset classes to reduce exposure.
Hedging: Using derivatives like futures or options to protect against currency and commodity fluctuations.
Scenario Analysis: Stress-testing portfolios under various global event assumptions (e.g., rate hikes, trade wars, pandemics).
Institutional investors also use “Value at Risk (VaR)” and sensitivity analysis to measure potential portfolio losses under different global conditions.
12. Case Studies of Market Sensitivity
a) The COVID-19 Pandemic (2020)
Global markets crashed in March 2020 as lockdowns halted economic activity. Equities plunged, oil prices briefly turned negative, and gold soared. Central bank interventions eventually reversed the panic, illustrating the delicate balance of confidence and liquidity in global systems.
b) The Russia-Ukraine Conflict (2022)
This geopolitical crisis disrupted energy and food supply chains, spiking inflation worldwide. It also led to currency instability and a renewed focus on energy independence across Europe.
c) The U.S. Inflation Surge (2022–2023)
The Federal Reserve’s aggressive rate hikes to tame inflation caused a global reallocation of capital—from risk assets to safer bonds—revealing the powerful global sensitivity to American monetary policy.
13. The Future of Global Market Sensitivities
Looking ahead, the world is entering a phase of “multi-polar market sensitivity.” Power is no longer concentrated in a single economy like the U.S.—China, India, and the EU are equally influential in shaping global sentiment.
Key future drivers include:
Energy transition and climate policy.
Technological disruption (AI, automation, and fintech).
Demographic shifts and consumption patterns.
Geopolitical realignments in trade and defense.
In this landscape, adaptability and awareness will be more valuable than prediction.
Conclusion
Global market sensitivities remind us that the world economy operates as a living organism—responsive, reactive, and interconnected. Every policy decision, natural event, or innovation sends ripples across borders, influencing trade, prices, and investment flows.
For investors, understanding these sensitivities is not merely an academic exercise; it’s a survival skill. The ability to interpret global signals, assess risk exposure, and anticipate reactions gives traders a powerful edge in navigating uncertainty.
As global systems evolve, one truth remains constant: markets move not only on numbers, but on how the world feels about them.

The Concept of Competitive DevaluationIntroduction
In the complex world of international trade and global finance, currency valuation plays a central role in determining the economic health of nations. A country’s currency value not only affects its imports and exports but also influences investment flows, inflation, and overall competitiveness in the global market. Among the many policies that governments use to influence exchange rates, one particularly controversial and strategic move is competitive devaluation—sometimes referred to as a “currency war.”
Competitive devaluation occurs when countries deliberately lower the value of their own currencies in order to gain a trade advantage over others. The main goal is simple: to make exports cheaper and imports more expensive, thereby boosting domestic production and improving the trade balance. While the concept seems straightforward, its implications are far-reaching, affecting everything from global trade relationships to inflation and geopolitical stability.
Understanding Devaluation
Before delving into competitive devaluation, it is crucial to understand what “devaluation” itself means.
Devaluation refers to a deliberate downward adjustment in the value of a country’s currency relative to other currencies. This policy is typically implemented by nations with a fixed or pegged exchange rate system, where the value of the currency is tied to another currency, such as the U.S. dollar or the euro.
For instance, if India were to officially lower the rupee’s exchange rate from ₹80 per U.S. dollar to ₹90 per U.S. dollar, it would mean the rupee has been devalued. This makes Indian exports cheaper for foreign buyers but makes imports costlier for domestic consumers.
Devaluation is generally used to:
Boost exports by making goods cheaper abroad.
Reduce imports by making foreign goods more expensive.
Correct trade imbalances or current account deficits.
Support domestic industries and employment.
However, when multiple countries start engaging in devaluation simultaneously to outcompete one another, the practice turns into competitive devaluation—a self-reinforcing cycle that can destabilize global trade.
Defining Competitive Devaluation
Competitive devaluation is a situation where several countries intentionally devalue their currencies to gain an upper hand in international trade. It’s often described as a “race to the bottom” because every country tries to make its currency weaker to outcompete others.
The basic logic is that if one country devalues its currency, its exports become cheaper on global markets. Other countries, fearing a loss of export competitiveness, may respond by devaluing their own currencies. This leads to a chain reaction of devaluations that can distort trade relationships and create volatility in financial markets.
In essence, competitive devaluation reflects an international tug-of-war where each country attempts to export more and import less by manipulating exchange rates—often at the expense of its trading partners.
Historical Background
The concept of competitive devaluation isn’t new; it has appeared in different forms throughout economic history.
1. The Great Depression (1930s)
During the Great Depression, countries abandoned the gold standard and devalued their currencies to stimulate exports. Britain devalued the pound in 1931, followed by the U.S. in 1933, and many others soon after. This wave of devaluations led to what economists termed “beggar-thy-neighbor” policies—where one nation’s gain in trade came at the expense of others, worsening global economic instability.
2. Post–World War II Period
Under the Bretton Woods System (1944–1971), exchange rates were fixed to the U.S. dollar, and the dollar was pegged to gold. Devaluations were rare but highly significant. For example, Britain devalued the pound by 14% in 1967, and France followed with smaller adjustments. However, competitive devaluation pressures contributed to the eventual collapse of the Bretton Woods system in 1971, when the U.S. dollar was floated.
3. The Modern Era (2008–Present)
The global financial crisis of 2008 revived fears of competitive devaluation. With interest rates at historic lows, countries including the U.S., Japan, and China were accused of manipulating currencies to support exports. This period saw the rise of the term “currency wars,” famously coined by Brazilian Finance Minister Guido Mantega in 2010.
The rise of quantitative easing (QE)—massive money-printing programs by central banks—indirectly weakened currencies, leading to a new form of competitive devaluation, even if not officially declared.
Mechanics of Competitive Devaluation
Competitive devaluation typically occurs through monetary policy tools rather than explicit announcements. The following mechanisms are commonly used:
Interest Rate Cuts:
Lowering interest rates reduces the returns on assets denominated in that currency, making it less attractive to investors. This causes capital outflows and weakens the currency.
Foreign Exchange Intervention:
Central banks may directly buy foreign currencies and sell domestic currency in the forex market to push down its value.
Quantitative Easing (QE):
By injecting liquidity into the economy through large-scale bond purchases, a central bank increases the money supply, which tends to lower the currency’s value.
Capital Controls:
Restricting capital inflows and outflows can manipulate currency movement indirectly.
Official Declarations or Peg Adjustments:
In fixed exchange rate regimes, governments can officially devalue their currency peg to make exports cheaper.
Motives Behind Competitive Devaluation
Countries engage in competitive devaluation primarily to achieve short-term economic goals. Key motives include:
Boosting Exports: A weaker currency makes domestic goods cheaper in global markets, leading to higher export demand.
Reducing Trade Deficits: Costlier imports help reduce trade imbalances.
Stimulating Economic Growth: Export-led growth can boost production and employment.
Combating Deflation: Devaluation can help raise domestic prices by making imports costlier.
Debt Relief: For countries with large foreign debt, devaluation can reduce the real burden when the debt is denominated in local currency.
However, while these benefits may appear attractive, the strategy comes with severe side effects, especially when used by multiple countries simultaneously.
Consequences of Competitive Devaluation
1. Short-Term Gains
In the initial phase, devaluation can indeed stimulate exports and improve a country’s trade balance. Domestic producers gain an advantage, and employment may rise in export-oriented industries. However, these gains are often temporary.
2. Imported Inflation
A weaker currency makes imports more expensive. This leads to higher costs for fuel, machinery, and raw materials—especially in countries dependent on imports—resulting in inflationary pressures.
3. Loss of Purchasing Power
Consumers face higher prices for imported goods, reducing their real income and purchasing power.
4. Retaliation and Trade Wars
When one country devalues, others retaliate to maintain competitiveness. This spiral can trigger global currency instability and even trade wars, where nations impose tariffs or barriers.
5. Financial Market Volatility
Rapid currency movements create uncertainty in capital markets. Investors may pull out funds, leading to exchange rate fluctuations and financial instability.
6. Diminished Global Confidence
Persistent devaluations erode investor confidence in a country’s economic management, leading to capital flight and loss of foreign investment.
7. Long-Term Inefficiency
Instead of improving productivity and innovation, countries may become reliant on devaluation as a shortcut to competitiveness. This undermines long-term structural growth.
Competitive Devaluation vs. Currency Manipulation
Although the two concepts overlap, they differ in intent and execution.
Competitive Devaluation is often part of a broader monetary policy aimed at economic recovery or export promotion.
Currency Manipulation, on the other hand, involves deliberate and sustained actions by a country to artificially maintain an undervalued currency for unfair trade advantage, often drawing international criticism (e.g., the U.S.–China trade tensions).
Real-World Examples
1. China (2000s–2010s)
China was often accused by the U.S. and other nations of keeping the yuan undervalued to boost exports and maintain high trade surpluses. The strategy helped China become a global manufacturing powerhouse, though it also led to significant trade frictions.
2. Japan (Abenomics Era)
Under Prime Minister Shinzo Abe (2012 onward), Japan’s policy of aggressive monetary easing weakened the yen, helping Japanese exporters but drawing criticism from trading partners who saw it as competitive devaluation.
3. Eurozone (Post-2015 QE)
The European Central Bank’s quantitative easing program weakened the euro, benefiting exporters in Germany, France, and Italy, while raising concerns in the U.S. and emerging markets.
4. United States (Post-2008)
Though not a traditional devaluation, the U.S. Federal Reserve’s low-interest-rate and QE policies weakened the dollar, indirectly boosting exports and prompting other countries to follow suit.
Global Implications
The ripple effects of competitive devaluation go far beyond national borders:
Distorted Trade Balances: Export gains in one country often mean export losses in another, leading to global imbalances.
Increased Global Inflation: Weak currencies make global commodities like oil and metals more expensive.
Tensions Among Trading Partners: Countries may accuse one another of unfair practices, straining diplomatic relations.
Unstable Capital Flows: Investors shift funds rapidly in response to currency movements, destabilizing emerging markets.
Reduced Global Growth: If all countries devalue simultaneously, the net benefit vanishes—resulting instead in uncertainty and slower trade growth.
Policy Alternatives to Devaluation
Instead of engaging in competitive devaluation, countries can pursue more sustainable policies such as:
Improving Productivity and Innovation: Enhancing competitiveness through technology and efficiency rather than currency weakness.
Fiscal Reforms: Managing government spending and taxation to stabilize the economy.
Diversifying Exports: Reducing dependence on a few export sectors or trading partners.
Enhancing Domestic Demand: Building a stronger internal market to offset external vulnerabilities.
Coordinated Monetary Policies: Through organizations like the IMF or G20, countries can align exchange rate strategies to avoid destructive currency wars.
Conclusion
Competitive devaluation is a double-edged sword. While it may offer short-term relief to struggling economies by stimulating exports and reducing trade deficits, it ultimately creates more problems than it solves when used excessively or simultaneously by multiple nations.
The strategy can lead to global instability, inflation, and erosion of investor confidence—undermining the very competitiveness it seeks to enhance. The real solution lies not in weakening currencies but in strengthening economic fundamentals: productivity, innovation, diversification, and fair trade practices.
In a world where economies are deeply interconnected, competitive devaluation is less a path to prosperity and more a reminder that sustainable growth depends on cooperation, not competition, in currency markets.
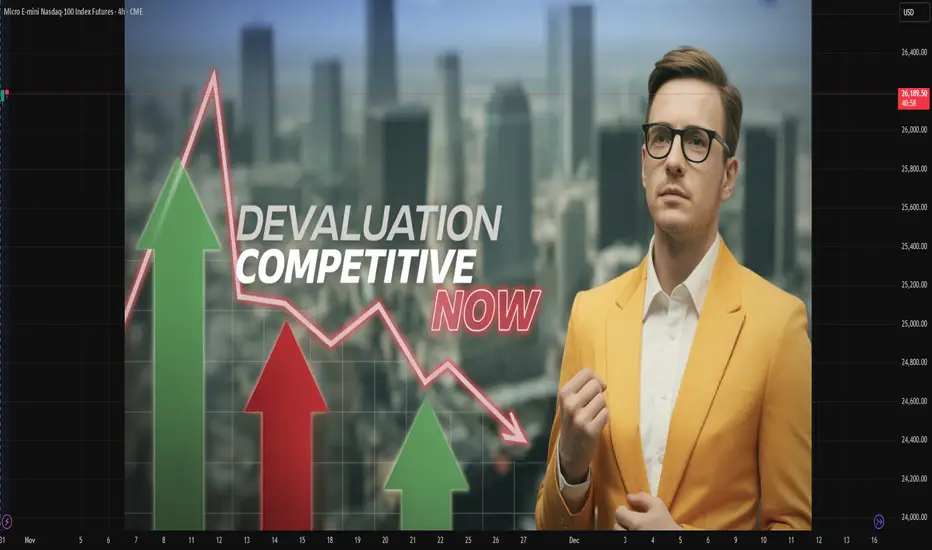
The way Rate Cuts & Other Events Price InContents
In this idea we will get in to a small deep dive on how rate cuts and most of the other events price in, how you can position your self accordingly, and more. Lets get in to it!
🔹 Important Question
If we were expecting a rate cut and it happens why does price dip in the short term? Lets do a case study.
🔹 Case Study
September 17th, 25bps cuts everybody was hyped. Retail was excited, so why did it go wrong? Look into screen shot 1, we highlighted when the FOMC meeting took place. Price pumped before the FOMC meeting. This is because Interest Rates price in before it happens.
That is how most events play out, 1-2 weeks prior price prices in and according to the event it plays out.
🔹 Different Outcomes
If you were to look at poly market during the last FOMC meeting and the previous ones you could see like 98% people betting its going to be 25bps. That is one indication of what might happen, another on is projections. Many projections were suggesting 25bps as well, so it aligned price priced in before.
Lets say instead of 25bps, 50bps happened or even 75bps. Price would pump up reason being, price priced in based on another expectation. The following would have been the outcome:
No change: Dump 🔴 (Probably hard dump)
25bps: Dump 🔴 (Because priced in before hand)
50bps: Pump 🟢 (Nobody except for insiders were expecting it)
In other words, if a event which is going to be bullish is going to happen price prices in before and based on the event outcome finalization the output plays out.
🔹 Different Type of Events
Lets say something instant just happened, type of events price in at that time. So expected events and unexpected events are completely different. They price in/react different ways.
🔹 How to position
Well as an example if you know Rate Cuts are going to happen on xyz date, prepare for it 2 weeks before position take positions according to forecasts and high bets like poly market (What people bet on the most happens most of the time).
Once the event happens if its a not expected event like instead of 25bps cuts, 50bps happens then keep your position. If its the expected event, then close position. If its like in our rate cut example instead of 25bps its no change then maybe even reverse your position instantly.
⚠️ Disclaimer: Not financial advice.
Thank you
If you have any questions/comments or ideas comment below!
Thank you for reading.

HOW TO TRADE THE LONG TERM TREND BY DRAWING TRENDLINES!Hey Traders so today wanted to make a quick video that explains how to trade the long term trend early. Also when to move your trendline to stay with the market for as long as possible in long term trends.
Hope This Helps Your Trading 😃
Clifford

Understanding Currency Pegs and How Currency Peg Systems WorkIntroduction: The Concept of Currency Pegs
In the global financial system, currency values constantly fluctuate, driven by supply and demand in the foreign exchange (forex) markets. However, not all currencies are allowed to float freely. Some countries choose to stabilize their exchange rate by linking, or “pegging,” their currency’s value to another, often more stable currency such as the U.S. dollar or the euro.
This system—known as a currency peg—acts as an anchor, helping to create economic stability, promote trade, and attract investment.
Currency pegs are particularly common among developing economies or small, trade-dependent nations that rely heavily on imports and exports. They use this mechanism to prevent their currencies from swinging wildly in value, which can otherwise disrupt trade and financial flows.
What Is a Currency Peg?
A currency peg, also called a fixed exchange rate, is a policy where a country’s central bank maintains its currency’s value at a set rate relative to another currency or a basket of currencies.
For instance, if the Saudi riyal is pegged to the U.S. dollar at 3.75 riyals per USD, the Saudi Arabian Monetary Authority (SAMA) must keep the exchange rate near that level by intervening in the currency market.
To do this, the central bank buys or sells its own currency and holds foreign reserves to maintain the peg. In effect, this ties the nation’s monetary policy to the currency it is pegged against.
Types of Currency Peg Systems
Currency pegs can exist in several forms, depending on how strictly the rate is maintained:
1. Hard Peg (Fixed Exchange Rate)
A hard peg means the country’s currency is rigidly fixed to another. The exchange rate remains unchanged for long periods, and the central bank commits to buying or selling its currency at that exact rate.
Example: The Hong Kong dollar has been pegged to the U.S. dollar at around HKD 7.8 per USD since 1983. The Hong Kong Monetary Authority defends this rate by holding substantial foreign reserves.
2. Soft Peg (Adjustable Peg)
A soft peg allows limited flexibility. The currency is pegged to another, but the rate can be adjusted occasionally in response to economic conditions or balance of payments pressures.
Example: China’s yuan was historically pegged to the U.S. dollar but now operates within a managed band, allowing small daily fluctuations.
3. Crawling Peg
A crawling peg adjusts the fixed rate gradually over time, typically to reflect inflation differentials or other economic indicators.
Example: Some Latin American economies have used crawling pegs to devalue their currencies slowly, avoiding sudden shocks.
4. Peg to a Basket of Currencies
Instead of pegging to a single currency, some countries peg to a basket—a weighted average of multiple currencies.
Example: Kuwait pegs its dinar to a basket of major currencies, reducing dependence on any single one like the U.S. dollar.
Why Do Countries Adopt Currency Pegs?
Currency pegs serve as a tool for economic stability and predictability, particularly for nations vulnerable to volatile market forces. Here are the main reasons:
1. Promoting Trade and Investment
Stable exchange rates make international transactions more predictable. Exporters and importers know the exact value of goods in foreign currencies, and foreign investors can calculate returns more confidently. This predictability boosts cross-border trade and long-term investments.
2. Controlling Inflation
Pegging to a stable currency, such as the U.S. dollar, helps control inflation. Many developing nations with histories of hyperinflation use pegs to import monetary discipline. If their domestic currency is tied to the dollar, the local central bank must follow stable monetary policies to maintain the peg.
3. Building Economic Credibility
For smaller economies or those recovering from crises, a peg can signal financial responsibility to international markets. It helps rebuild investor confidence, particularly when domestic institutions are still developing.
4. Supporting Tourism and External Relations
Tourism-based economies, such as those in the Caribbean, often peg their currencies to the U.S. dollar. Since many tourists arrive with U.S. currency, the peg simplifies pricing, billing, and budgeting.
5. Attracting Foreign Capital
A predictable exchange rate reduces currency risk for foreign investors, making it easier to attract foreign direct investment (FDI). Stable pegs encourage long-term capital inflows.
How Currency Peg Systems Work
Maintaining a currency peg requires constant monitoring, intervention, and reserve management by the central bank. Here’s how it operates in practice:
1. Central Bank Intervention
When market forces push the currency value above or below the peg, the central bank intervenes:
If demand for the local currency rises, the bank prints more of it and buys foreign currency (like USD) to weaken its own currency.
If demand for the local currency falls, the bank sells its foreign reserves (USD, euros, etc.) to buy back its own currency, supporting its value.
These operations ensure that the exchange rate remains within the desired range.
2. Maintaining Foreign Exchange Reserves
A country must hold large reserves of the foreign currency it pegs to. These reserves act as ammunition for market interventions.
For example, if a nation pegs to the U.S. dollar, it must have sufficient dollar reserves to buy back its local currency when needed.
3. Adjusting Domestic Monetary Policy
In a pegged system, a country’s monetary policy becomes partially dependent on the foreign currency’s central bank (e.g., the U.S. Federal Reserve). If the Fed raises interest rates, the pegging country might need to follow suit to prevent capital outflows that could destabilize the peg.
4. Managing Balance of Payments
Persistent trade deficits can pressure a peg since more foreign currency leaves the country than enters. The central bank must manage fiscal and trade policies carefully to sustain the balance of payments equilibrium.
Advantages of Currency Pegs
1. Exchange Rate Stability
The most significant advantage is stability. Businesses and consumers can plan without worrying about large currency fluctuations, fostering confidence and long-term contracts.
2. Inflation Control
Pegging to a low-inflation currency imports that stability domestically, helping countries with histories of monetary mismanagement establish discipline.
3. Boosts Investor Confidence
Foreign investors prefer predictable currency environments. A peg reassures them that their investments won’t lose value due to sudden depreciation.
4. Facilitates Trade
When two economies have stable exchange relations, it simplifies cross-border pricing, reduces hedging costs, and promotes smoother transactions.
Disadvantages and Risks of Currency Pegs
While pegs can stabilize economies, they also come with significant constraints and vulnerabilities.
1. Loss of Monetary Policy Independence
A pegged country cannot freely adjust interest rates or money supply to address domestic issues. For example, if inflation rises locally, raising rates might break the peg if the anchor country’s rates remain low.
2. Vulnerability to Speculative Attacks
If traders believe a currency is overvalued or the central bank lacks sufficient reserves, they might short the currency, forcing a devaluation.
Example: The 1997 Asian Financial Crisis began when Thailand’s baht, pegged to the U.S. dollar, came under speculative attack. The central bank eventually abandoned the peg, leading to massive devaluation and contagion across Asia.
3. Reserve Dependency
Maintaining a peg requires holding large foreign reserves, which can strain smaller economies. If reserves run low, the peg becomes unsustainable.
4. Export Competitiveness
If the anchor currency strengthens, the pegged nation’s exports become more expensive globally, reducing competitiveness. For instance, countries pegged to the dollar may face export challenges when the dollar appreciates.
5. Economic Imbalances
Over time, fixed rates can cause trade imbalances if the pegged value doesn’t reflect market realities. This can lead to persistent deficits and unsustainable external borrowing.
Examples of Currency Peg Systems Around the World
1. Hong Kong Dollar (HKD)
Since 1983, Hong Kong has maintained a Linked Exchange Rate System, pegging the HKD at roughly 7.8 per USD. The system has successfully provided stability, especially during regional financial crises.
2. Saudi Riyal (SAR)
Saudi Arabia has pegged the riyal to the U.S. dollar at 3.75 per USD since 1986. This peg supports its oil-based economy, as crude is traded globally in dollars.
3. United Arab Emirates Dirham (AED)
The UAE maintains a peg to the U.S. dollar at 3.6725 per USD, promoting investor confidence and supporting trade and tourism.
4. Chinese Yuan (CNY)
China operated a strict dollar peg until 2005. Now, it follows a managed float against a basket of currencies, reflecting a controlled yet flexible exchange system.
5. Danish Krone (DKK)
Denmark pegs its krone to the euro through the Exchange Rate Mechanism (ERM II), maintaining stability within a narrow band.
When Currency Pegs Fail
Currency pegs can collapse when economic fundamentals diverge too much from the pegged value or when reserves run out.
For example:
Thailand (1997): After heavy speculation and dwindling reserves, Thailand abandoned its dollar peg, triggering the Asian crisis.
Argentina (2001): Argentina’s one-to-one peg to the U.S. dollar collapsed after years of recession and fiscal deficits, leading to a major economic crisis.
When pegs fail, they often do so suddenly, causing sharp currency devaluation, inflation spikes, and loss of investor trust.
Alternatives to Pegged Systems
Not all countries benefit from pegs. Some prefer floating or managed-floating systems that allow market forces to determine the exchange rate:
Free Float: Used by the U.S., Japan, and India, where exchange rates move based on market forces.
Managed Float: Used by China and Singapore, where authorities allow limited flexibility while guiding currency movement within a controlled range.
These systems provide greater policy freedom and reduce the risk of speculative attacks but can introduce volatility.
The Future of Currency Pegs
In today’s globalized economy, currency pegs remain a tool for stability, particularly for smaller or oil-exporting nations. However, digitalization, global capital flows, and geopolitical shifts are challenging traditional peg systems.
Some economists argue that rigid pegs are unsustainable in a world of high-speed capital movement. Others maintain that pegs provide essential stability in uncertain times, especially for nations lacking deep financial markets.
The future likely lies in hybrid systems—managed or crawling pegs that balance stability with flexibility. These allow countries to adjust gradually without losing investor confidence.
Conclusion: Stability Comes at a Cost
Currency pegs are a double-edged sword. On one side, they bring stability, predictability, and confidence—vital for trade-dependent economies. On the other, they limit policy freedom and can create vulnerabilities during global shocks.
A successful peg depends on strong economic fundamentals, ample foreign reserves, and credible monetary management. When maintained responsibly, a currency peg can serve as a stabilizing anchor in the turbulent seas of global finance.
However, when mismanaged or politically motivated, it can turn into a financial trap that magnifies economic crises instead of preventing them.

What Is CPI and Why It Matters GloballyIntroduction: The Pulse of the Global Economy
In the complex world of economics, few indicators hold as much influence and significance as the Consumer Price Index (CPI). Whether it’s a policymaker setting interest rates, an investor predicting market movements, or an ordinary consumer noticing rising grocery bills, CPI plays a role in everyone’s financial life. It acts as a mirror reflecting changes in the cost of living and inflation, shaping everything from global monetary policies to household budgets.
Simply put, CPI measures how much prices have increased or decreased for a basket of goods and services that consumers typically buy. However, behind this simple concept lies a powerful tool that helps nations assess economic stability, business competitiveness, and the real purchasing power of their citizens.
Understanding CPI: The Basics
The Consumer Price Index (CPI) is an economic indicator that measures the average change in prices of a fixed basket of goods and services over time. This basket includes everyday items such as food, housing, clothing, healthcare, transportation, and education — essentially capturing the spending habits of urban consumers.
CPI as a Measure of Inflation
CPI is the most widely used tool to measure inflation — the general increase in prices and fall in the purchasing power of money.
When CPI rises steadily, it indicates inflation; when it falls, it suggests deflation.
Inflation can be both a sign of growth and a warning signal. Moderate inflation encourages spending and investment, as people prefer to buy now rather than later. But excessive inflation — as seen in countries like Argentina or Turkey in recent years — erodes savings, raises borrowing costs, and destabilizes economies.
Conversely, deflation (a sustained drop in prices) might sound appealing but can trigger economic stagnation. Falling prices reduce business revenues and wages, discouraging spending and investment.
Thus, tracking CPI helps governments strike a delicate balance between economic growth and price stability.
Types of CPI
Economists often use different versions of CPI to capture varied aspects of price changes:
Headline CPI:
This is the broadest measure, including all goods and services in the consumer basket. It reflects the overall inflation rate but can be volatile due to changes in food and energy prices.
Core CPI:
Excludes food and energy components, as they are prone to short-term fluctuations. Core CPI gives a clearer picture of long-term inflation trends.
CPI-W and CPI-U (in the U.S.):
CPI-W tracks the spending habits of urban wage earners and clerical workers.
CPI-U includes all urban consumers and is considered the official measure of inflation.
HICP (Harmonized Index of Consumer Prices):
Used by the European Union, this version allows for consistent inflation comparisons across member states.
Each variation of CPI serves a specific policy or analytical purpose, allowing economists to monitor inflation more accurately across different sectors and regions.
CPI and Global Monetary Policy
CPI plays a central role in shaping global monetary policy.
Central banks like the Federal Reserve (U.S.), European Central Bank (ECB), Bank of England, and the Reserve Bank of India (RBI) rely on CPI trends to make key decisions about interest rates and money supply.
When CPI shows rising inflation, central banks often raise interest rates to cool down spending and borrowing.
When CPI indicates deflation or weak inflation, they lower rates to stimulate economic activity.
For instance, during the COVID-19 pandemic, global CPI levels dropped as demand collapsed. Central banks responded with historically low interest rates and massive stimulus packages.
However, post-pandemic supply chain disruptions and energy shortages sent CPI soaring globally — prompting rapid interest rate hikes in 2022–2023.
These fluctuations show how closely CPI data influences global financial stability, currency values, and investment decisions.
CPI and Purchasing Power
CPI also helps determine changes in purchasing power — how much goods and services a unit of currency can buy.
If wages rise slower than CPI, real income effectively decreases, meaning consumers can buy less with the same money.
For example:
If CPI rises by 6%, but wages increase by only 3%, then real wages have fallen by 3%.
This erosion in purchasing power can reduce consumer confidence and spending — key drivers of economic growth.
Governments and labor unions often use CPI data to adjust wages, pensions, and social benefits (a process called indexation) to maintain people’s living standards.
CPI as a Global Benchmark
CPI data is not just a domestic concern — it has international ramifications.
Global investors, financial institutions, and multinational corporations all monitor CPI across different countries to assess economic health and currency risks.
Here’s how:
Exchange Rates:
High inflation (rising CPI) typically weakens a nation’s currency because it erodes purchasing power. Investors may move money to countries with lower inflation and higher returns, affecting foreign exchange markets.
Investment Flows:
CPI trends help guide foreign direct investment (FDI) and portfolio investment decisions. For instance, a stable CPI and moderate inflation attract investors seeking predictable returns.
Trade Competitiveness:
Countries with lower inflation maintain price stability in exports, making their goods more competitive globally. Conversely, high CPI growth can make exports expensive and hurt trade balances.
Thus, CPI serves as a universal barometer for comparing economic conditions across nations.
CPI and the Financial Markets
The stock market, bond market, and commodity markets react strongly to CPI reports.
Traders and investors treat CPI announcements as key economic events because they directly influence interest rate expectations and corporate profitability.
Equity Markets:
Rising CPI may hurt company profits by increasing input costs. However, certain sectors — like energy, commodities, and consumer staples — often benefit during inflationary periods.
Bond Markets:
Bonds are highly sensitive to inflation. When CPI rises, bond yields increase because investors demand higher returns to offset the loss of purchasing power. This inversely affects bond prices.
Commodity Markets:
Commodities such as gold and crude oil often act as inflation hedges. A high CPI can push investors toward tangible assets that retain value when currencies lose purchasing power.
Thus, CPI data can trigger short-term volatility and long-term investment strategy shifts across asset classes.
Limitations of CPI
While CPI is an essential tool, it’s not without flaws. Economists often debate its accuracy and representativeness due to several factors:
Substitution Bias:
Consumers tend to switch to cheaper alternatives when prices rise, but CPI assumes a fixed basket — overstating inflation.
Quality Adjustments:
Technological improvements often increase product quality (e.g., smartphones), but CPI may not fully capture this added value.
Geographical Variations:
Price changes differ between regions. Urban CPI may not accurately reflect rural cost-of-living changes.
Lagging Indicator:
CPI measures inflation after it has occurred, meaning policymakers are often reacting to past data.
Exclusion of Certain Costs:
CPI may exclude investment assets like real estate or stocks, even though they significantly affect household wealth.
Despite these limitations, CPI remains the most reliable and widely accepted inflation measure because of its consistency and comparability.
Case Studies: CPI in Action
1. United States: Inflation and Federal Reserve Policy
In 2022, U.S. CPI surged above 9%, the highest in four decades. Rising food, fuel, and housing costs prompted the Federal Reserve to raise interest rates aggressively throughout 2022–2023. This decision cooled inflation but also slowed economic growth and rattled stock markets.
It showcased how CPI data can reshape monetary strategy and ripple through global markets.
2. India: Balancing Growth and Inflation
India’s CPI basket is heavily weighted toward food and housing. When food prices rise due to poor monsoon or supply shortages, CPI spikes quickly.
The RBI uses CPI as its main inflation target, aiming to keep it between 2–6%. By adjusting repo rates based on CPI trends, the RBI manages both growth and price stability.
3. Eurozone: The Battle with Deflation and Energy Prices
For years, the Eurozone struggled with low inflation and deflation risks, prompting the ECB to maintain ultra-low interest rates. However, after the Ukraine conflict in 2022, energy-driven CPI spikes forced the ECB to tighten policy sharply.
This swing illustrated CPI’s impact on regional economic integration and fiscal coordination.
CPI in the Context of Global Challenges
Today’s world faces unprecedented inflationary pressures due to factors like:
Geopolitical conflicts (e.g., Russia–Ukraine)
Supply chain disruptions
Energy market volatility
Climate change impacting agriculture
Post-pandemic demand surges
As a result, global CPI data has become a critical early warning system for potential recessions, stagflation, or monetary tightening cycles.
International institutions such as the IMF and World Bank rely on CPI trends to forecast global growth and recommend policy adjustments.
Future of CPI: Adapting to a Changing Economy
As consumption habits evolve, CPI calculations must also adapt. The rise of digital goods, subscription services, and AI-driven economies is reshaping how statisticians define the “consumer basket.”
Future CPI methodologies may include:
Real-time price tracking using big data and AI
Regional CPI dashboards for urban and rural contrasts
Inclusion of environmental costs and green inflation (the impact of climate policies on prices)
Better adjustments for technological improvements
Such innovations will make CPI a more accurate, dynamic, and inclusive measure of global inflation.
Conclusion: The Global Significance of CPI
The Consumer Price Index is more than just a number; it is the heartbeat of the world economy. It influences how central banks set interest rates, how investors allocate capital, how governments plan budgets, and how families manage their daily expenses.
Understanding CPI is crucial not only for economists but for anyone navigating an interconnected global economy. Whether inflation is surging or stabilizing, CPI tells the story of how value, consumption, and confidence move together in shaping our economic future.
In a world of shifting trade patterns, volatile energy markets, and evolving digital economies, CPI remains the compass that helps policymakers, businesses, and citizens alike find direction amid economic uncertainty.

The Resurgence of the Commodity MarketIntroduction: The Return of the Commodity Supercycle
In the ever-evolving global financial landscape, the commodity market has made a remarkable comeback after a period of stagnation. From energy to metals, and agricultural goods to rare earth elements, commodities are once again commanding investor attention. This resurgence is not a coincidence—it’s the result of a complex interplay of geopolitical shifts, supply-chain disruptions, climate policies, and global economic realignments.
The early 2020s witnessed extreme volatility due to the pandemic, trade wars, and inflationary pressures. However, by the mid-2020s, commodities began to reassert themselves as a cornerstone of global trade and investment. Whether it’s oil prices surging due to production cuts, gold reclaiming its role as a hedge against inflation, or agricultural commodities thriving under new technological revolutions—this revival is reshaping how investors view raw materials and physical assets.
Understanding Commodities: The Backbone of Global Trade
Commodities are the raw materials essential for industrial production and everyday consumption. They are broadly categorized into:
Energy Commodities – crude oil, natural gas, coal, etc.
Metal Commodities – gold, silver, copper, aluminum, iron ore, etc.
Agricultural Commodities – wheat, coffee, soybeans, sugar, cotton, etc.
Livestock Commodities – cattle, pork, and poultry.
The commodity market operates through two major platforms—spot markets, where physical goods are traded for immediate delivery, and futures markets, where contracts are traded for future delivery at predetermined prices. These markets are not only crucial for producers and consumers but also for investors seeking diversification and protection against inflation.
The Post-Pandemic Economic Reawakening
The COVID-19 pandemic brought global trade to a halt, creating unprecedented demand shocks. However, as economies reopened and recovery began, the demand for commodities soared. Industries rushed to restock raw materials, pushing prices of metals, energy, and agricultural products upward.
Supply Chain Recalibration: The pandemic exposed the fragility of global supply chains. Countries began rethinking their import dependencies, especially in energy and minerals.
Stimulus-Driven Demand: Governments around the world unleashed massive fiscal stimulus packages to boost economic activity, indirectly fueling demand for construction materials, metals, and oil.
Inflation Hedge: With inflation rising globally, investors turned back to commodities as a hedge, boosting demand in futures markets.
This combination of demand revival and constrained supply triggered the beginning of a new commodity upcycle.
Geopolitical Tensions and Their Ripple Effects
One of the strongest catalysts behind the commodity market’s resurgence has been geopolitics. Conflicts and diplomatic realignments have had a direct impact on energy and raw material prices.
Russia-Ukraine Conflict: The war disrupted global energy and grain supplies. Russia, a leading exporter of oil, natural gas, and fertilizers, faced sanctions, leading to supply shortages and price spikes. Ukraine’s grain exports, critical for global food security, were also severely impacted.
Middle East Volatility: Tensions in the Middle East, particularly involving Iran and Israel, have kept oil markets on edge. Any potential disruption in the Strait of Hormuz can impact nearly 20% of global oil supply.
China’s Resource Strategy: China’s efforts to secure long-term supplies of copper, lithium, and rare earth metals have reshaped global trade patterns, pushing other nations to pursue similar strategies.
Such geopolitical events have underscored how commodities are deeply intertwined with international power dynamics, further driving speculative and strategic interest in these markets.
The Green Energy Transition: A New Commodity Boom
The global push toward decarbonization and renewable energy has created a fresh wave of demand for specific commodities. The green revolution isn’t just about technology—it’s about materials.
Copper and Lithium: The shift to electric vehicles (EVs) and renewable power grids has sent demand for copper, lithium, nickel, and cobalt skyrocketing. These metals are essential for batteries, wind turbines, and solar panels.
Silver and Rare Earths: Silver, known for its conductivity, is vital in solar panels, while rare earth elements power everything from smartphones to electric motors.
Biofuels and Carbon Credits: Agricultural commodities like sugarcane and corn are being used for ethanol and biofuel production, adding new dimensions to their market value.
The green energy boom has effectively launched a “new age commodity supercycle”, where metals and minerals once considered niche are now the focal point of trillion-dollar investment flows.
Technological Advancements and Digital Commodities
Technology is transforming how commodities are traded and valued. Advanced analytics, AI-driven forecasting, and blockchain-based smart contracts are modernizing the age-old commodity trading structure.
Blockchain and Transparency: Blockchain ensures traceability in commodity supply chains, helping verify ethical sourcing, especially for minerals like cobalt and gold.
Algorithmic Trading: Automated trading systems now dominate commodity exchanges, bringing efficiency but also higher volatility.
Digital Commodities: The rise of “digital commodities” such as carbon credits and data storage assets introduces a new layer to the market, expanding its traditional boundaries.
These innovations have enhanced accessibility and transparency, attracting new investors and institutional funds to the sector.
Inflation, Interest Rates, and Investor Behavior
Commodities have historically served as a hedge against inflation. As central banks worldwide grapple with balancing inflation control and economic growth, commodities find themselves at the center of monetary policy discussions.
Inflation Hedge: Gold and silver remain the go-to assets for investors seeking protection from currency devaluation.
Interest Rate Impact: While higher interest rates typically strengthen the dollar (making commodities expensive for non-U.S. buyers), they also suppress speculative demand. However, in a persistently inflationary environment, commodities still outperform many asset classes.
Portfolio Diversification: Institutional investors and hedge funds are increasing commodity exposure through ETFs and index funds to reduce portfolio risk amid equity market volatility.
Thus, the commodity market’s resurgence is not only demand-driven but also investor-driven, as market participants recognize its role as a stabilizer during uncertain times.
Agricultural Commodities: The Silent Winners
While energy and metals grab headlines, agricultural commodities are quietly powering a parallel boom. Climate change, shifting consumption patterns, and food security concerns have made agri-commodities more valuable than ever.
Climate Change Impact: Erratic weather patterns have reduced yields in major producing countries, tightening global supplies.
Rising Global Population: A growing population, especially in emerging markets, is pushing up demand for grains, dairy, and edible oils.
Technological Innovations: Precision farming, AI-driven crop analytics, and bio-engineered seeds are improving productivity, balancing supply-demand dynamics.
Commodities like soybeans, corn, and coffee have seen significant price growth as nations prioritize agricultural sustainability and food independence.
Emerging Market Influence and Demand Surge
Emerging economies like India, China, and Brazil are playing a crucial role in sustaining the commodity bull run. Rapid urbanization, industrialization, and infrastructure expansion have created insatiable demand for energy and metals.
India’s Infrastructure Push: Government initiatives like “Make in India” and renewable energy expansion have spiked demand for steel, copper, and coal.
China’s Urban Growth: Despite efforts to shift to a service-based economy, China’s construction and EV sectors remain massive consumers of raw materials.
Africa’s Resource Potential: African nations are emerging as key suppliers of strategic minerals and agricultural goods, reshaping global supply lines.
The commodity trade’s center of gravity is shifting toward the developing world, ensuring that demand remains robust for years to come.
Challenges: Volatility, Speculation, and Sustainability
Despite its strong recovery, the commodity market is not without challenges. Price volatility remains a major concern, often fueled by speculative trading and external shocks.
Speculative Pressure: Hedge funds and institutional investors often amplify price swings through leveraged positions.
Supply Constraints: Political instability, mining regulations, and environmental restrictions can disrupt supply chains.
Sustainability Issues: The environmental footprint of commodity extraction and production is under scrutiny. ESG (Environmental, Social, and Governance) investing is reshaping how funds approach commodity exposure.
For the commodity rally to sustain long-term, balancing profitability with sustainability will be critical.
India’s Role in the Commodity Resurgence
India, one of the world’s fastest-growing economies, stands at the heart of the commodity revival story. With increasing energy needs, a booming manufacturing sector, and a vibrant agricultural economy, India’s commodity exchanges like MCX and NCDEX are seeing heightened activity.
Energy Imports: India’s dependence on crude oil imports makes it sensitive to global price shifts, influencing domestic inflation.
Gold Consumption: India remains one of the top consumers of gold, linking domestic demand directly with international gold markets.
Agri-Exports: Agricultural exports like rice, spices, and sugar are strengthening India’s global trade presence.
Additionally, the Indian government’s focus on renewable energy and green hydrogen places the nation in a unique position to benefit from the global commodity uptrend.
The Road Ahead: A New Commodity Supercycle?
Market analysts increasingly believe that we are at the beginning of a multi-year commodity supercycle, driven by global transformation in energy, technology, and trade. Key factors fueling this outlook include:
Structural demand from green energy and EV sectors.
Chronic underinvestment in mining and exploration.
Persistent geopolitical fragmentation.
Long-term inflationary pressures.
However, the future of this cycle will depend on how nations balance economic growth with climate commitments. Commodities that align with sustainability goals are likely to outperform those that face regulatory or environmental pushback.
Conclusion: The Age of Strategic Commodities
The resurgence of the commodity market is more than a cyclical rebound—it represents a structural shift in how the world values its natural resources. As the global economy transitions toward sustainability, technological innovation, and multipolar trade systems, commodities are reclaiming their central role in economic development and investment strategy.
From oil rigs to lithium mines and from wheat fields to copper smelters, commodities are driving a silent yet powerful revolution in global finance. For investors, this resurgence offers both opportunities and challenges: opportunities to profit from long-term trends, and challenges to navigate volatility and sustainability risks.
In essence, the world has re-entered an era where “resources equal power.” The commodity market’s revival is not just about prices—it’s about the rediscovery of the tangible foundations that sustain modern civilization.
Lessons Learned from Past Meltdowns (2008, 2020, etc.)1. The 2008 Financial Crisis: A Wake-Up Call for Systemic Risk
The 2008 Global Financial Crisis (GFC) was triggered by the collapse of the U.S. housing bubble, excessive leverage in financial institutions, and the widespread use of complex derivatives such as mortgage-backed securities (MBS) and collateralized debt obligations (CDOs). When Lehman Brothers filed for bankruptcy in September 2008, panic spread globally. The crisis led to trillions in lost wealth, millions of job losses, and the deepest recession since the Great Depression.
Key Lessons from 2008:
a. Importance of Transparency and Regulation:
The 2008 crisis revealed how opaque financial products and inadequate oversight can destabilize the entire financial ecosystem. Banks took excessive risks without sufficient capital buffers, while rating agencies failed to assess true risk levels. Post-crisis reforms, such as Basel III norms, Dodd-Frank Act, and stress testing frameworks, were introduced to improve capital adequacy, liquidity, and accountability.
b. Systemic Risk Can Spread Rapidly:
The interconnection of global banks turned what began as a housing market issue into a worldwide meltdown. The concept of “too big to fail” became central to financial discourse. The lesson: monitoring systemic risk is as important as regulating individual institutions. Financial contagion can cross borders instantly, necessitating global cooperation among central banks and regulators.
c. Moral Hazard and Bailouts:
Massive government bailouts (e.g., TARP in the U.S.) saved the system but raised questions about moral hazard—whether saving reckless institutions encourages future risk-taking. The lesson was clear: regulation should prevent risk-taking before it requires taxpayer-funded rescues.
d. The Role of Monetary Policy:
Central banks realized their power and limitations. The U.S. Federal Reserve’s near-zero interest rate policy and quantitative easing (QE) became critical tools to stabilize markets. However, these also laid the groundwork for future inflationary pressures and asset bubbles. Lesson: monetary easing is effective but must be balanced with fiscal prudence and structural reforms.
e. Behavioral Economics Matters:
Investor psychology—greed during booms and fear during crashes—played a decisive role. Overconfidence, herd behavior, and the illusion of endless housing price appreciation fueled the bubble. Behavioral finance emerged as a crucial field for understanding and mitigating irrational market behavior.
2. The 2020 Pandemic Crash: A Crisis Like No Other
Unlike 2008, which was a financial crisis rooted in excess and mismanagement, the 2020 crash was a health crisis turned economic catastrophe. When COVID-19 spread globally in early 2020, lockdowns halted production, trade, and travel, triggering a sudden and sharp global recession. Stock markets collapsed, oil prices turned negative, and unemployment soared. Yet, recovery was surprisingly swift—thanks to unprecedented fiscal and monetary interventions.
Key Lessons from 2020:
a. Speed and Scale of Policy Response Matter:
Governments and central banks acted far faster in 2020 than in 2008. The U.S. Federal Reserve slashed rates to zero within weeks and launched unlimited QE, while fiscal packages like the CARES Act pumped trillions into the economy. Similarly, India announced the Atmanirbhar Bharat stimulus. The lesson: speed and magnitude of support can prevent temporary shocks from becoming long-term depressions.
b. Technology as an Economic Lifeline:
The digital economy emerged as a savior. Remote work, e-commerce, fintech, and cloud computing allowed many sectors to survive and even thrive. The pandemic accelerated the digital transformation of business and finance, leading to greater adoption of digital payments, virtual collaboration, and online education. Lesson: digital infrastructure is not optional—it is a core pillar of economic resilience.
c. The Fragility of Global Supply Chains:
The shutdown of manufacturing hubs in China and other countries exposed how deeply global supply chains were interconnected and vulnerable. The shortage of semiconductors, medical supplies, and essential goods highlighted the risk of over-dependence on a few suppliers. Lesson: economies must build supply chain diversification and strategic self-reliance.
d. Inequality and Social Resilience:
The pandemic widened existing inequalities. While asset prices recovered quickly, millions of small businesses and low-income workers faced lasting damage. Lesson: inclusive recovery must be prioritized; safety nets and targeted fiscal support are crucial for societal stability.
e. Investor Behavior and Market Resilience:
The 2020 crash also showcased how investor psychology had evolved. Retail investors, aided by trading apps and social media, became a dominant force. Markets rebounded sharply, partly due to liquidity and optimism about vaccines and technology. Lesson: information flow, sentiment, and social media can now move markets faster than ever.
3. Common Threads Between 2008 and 2020
Though different in origin, both crises shared key characteristics that reveal the vulnerabilities of modern capitalism.
a. Interconnected Global Systems:
Both crises demonstrated how local shocks quickly became global due to financial, trade, and psychological linkages. Whether it was mortgage-backed securities in 2008 or supply chain disruptions in 2020, the globalized economy magnifies contagion. The lesson: resilience depends on diversification—not isolation.
b. Central Bank Dominance:
In both crises, central banks played an unprecedented role. The Federal Reserve, European Central Bank, and others became the “market backstop.” Their actions stabilized confidence but also increased dependence on monetary intervention. This dependence raises long-term concerns about asset bubbles and debt sustainability.
c. The Importance of Communication and Trust:
Both meltdowns showed that trust is the ultimate currency in a crisis. When financial institutions, governments, or investors lose confidence, panic sets in faster than any policy can react. Transparent communication by policymakers can anchor expectations and prevent spirals of fear.
d. Innovation Follows Crisis:
Both periods triggered innovation. After 2008, fintech and blockchain rose from the ashes of mistrust in traditional banks. After 2020, remote work tech, digital health, and AI-driven analytics became mainstream. History proves: crises often accelerate technological and structural evolution.
4. Lessons for Policymakers
a. Build Buffer Capital and Fiscal Space:
Governments and banks must maintain sufficient reserves for emergencies. High fiscal deficits and excessive leverage before a crisis reduce the ability to respond later. Prudent fiscal management and healthy capital ratios are essential for resilience.
b. Develop Counter-Cyclical Tools:
Automatic stabilizers—such as unemployment benefits and targeted stimulus—can cushion economic shocks. Regulators must enforce counter-cyclical lending and investment practices to prevent overheating during booms.
c. Strengthen Global Coordination:
Global problems require global responses. The 2008 and 2020 crises both highlighted how coordination among G20 nations, IMF, and World Bank was vital. Shared frameworks for debt relief, liquidity swaps, and vaccine distribution illustrate the power of cooperation.
d. Invest in Data and Predictive Systems:
Early warning systems using AI and real-time data could help detect vulnerabilities before they escalate. Governments and financial regulators must embrace data-driven policy frameworks for crisis prevention.
5. Lessons for Financial Institutions
a. Risk Management Must Be Dynamic:
Traditional models failed to predict both crises. Stress testing must account for low-probability, high-impact events like pandemics or geopolitical disruptions. Banks must integrate climate risk, cyber risk, and behavioral risk into their frameworks.
b. Liquidity Is King:
Both meltdowns reinforced that liquidity dries up first in a panic. Institutions must maintain adequate short-term funding buffers. Central banks’ liquidity facilities are a lifeline, but dependence should be reduced through prudent planning.
c. ESG and Sustainable Finance:
The 2020 crisis emphasized environmental and social resilience. Firms with strong ESG principles fared better, reflecting investor preference for sustainability. Lesson: ethics and responsibility are now financial imperatives, not optional ideals.
6. Lessons for Investors
a. Stay Rational Amid Panic:
The biggest losses occur when investors react emotionally. Those who stayed invested or bought during the 2020 crash witnessed record recoveries. Lesson: time in the market often beats timing the market.
b. Diversification Works:
Diversified portfolios—across asset classes, sectors, and geographies—performed better in both crises. Lesson: never rely solely on one market or theme.
c. Long-Term Vision Pays Off:
Both crises produced winners—innovative companies that adapted early. Investors who focused on fundamentals and long-term growth stories reaped massive returns. Lesson: focus on quality, adaptability, and innovation.
7. Structural Shifts Triggered by Crises
a. Rise of Alternative Finance:
Post-2008, distrust in banks led to the growth of fintech, crypto assets, and decentralized finance (DeFi). These innovations democratized finance but also created new regulatory challenges.
b. Work and Consumption Redefined:
After 2020, remote work, digital payments, and online services became embedded in everyday life. Businesses now prioritize resilience over efficiency—shifting from “just-in-time” to “just-in-case” models.
c. Inflation and Monetary Reckoning:
Massive stimulus in 2020 eventually fueled inflationary pressures by 2022–23. This underscored that liquidity without productivity creates long-term imbalances. Lesson: monetary expansion must be matched with real economic output.
8. Preparing for the Next Crisis
While we can’t predict the next meltdown, we can prepare for it. Future shocks might stem from climate change, AI-driven job disruptions, or cyber warfare. The lessons from 2008 and 2020 teach us that flexibility, coordination, and foresight are the best defenses.
Anticipate the Unthinkable: Stress testing and scenario modeling must include black swan events.
Prioritize Human Capital: Education, healthcare, and social safety nets ensure societies rebound faster.
Embrace Sustainable Growth: Over-leverage and short-term gains always backfire.
Enhance Financial Literacy: Empowering individuals to understand risk and debt reduces systemic vulnerability.
Conclusion
The crises of 2008 and 2020 were vastly different in origin—one financial, the other biological—but they shared a common truth: economic systems are only as strong as the trust, transparency, and adaptability they embody. The lessons learned from these meltdowns go beyond economics—they speak to governance, ethics, and collective responsibility.
In both cases, the world witnessed immense pain but also extraordinary recovery and innovation. As we move deeper into an era of digital finance, geopolitical shifts, and environmental challenges, these lessons form the blueprint for building a resilient, equitable, and sustainable global economy—one that learns from its scars and grows stronger after every crisis.
Trading is the Game of ProbabilitiesMost traders start with one simple goal ➜ to be right all the time
🔲Right about the trend.
🔲Right about the breakout.
🔲Right about the trade.
But here’s the truth - 'the market doesn’t care who’s right'.
↳ Even the best analysis fails sometimes.
↳ Even the weakest setup works sometimes.
Because trading isn’t a test of accuracy, it’s a test of managing what is more probable.
↳ Profitable traders don’t chase perfection.
↳ They focus on risk, reward, and consistency.
We can be wrong 6 times out of 10...
And still make money if our winners are bigger than our losers.
↳ Trading success is not about predicting.
↳ It’s about positioning and managing our trade.
We manage risk when the odds are low.
We maximize reward when the odds are high.
The shift happens when we stop trying to be right...
and start thinking in probabilities.
That’s when we stop gambling and start profitable trading.
Are you playing casino or managing your risk?
Markets Dynamics Every Pro Trader Should KnowMarkets move based on fundamental forces that shape pro traders behavior, capital flows, and asset valuations. I will cover the most important concepts that drive market behavior across all asset classes and are fundamental to professional traders.
RISK-ON / RISK-OFF DYNAMICS
The most important concept is the oscillation between risk-on and risk-off sentiment—investor willingness to take on risk in pursuit of returns.
Risk-On: Equities, commodities, high-yield bonds, and risk-sensitive currencies like AUD, NZD rise.
Typical triggers are: positive economic data, easy central bank policies, geopolitical stability.
Risk-Off: Safe-haven assets : USD, JPY, CHF, U.S. Treasuries, gold strengthen. This happens as money managers and investors prioritize capital preservation.
Typical triggers: negative economic data, geopolitical tensions, financial crises.
Why USD strengthens during risk-off:
USD has a global reserve currency status, and that structurally creates demand; deepest treasury market for holding capital; trillions in global debt denominated in USD.
Why JPY strengthens during risk-off:
Carry trade unwinding (investors close positions by buying back yen); Japanese institutions bring back home trillions in foreign assets during crises.
INTEREST RATE DIFFERENTIALS
Capital moves toward countries offering higher real interest rates (real rates = nominal rates minus inflation). This creates currency trends over weeks, months, and years.
Higher interest rates leads to higher bond yields, increasing capital inflows, resulting in currency appreciates
The Carry Trade: Borrow in low-yield currencies (JPY, CHF), invest in high-yield currencies (AUD, NZD), profit from interest rate differential. Carry trades unwind strongly during risk-off times due to leverage and crowded positioning.
INFLATION EXPECTATIONS
Markets trade based on where they expect inflation to be in the future, not current readings. Rising inflation expectations means central banks are likely to tighten policy, hence Bond yields rise and that may lead to currency strengthening initially.
Key metrics: CPI (Consumer Price Index), PCE, core vs. headline inflation, break-even inflation from TIPS spreads.
MONETARY POLICY CYCLES
Central banks are the most powerful players in financial markets. They control interest rates and balance sheet operations.
Tightening Cycle (hiking rates, quantitative tightening): Strengthens currency, negative for equities, bond prices fall, slows economic activity.
Easing Cycle (cutting rates, QE): Weakens currency, positive for equities, bond prices rise, stimulates economic activity.
GLOBAL GROWTH AND COMMODITY CYCLES
Strong global growth means higher demand for energy/metals = Commodity prices rise = Strengthens commodity currencies (AUD, CAD, NOK, BRL).
Key indicators to watch: Global PMIs, global trade data, commodity indices, China growth indicators.
TERMS OF TRADE
When a country's export prices rise more than its import prices, local income increases and currency typically strengthens. Example: Australia's AUD strengthens when iron ore and coal prices rise.
BALANCE OF PAYMENTS
Current account measures trade balance, income flows, and transfers.
Surplus (exports > imports): This accumulates foreign reserves, and generally supports currency.
Deficit (imports > exports): This requires capital inflows to fund deficit, and can pressure currency lower.
FISCAL POLICY AND DEBT DYNAMICS
Government spending and taxation are another dynamic that can influence economic growth and inflation.
Expansionary Policy: Higher spending or lower taxes = short-term growth boost = can increase inflation = increases deficit.
Contractionary Policy: Lower spending or higher taxes (this is know as “austerity”) = slows growth =reduces inflation = improves budget balance.
YIELD CURVE
One of the most important dynamics: it plots interest rates of government bonds across different maturities (2-year, 10-year, 30-year).
Normal/Steep Curve: Growth and inflation optimism, typically supports risk-on sentiment.
Flat Curve: Uncertainty about future growth, usually in late-cycle economies.
Inverted Curve (short rates > long rates): Recession warning. markets expect the central bank to cut rates due to the slowing economy. The inverted curve has preceded almost every U.S. recession in the past half decade.
LIQUIDITY CONDITIONS
Liquidity means availability of credit in the financial system.
High Liquidity: Credit is easy and cheap, supports asset prices, enhances risk appetite. Sources of ample liquidity are central bank QE, low interest rates.
Tight liquidity: Credit becomes scarce and expensive, forces deleveraging, triggers risk-off sentiment. Reasons that can lead to low liquidity are central bank QT, rising rates, banking stress.
BEHAVIORAL & POSITIONING DYNAMICS
When too many investors are positioned the same way (crowded trade), small sentiment changes can trigger strong reversals. Extreme bullishness can signal sell opportunities when everyone is fully invested. Extreme bearishness can signal buy opportunities when selling pressure is exhausted.
Key indicators to measure market positioning are: CFTC positioning data, VIX (volatility index), put/call ratios, fund flow data.
REAL YIELDS
Real Yield = Nominal Yield - Expected Inflation
Rising Real Yields: Stronger currency (attracts foreign capital), weaker gold (higher opportunity cost), pressure on growth stocks.
Falling Real Yields: Weaker currency, stronger gold, support for growth/tech equities.
Real yields drive cross-asset flows through opportunity cost (risk-free alternative return), discount rate changes (affects stock valuations), and dollar funding (global capital flows).
BOTTOM-LINE AND DYNAMICS INTERACTIONS
Markets are driven by multiple forces simultaneously. The strongest moves occur when multiple dynamics align in the same direction. Identify the dominant theme (inflation? growth? central bank policy?), understand asset class implications, look for alignment, and monitor for shifts.
Example Scenario - Fed Aggressive Tightening: Fed raises rates and begins QT → U.S. yields rise → Rising real yields → Tighter liquidity → Risk-off sentiment → USD strengthens, AUD/NZD/EM weaken, gold falls, growth stocks underperform.
Success comes from identifying the dominant market theme, understanding implications across asset classes, looking for alignment when multiple dynamics point in the same direction, and monitoring for theme shifts that can reverse the entire market structure quickly.
If you have questions or need any explanation don't hesitate to drop a comment.
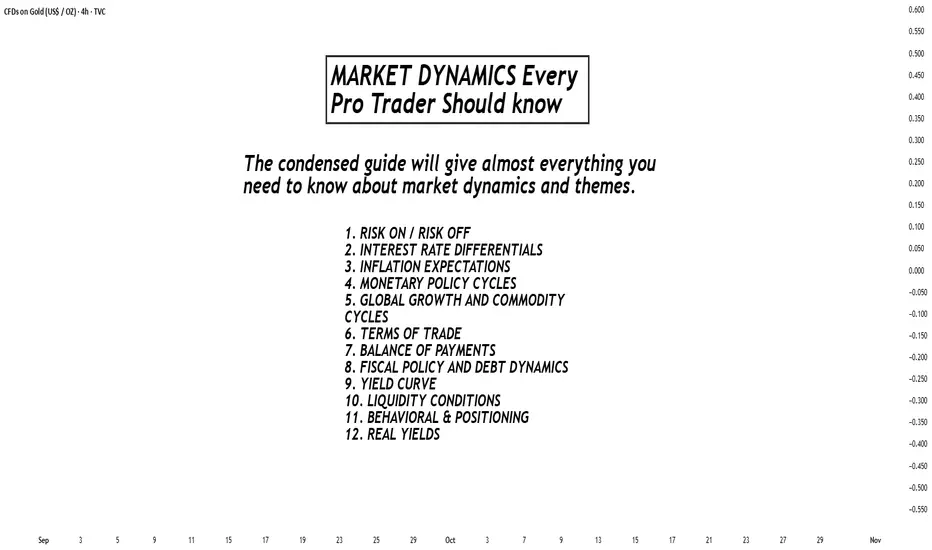
The Interconnected Role of Banks and Financial Markets1. The Foundation: Banking and Market Structures
At the heart of the financial system lie two major components—banks and financial markets—that collectively mobilize and allocate resources.
Banks are institutions that accept deposits and extend loans, serving as a bridge between surplus and deficit units. They play a key role in transforming short-term deposits into long-term credit—a process known as maturity transformation.
Financial markets, on the other hand, provide direct channels for capital raising. Investors buy securities issued by corporations or governments, thus providing funds without the need for traditional bank intermediation.
While both systems perform similar economic functions—mobilizing savings, facilitating investment, and managing risks—the mechanisms differ. Banks rely on balance-sheet intermediation, whereas markets depend on price mechanisms and investor behavior. Over time, the boundary between them has blurred due to financial innovation, deregulation, and globalization.
2. Complementary Functions in Capital Allocation
Banks and financial markets complement each other in channeling funds to productive sectors.
Banks specialize in relationship-based finance. They lend to small and medium-sized enterprises (SMEs), consumers, and sectors where creditworthiness is difficult to assess using market signals. Through continuous relationships, banks monitor borrowers, reduce information asymmetry, and support long-term projects.
Financial markets excel in allocating large-scale capital efficiently. Public corporations issue shares or bonds to raise funds from a diverse investor base, allowing broader participation and liquidity. Market prices serve as signals that guide resource allocation—firms with strong prospects can attract funds easily, while weaker firms face higher costs.
This complementarity ensures that both traditional lending and market-based finance coexist, offering a diversified funding ecosystem. For instance, in emerging markets, banks often dominate due to limited capital market development. In contrast, in advanced economies like the U.S., markets play a larger role, but banks remain critical in supporting households and smaller firms.
3. Interdependence through Financial Instruments
The interaction between banks and markets is not merely functional—it is structural. Banks are active participants in financial markets as investors, borrowers, and intermediaries.
As investors, banks hold government securities, corporate bonds, and even equities as part of their portfolios. These assets help manage liquidity, meet regulatory requirements, and generate income.
As borrowers, banks raise funds in the interbank and bond markets, issuing certificates of deposit (CDs), commercial papers, or subordinated debt.
As intermediaries, they facilitate client transactions, underwrite securities, and provide market-making services.
The development of securitization—where banks pool loans (like mortgages) and sell them as securities—further integrates banks with capital markets. This process frees up bank capital for new lending but also links their balance sheets to market fluctuations. The 2008 Global Financial Crisis demonstrated how deep this interconnection had become: when market liquidity dried up, banks’ asset values plummeted, and credit supply froze, leading to a systemic collapse.
4. Role in Monetary Policy Transmission
The central bank’s monetary policy relies heavily on the interconnectedness of banks and financial markets. Policy instruments such as interest rates, reserve requirements, and open market operations influence both sectors simultaneously.
Through banks, lower policy rates reduce borrowing costs, encouraging credit expansion. Higher rates, conversely, tighten lending and cool demand.
Through financial markets, interest rate changes impact bond yields, stock valuations, and investor sentiment. A cut in rates typically boosts equity prices and lowers bond yields, improving firms’ ability to raise funds.
The policy transmission mechanism, therefore, operates via both the bank-lending channel and the asset-price channel. If either sector weakens—say, if banks are undercapitalized or markets are illiquid—the effectiveness of monetary policy diminishes. Hence, a well-integrated and stable relationship between banks and markets is essential for maintaining macroeconomic stability.
5. Risk Sharing and Financial Stability
A major benefit of interconnectedness is diversified risk sharing. Financial markets distribute risks among a broad base of investors, while banks absorb and manage credit risks internally.
However, this interlinkage can also amplify vulnerabilities. Banks’ exposure to market risks—interest rate, liquidity, and credit spread risks—means that shocks in markets can directly hit bank balance sheets. For example, a sudden rise in bond yields can devalue banks’ holdings, reducing their capital adequacy. Similarly, a decline in stock or real estate prices can increase default risks among borrowers.
To mitigate such contagion, financial regulators emphasize macroprudential policies, stress testing, and capital buffers. The Basel III framework, for instance, requires banks to maintain higher liquidity and leverage ratios to withstand market shocks. Simultaneously, market regulators enforce disclosure and transparency norms to prevent mispricing of risks.
6. The Shift Toward Market-Based Finance
In recent decades, there has been a structural shift from bank-dominated systems to market-based finance, particularly in advanced economies. The rise of institutional investors—such as pension funds, mutual funds, and insurance companies—has reduced firms’ dependence on bank loans. Securitization and shadow banking have expanded credit creation outside the traditional banking system.
This evolution enhances financial flexibility but also introduces new systemic risks. Market-based institutions are less regulated and more sensitive to investor sentiment. During crises, sudden capital outflows or liquidity shortages can trigger chain reactions that eventually affect banks. Hence, central banks now monitor not only banking indicators but also non-bank financial intermediation (NBFI) activities to assess systemic health.
7. Globalization and Cross-Border Interlinkages
Global financial integration has deepened the ties between banks and markets across borders. International banks operate in multiple jurisdictions, participating in global bond, currency, and derivative markets. Capital flows move rapidly in response to policy changes or market shocks, linking domestic systems to global cycles.
For example, when the U.S. Federal Reserve tightens rates, emerging markets often experience capital outflows, currency depreciation, and tighter liquidity conditions. Banks in these countries face funding pressures, while local bond markets witness volatility. The 1997 Asian Financial Crisis and the 2008 Global Financial Crisis both highlighted how cross-border linkages can transmit shocks worldwide.
This interconnectedness calls for international coordination in financial regulation and crisis management. Institutions such as the IMF, BIS, and FSB play vital roles in promoting stability through policy frameworks and global standards.
8. Digitalization and Financial Innovation
The digital era has redefined how banks and markets interact. Fintech, blockchain, and digital payments have blurred traditional boundaries even further. Banks use algorithmic trading, robo-advisory, and tokenized assets to access markets efficiently. Meanwhile, online platforms offer market-based credit (peer-to-peer lending) that competes with bank loans.
While innovation enhances efficiency and inclusion, it also introduces cybersecurity risks, data privacy concerns, and regulatory challenges. Central banks are exploring Central Bank Digital Currencies (CBDCs) to ensure that digital finance remains integrated with the formal monetary system. The next phase of interconnectedness will likely involve hybrid models—where banks act as gateways to decentralized markets while maintaining regulatory oversight.
9. The Role During Economic Crises
During economic downturns or financial crises, the interdependence of banks and markets becomes most visible. When one system falters, the other provides temporary stability—though sometimes at a cost.
In crises like 2008, central banks injected liquidity into both sectors through quantitative easing (QE)—purchasing bonds and securities to stabilize markets and ensure banks had access to funds.
Conversely, when markets freeze, banks become the primary credit providers, cushioning the economy through lending backed by government guarantees.
The COVID-19 pandemic reaffirmed this relationship. As markets crashed, banks played a stabilizing role by extending credit lines, while policy interventions restored confidence in capital markets. Such coordination ensures the continuity of capital flow and prevents systemic collapse.
10. Emerging Market Perspectives
In emerging economies like India, Brazil, and Indonesia, banks traditionally dominate the financial system due to underdeveloped markets. However, the trend is gradually changing as equity and bond markets expand and retail participation grows.
For instance, in India, the rise of corporate bond markets, mutual funds, and Sovereign Gold Bonds (SGBs) has diversified funding channels. Yet, banks remain central to infrastructure financing and SME lending—areas where markets are less effective. The integration between banks and markets is therefore essential for mobilizing long-term capital, especially for nation-building projects.
Regulatory bodies like the Reserve Bank of India (RBI) and SEBI coordinate to align monetary and market policies, ensuring balance between credit growth and capital market stability.
11. Policy Implications and the Need for Balance
The interconnectedness between banks and markets creates both opportunities and risks. Policymakers must strike a balance between efficiency, innovation, and stability.
Excessive dependence on banks can limit credit diversification and expose economies to concentrated risks.
Overreliance on markets can lead to speculative bubbles and volatility.
Thus, a hybrid financial architecture—where banks and markets complement each other—is most desirable. Regulations should encourage market deepening while ensuring that banks remain well-capitalized and resilient.
Coordinated oversight, robust information systems, and global cooperation are crucial. Transparency in both banking operations and market transactions helps prevent contagion and enhances investor confidence.
12. Conclusion: An Integrated Financial Ecosystem
The relationship between banks and financial markets is not one of competition, but of mutual reinforcement. Together, they form an integrated ecosystem that fuels economic growth, manages risks, and supports innovation. Their interconnection ensures that savings are efficiently transformed into investments, liquidity is maintained across sectors, and monetary policy reaches its intended targets.
As the global economy evolves—driven by technology, globalization, and sustainability—this partnership will become even more intricate. The challenge for regulators, investors, and policymakers is to harness the benefits of this interconnectedness while minimizing systemic vulnerabilities. A stable, transparent, and adaptive financial system—where banks and markets coexist harmoniously—is the cornerstone of a resilient global economy.
