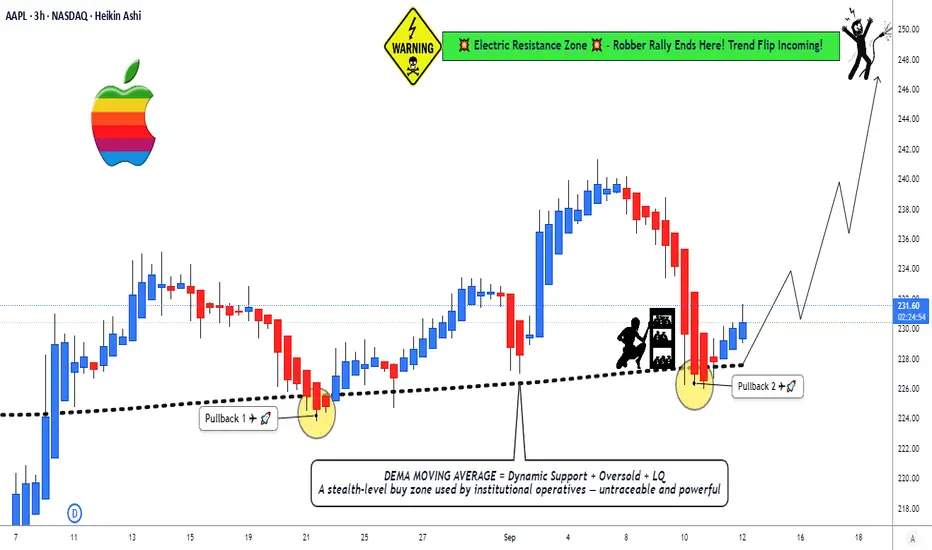
AAPL at Dynamic Support: Trade the Bounce!🍎 AAPL Swing/Day Trade: The Great Apple Heist Plan 🚨
Asset: AAPL (Apple Inc. Stock)
Market: US Stock
MarketVibe: Bullish, sneaky, and ready to loot some profits! 💰
📜 The Master Plan: Bullish EMA Pullback Heist
🎯 Strategy: We're pulling off a slick Double Exponential Moving Average (DEMA) pullback plan, targeting a breakout at dynamic support levels. Think of it as a high-stakes caper where we sneak in, grab the profits, and escape before the market knows what hit it! 😎
🔑 Key Setup Details:
Chart Setup: AAPL is showing a bullish setup with a DEMA pullback, signaling a potential swing or day trade opportunity.
Dynamic Line: We’re eyeing the DEMA as our guiding star 🌟 for entries and exits.
🚪 Entry: The Sneaky Thief Layering Strategy
🔍 How to Enter: Deploy the Thief Layering Strategy with multiple buy limit orders to maximize your entry precision:
🤑 Buy Limit Layers: Place orders at $227, $228, $229, $230 (or add more layers based on your risk appetite — you’re the mastermind here!).
💡 Pro Tip: Feel free to adjust entry levels to suit your style. The market’s your playground, so pick your spot!
🛑 Stop Loss: Protect Your Loot!
⚠️ Thief SL: Set your stop loss at $224 post-breakout to guard your stash.
Note: Dear Ladies & Gentlemen (Thief OGs 🕵️♂️), this SL is a suggestion. Adjust it based on your strategy and risk tolerance. You’re in charge of your heist, so protect your loot your way!
🎯 Target: Hit the Jackpot & Escape!
💥 Profit Target: Aim for $248, where a high-voltage resistance wall ⚡️ awaits, potentially paired with overbought conditions and a sneaky trap. Grab your profits and vanish before the market catches on!
Note: Dear Thief OGs, this target is a suggestion. Set your TP based on your goals and risk management. Take the money and run at your own discretion! 😏
👀 Related Pairs to Watch (Correlations & Opportunities)
To boost your heist, keep an eye on these correlated assets:
NASDAQ:MSFT (Microsoft): Tech giant with similar market moves to AAPL. If AAPL’s bullish, MSFT might follow suit. Watch for parallel DEMA pullbacks.
NASDAQ:QQQ (Invesco QQQ ETF): Tracks the Nasdaq-100, where AAPL is a heavy hitter. QQQ’s trend can confirm AAPL’s bullish momentum.
AMEX:SPY (SPDR S&P 500 ETF): Broad market index. If SPY’s trending up, it supports AAPL’s bullish case.
Key Correlation Insight: AAPL often moves in tandem with tech-heavy indices like QQQ. A bullish QQQ or MSFT can reinforce confidence in this trade setup.
⚡ Why This Setup Rock
Bullish Momentum: DEMA pullback signals a strong continuation pattern.
Layered Entries: Multiple limit orders reduce risk and increase flexibility.
Clear Risk Management: Defined SL and TP keep your heist disciplined.
Market Context: Tech sector strength (check QQQ/MSFT) supports AAPL’s upward move.
⚠️ Risk Disclaimer
Dear Thief OGs, this is not financial advice. The market’s a wild place, and you’re the master of your trades. Set your SL and TP based on your own risk tolerance and strategy. Steal profits wisely! 😎
✨ “If you find value in my analysis, a 👍 and 🚀 boost is much appreciated — it helps me share more setups with the community!”
#Hashtags: #AAPL #SwingTrading #DayTrading #StockMarket #ThiefStrategy #TechnicalAnalysis #Bullish #TradingView
AAPL
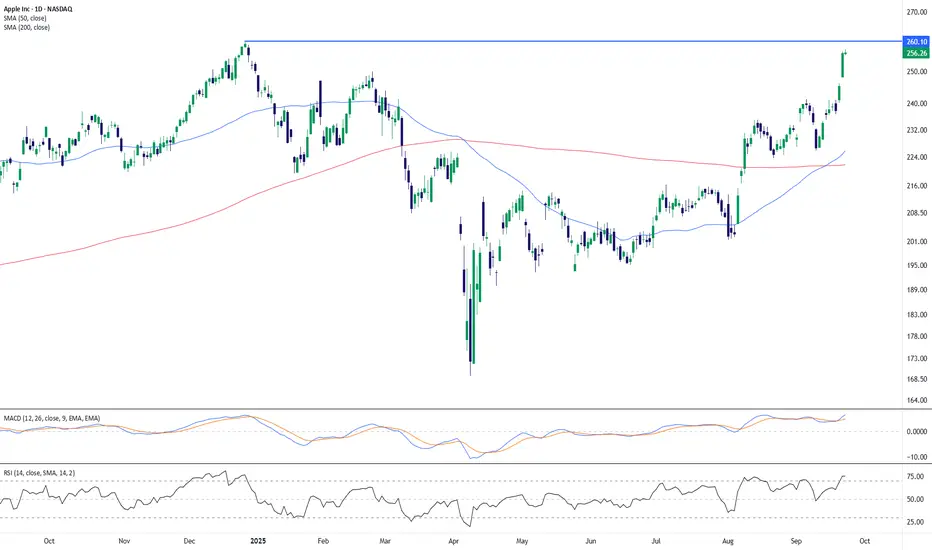
AAPL Approaches Key Resistance After Strong RallyApple’s share price has staged a sharp rebound in recent weeks, climbing above both the 50-day (225.78) and 200-day SMA (221.80). The sustained move higher has carried price into the 256–260 zone, where it is now testing a major horizontal resistance level established earlier this year.
Momentum indicators reflect the strength of the rally but also highlight stretched conditions. The RSI sits at 75, signaling overbought territory, while the MACD remains firmly above its signal line, showing ongoing bullish momentum. These readings suggest strong buying pressure, though the risk of a pause or pullback near resistance should not be overlooked.
A confirmed breakout above 260 would mark a significant technical shift, potentially resuming the broader uptrend, while failure to clear this level could see consolidation or a retracement back toward the short-term moving averages.
-MW
APPLE Buyers In Panic! SELL!
My dear subscribers,
APPLE looks like it will make a good move, and here are the details:
The market is trading on 245.18 pivot level.
Bias - Bearish
My Stop Loss - 247.18
Technical Indicators: Both Super Trend & Pivot HL indicate a highly probable Bearish continuation.
Target - 241.25
About Used Indicators:
The average true range (ATR) plays an important role in 'Supertrend' as the indicator uses ATR to calculate its value. The ATR indicator signals the degree of price volatility.
Disclosure: I am part of Trade Nation's Influencer program and receive a monthly fee for using their TradingView charts in my analysis.
———————————
WISH YOU ALL LUCK

Huge Dark Pools and Prints... Will this time be Different?Stock Market Forecast | Mag 7 TSLA NVDA AAPL AMZN
QQQ CME_MINI:NQ1! CME_MINI:ES1! SP:SPX NASDAQ:NDX stock market Forecast

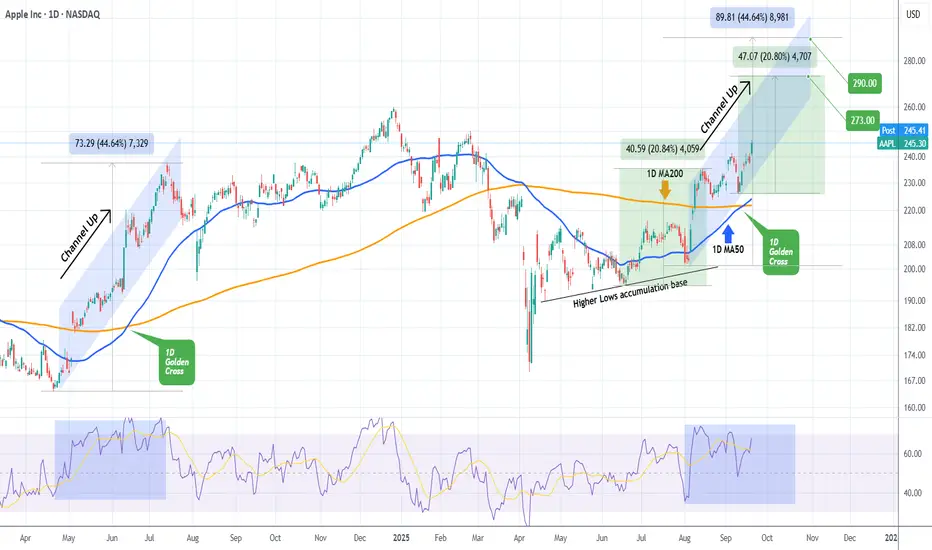
APPLE made first 1D Golden Cross in over a year!Apple Inc. (AAPL) completed this week its first 1D Golden Cross in over 1 year (since June 13 2024). The price has posted a strong 1D candle today on positive iPhone 17 fundamentals and it appears that the price is extending the very same Channel Up it had in May - July 2024.
If the current pattern ends the same way eventually as the 2024 fractal, expect a +44.64% rise with a $290.00 Target.
However the rally may stop a little lower at $273.00 if it follows the previous +20.80% Bullish Leg of the more recent June 18 - August 13 2025 run.
We will be more than satisfied with the less optimistic scenario nonetheless.
-------------------------------------------------------------------------------
** Please LIKE 👍, FOLLOW ✅, SHARE 🙌 and COMMENT ✍ if you enjoy this idea! Also share your ideas and charts in the comments section below! This is best way to keep it relevant, support us, keep the content here free and allow the idea to reach as many people as possible. **
-------------------------------------------------------------------------------
💸💸💸💸💸💸
👇 👇 👇 👇 👇 👇
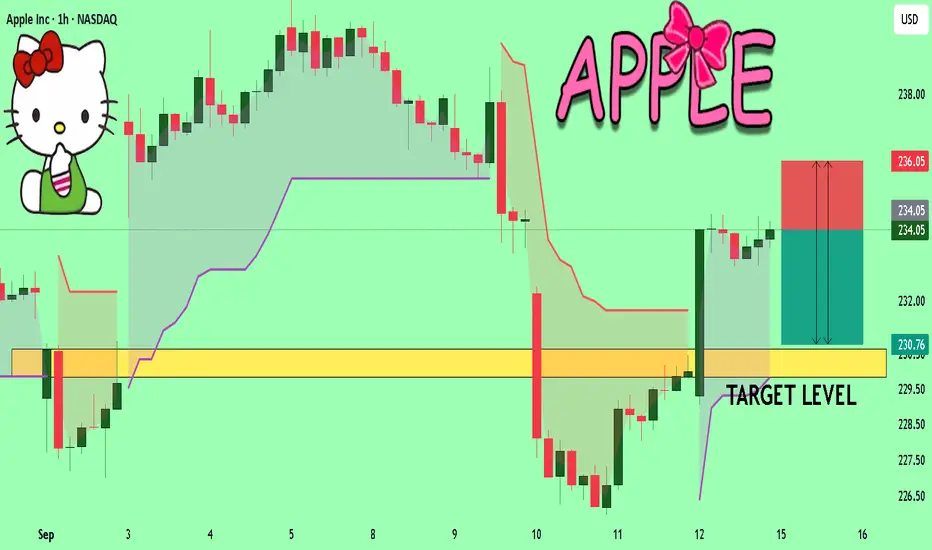
APPLE Set To Fall! SELL!
My dear friends,
APPLE looks like it will make a good move, and here are the details:
The market is trading on 234.05 pivot level.
Bias - Bearish
Technical Indicators: Supper Trend generates a clear short signal while Pivot Point HL is currently determining the overall Bearish trend of the market.
Goal - 230.63
Recommended Stop Loss - 236.05
About Used Indicators:
Pivot points are a great way to identify areas of support and resistance, but they work best when combined with other kinds of technical analysis
Disclosure: I am part of Trade Nation's Influencer program and receive a monthly fee for using their TradingView charts in my analysis.
———————————
WISH YOU ALL LUCK
Huge Dark Pools... Will This Time be Any Different?QQQ CME_MINI:NQ1! CME_MINI:ES1! stock market Forecast
Nvidia Stock NASDAQ:NVDA Forecast
Apple Stock AAPL Forecast
Microsoft Stock MSFT Forecast
Google Stock GOOGL Forecast
Amazon Stock AMZN Forecast
Meta Forecast Technical Analysis
Tesla Stock NASDAQ:TSLA Forecast
Magnificent 7 stocks forecast

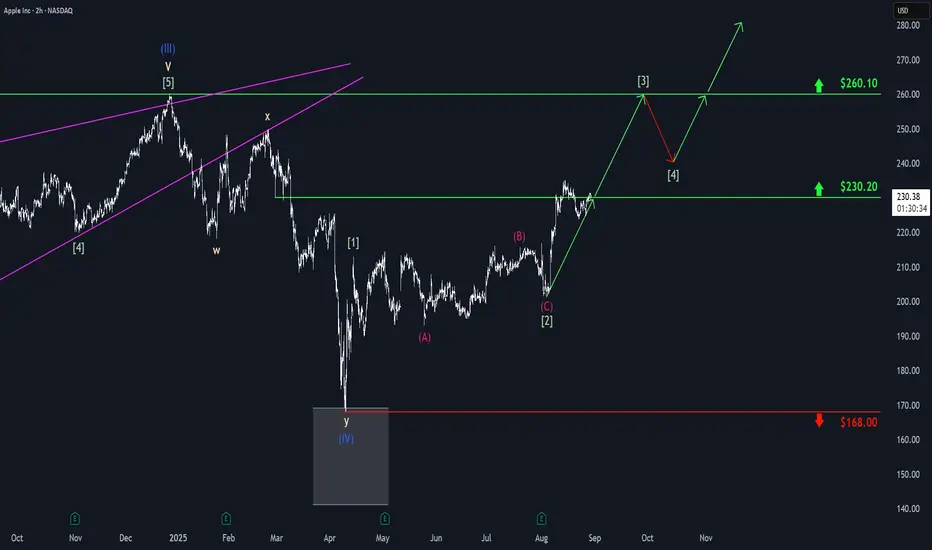
Apple: Pulling Back, but Uptrend Still IntactApple has recently faced substantial downward pressure, retracing enough to erase the gains made in the first week of September. Our primary outlook is that the stock will soon rebound and, during green wave , rise toward resistance at $260.10. Following a moderate pullback in wave , shares should ultimately break through this level in wave , further advancing the broader upward trend. However, we continue to monitor our 37% likely alternative scenario. In this case, AAPL would have completed beige wave alt.b with its recent peak and could next target a new major low for blue wave alt.(IV) via wave alt.c . Here, the price would fall below support at $201.50 but ideally rebound above the lower mark at $168.

Apple Shares (AAPL) Fall After iPhone 17 LaunchApple Shares (AAPL) Fall After iPhone 17 Launch
Yesterday, Apple unveiled its new products, including the iPhone 17. The new model features a sleeker form factor, an improved display and battery, and a new processor. However, analysts believe the model lacks the breakthrough impact needed to drive the stock higher.
The charts confirm this: while the main stock indices rose yesterday, AAPL shares fell by around 1.5%.
Technical Analysis of Apple Shares (AAPL)
When analysing the chart six days ago, we:
→ confirmed the upward channel (shown in blue);
→ highlighted the $235 support level;
→ suggested that while AAPL stock could maintain upward momentum, disappointment over the new product launch might trigger a correction.
In addition to the AAPL price action we noted earlier, several bearish signals on the hourly chart support the correction scenario:
→ a long upper shadow (marked with an arrow);
→ aggressive price action when breaking the $235 support;
→ bearish divergences on the RSI indicator.
Bulls might find support at line S, which is part of a fan drawn from the starting point of the bullish impulse on 6 August.
However, if bearish sentiment persists, price action could unfold within the structure shown in red (potentially a bull flag pattern inside the prevailing bullish trend). Bearish pressure could aim to push AAPL shares down towards the median of the red channel.
In that case, bulls may find support in the area where several lines converge:
→ the lower rays of the fan (shown in orange);
→ the psychological $230 level (which has repeatedly switched roles between resistance and support since August);
→ the median of the blue channel;
→ the lower boundary of the bullish gap from 2 September.
This article represents the opinion of the Companies operating under the FXOpen brand only. It is not to be construed as an offer, solicitation, or recommendation with respect to products and services provided by the Companies operating under the FXOpen brand, nor is it to be considered financial advice.
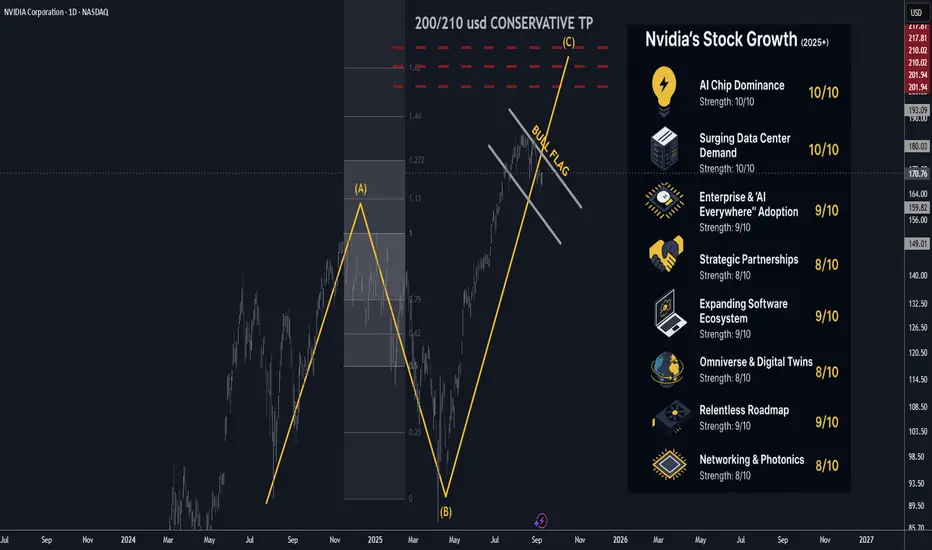
Nvidia (NVDA) 2025+ Catalysts Updated: Analyst Views September🚀 Nvidia (NVDA) 2025+ Catalysts & Risks: Analyst Views — Updated September 2025
________________________________________
📝 Summary Outlook (September 2025)
Nvidia remains at the center of the global AI boom, with dominant GPU share, a strengthening networking/software moat, and multi-year sovereign and enterprise buildouts driving demand. Q2 FY26 confirmed strong momentum, while Q3 guidance points to continued growth. The main risks lie in tariff policy, China licensing, supply chain tightness, and valuation sensitivity. Street consensus remains bullish, with targets in the $207–$211 range and a Strong Buy bias.
🔑 Key Catalysts Driving Nvidia’s Stock Growth (2025+)
1. 🏆 AI Chip Dominance — Score: 10/10
Nvidia still commands ~90%+ of data-center AI accelerators, with CUDA/NVLink lock-in keeping switching costs high.
2. 🏗️ Surging Data Center Demand — Score: 10/10
Hyperscalers remain in an AI “build” cycle. 2025 data-center CapEx is approaching ~$300B, with Nvidia reporting record $41.1B Data Center revenue in its latest quarter.
3. 🌐 Enterprise & “AI Everywhere” Adoption — Score: 8.7/10
Companies across industries are rolling out AI assistants, copilots, and retrieval-augmented applications; Nvidia benefits via GB200 NVL72 racks and RTX-based inference at the edge.
4. 🤝 Strategic/Channel Partnerships — Score: 8.9/10
Cisco is integrating Spectrum-X into networking solutions, while HPE has expanded its Nvidia “AI factory” offerings—broadening reach into enterprise and hybrid AI buildouts.
5. 🚗 Automotive & Robotics — Score: 8.4/10
Auto revenue grew ~70% Y/Y; DRIVE Thor shipments have begun, and Nvidia’s Jetson/AGX Thor and robotics platforms are expanding into industrial automation.
6. 🧑💻 Software & Subscriptions — Score: 8.6/10
Nvidia’s AI Enterprise, DGX Cloud, CUDA-Q, and TensorRT deepen recurring, high-margin revenue and increase developer lock-in.
7. 🌎 Omniverse, Digital Twins & Industrial AI — Score: 8.2/10
Ansys, Siemens, and other industrial software vendors are embedding Omniverse into simulation suites, accelerating adoption of “digital twins” and simulation AI workflows.
8. 🛜 Networking & Photonics — Score: 8.8/10
Spectrum-X Photonics enables co-packaged optics for exascale “AI factories,” improving bandwidth and efficiency while giving Nvidia more end-to-end control.
9. 🧪 Relentless Roadmap (Blackwell → Rubin) — Score: 9.0/10
Blackwell Ultra is ramping into 2025, with the Rubin architecture slated for 2026—sustaining Nvidia’s upgrade cycles.
10. 🌍 Sovereign & Global AI Buildouts — Score: 8.5/10
Europe, the Middle East, and India are launching sovereign AI projects. Saudi-backed Humain alone has committed to tens of thousands of Blackwell chips for 2026 buildouts.
________________________________________
📈 Latest Analyst Recommendations (September 2025)
• Street Stance: Strong Buy/Overweight remains dominant. ~85% of analysts rate NVDA a Buy; avg 12-mo PT ~$207–$211.
• Recent Calls: Multiple firms reiterated Overweight/Buy, with price targets up to $230.
• Common Bull Case: Nvidia’s accelerator lead, software moat, sovereign/enterprise AI pipeline, and expanding networking portfolio.
• Common Cautions: Premium valuation, competition from custom silicon, and export/tariff risk.
________________________________________
🗞️ Latest Events & News (Aug–Sep 2025)
• Q2 FY26 results (reported Aug 27, 2025): Revenue $46.7B (+56% Y/Y); Data Center $41.1B; Blackwell shipments +17% Q/Q; buyback program boosted by $60B.
• Q3 FY26 guidance: ~$54B (±2%) revenue.
• Networking push: Spectrum-X Photonics unveiled; Cisco partnership expanding enterprise deployments.
• Omniverse OEM deal: Ansys to embed Omniverse tech within its simulation platforms.
• Sovereign AI momentum: Saudi Humain centers to deploy 18k+ Blackwell chips starting 2026; UAE and India also ramping large-scale AI initiatives.
• Ecosystem investing: Nvidia continues selective investments in AI startups, strengthening CUDA adoption.
________________________________________
🇺🇸🇨🇳 US–China Tariffs & Export Controls — September 2025 Update
• Tariff truce extended (Aug 2025): Current tariffs remain at ~30% U.S. on Chinese imports and ~10% reciprocal from China. Next decision point: Nov 10, 2025.
• Supreme Court review: The Court will hear a case challenging U.S. executive authority on tariffs this fall.
• China export licensing: U.S. has begun granting licenses for Nvidia’s H20 China-compliant GPUs. Advanced Blackwell exports remain restricted without further approvals.
Impact on Nvidia: Truce reduces near-term disruption, but future tariff or licensing changes remain key risks. China sales are limited to compliant GPUs with lower margins.
________________________________________
⚠️ Key Negative Drivers & Risks (Updated)
1. 🇨🇳 US–China Tech Policy
Tariff truce is temporary; licensing decisions and court rulings keep China exposure uncertain.
2. 🏛️ Regulatory/Legislative Overhang
Proposals like the GAIN AI Act could impose stricter controls on exports and prioritize domestic deployments.
3. 🏭 Supply Chain Bottlenecks
Advanced packaging and HBM memory remain tight despite expansions—potential bottlenecks for shipments.
4. 🧮 Competitive Threats & Custom Silicon
AMD, Intel, and hyperscaler-designed accelerators continue to advance, potentially eroding Nvidia’s hyperscale share.
5. 🏷️ Valuation & Expectations
Nvidia trades at high multiples; any slowdown or guidance miss could trigger volatility.
6. 💵 Customer Concentration
Top cloud giants still account for a large share of revenue; CapEx pauses or custom chip adoption would materially impact results.
________________________________________
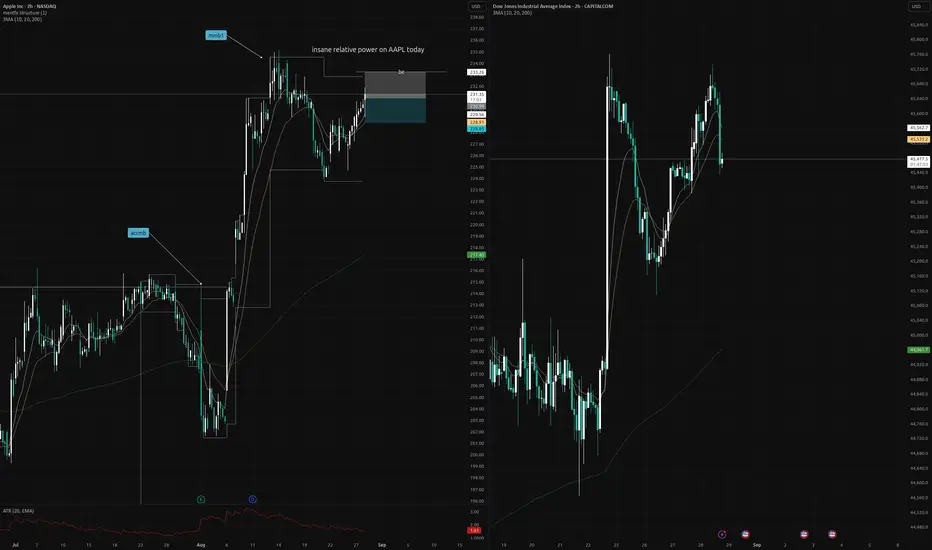
AAPL relative strength to US30 today Because APPLE is going up but US30/US2000 is falling like crazy, we can say that APPLE is one of the strongest stock in comparison with the overall stock market in US
What you think about this trade?
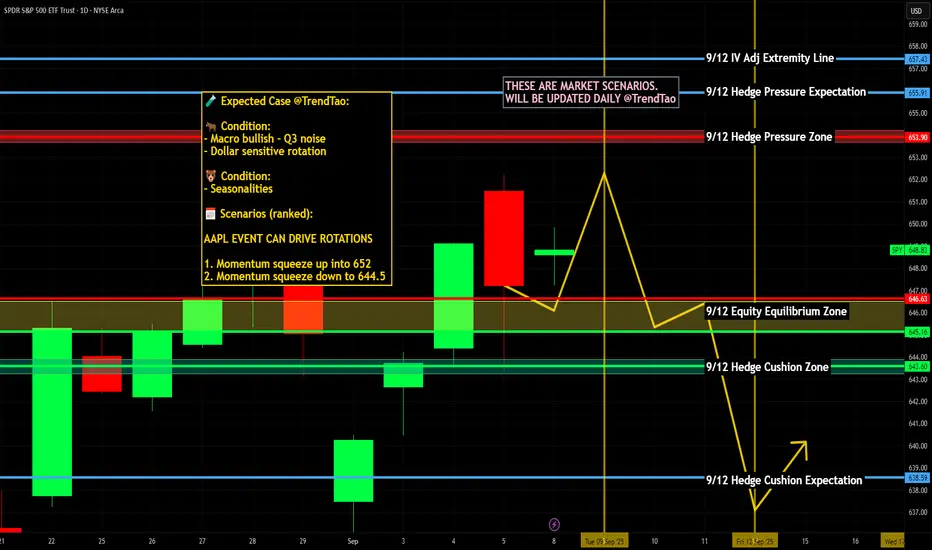
$SPY / $SPX Scenarios — Tuesday, Sept 9, 2025🔮 AMEX:SPY / SP:SPX Scenarios — Tuesday, Sept 9, 2025 🔮
🌍 Market-Moving Headlines
🚩 Small Biz Pulse: NFIB report before the open — insight into hiring & inflation expectations.
🍏 Apple Mega-Cap Event: 1 PM ET — expected iPhone 17 lineup, Apple Watch, AirPods updates. Mega-cap headline risk for NASDAQ:AAPL and $XLK.
📉 Tape Watch: Traders positioning ahead of 🚩 PPI (Wed) and 🚩 CPI (Thu).
📊 Key Data & Events (ET)
⏰ 🚩 6:00 AM — NFIB Small Business Optimism (Aug)
⏰ 10:00 AM — Wholesale Inventories (Jul, rev.)
⏰ 🍏 1:00 PM — Apple Product Launch Event
⚠️ Disclaimer: Educational/informational only — not financial advice.
📌 #trading #stockmarket #SPY #SPX #AAPL #AppleEvent #NFIB #inflation #tech #MegaCap
APPL Breakout Play: Ride Momentum w/ $250 Calls
# 🚀 APPL Swing Trade Setup (2025-09-07)
**Bias:** 🔥 Bullish (multi-timeframe momentum confirmed)
**Conviction:** ⭐⭐⭐⭐ (75%)
### 📊 Key Takeaways
* ✅ Daily RSI = 73.3 → strong momentum
* ✅ Multi-timeframe alignment → bullish trend continuation
* ⚠️ Volume = \~1.0x avg → breakout needs confirmation
* ⚖️ Options flow = neutral (C/P \~1.0) → no big institutional push
* 🌐 VIX \~15 → low vol = cheap calls
---
### 🎯 Trade Plan
* **Instrument:** \$APPL
* **Direction:** CALL (single-leg)
* **Strike:** \$250
* **Expiry:** 2025-09-19
* **Entry Price:** 0.78 (ask)
* **Profit Target:** 1.56 (≈100% gain)
* **Stop Loss:** 0.47 (\~40% risk)
* **Size:** 1 contract (adjust to 2% account risk)
* **Entry Timing:** Open (or breakout > \$241.5 + volume)
---
### 🧠 Rationale
* \$250 strike = liquid (OI 36k+) & balanced delta/liquidity
* Low VIX keeps theta drag manageable (12 DTE)
* Upside continuation likely toward \$246–\$250 zone
* Defined risk/reward w/ simple naked call
---
### ⚠️ Risks
* ❌ Failed breakout → fast premium decay
* ⏳ Time decay accelerates after 7–8 DTE
* 📰 Macro/news shocks = whipsaw risk
---
## 📌 TRADE DETAILS (JSON)
```json
{
"instrument": "APPL",
"direction": "call",
"strike": 250.0,
"expiry": "2025-09-19",
"confidence": 0.75,
"profit_target": 1.56,
"stop_loss": 0.47,
"size": 1,
"entry_price": 0.78,
"entry_timing": "open",
"signal_publish_time": "2025-09-07 13:19:26 EDT"
}
```
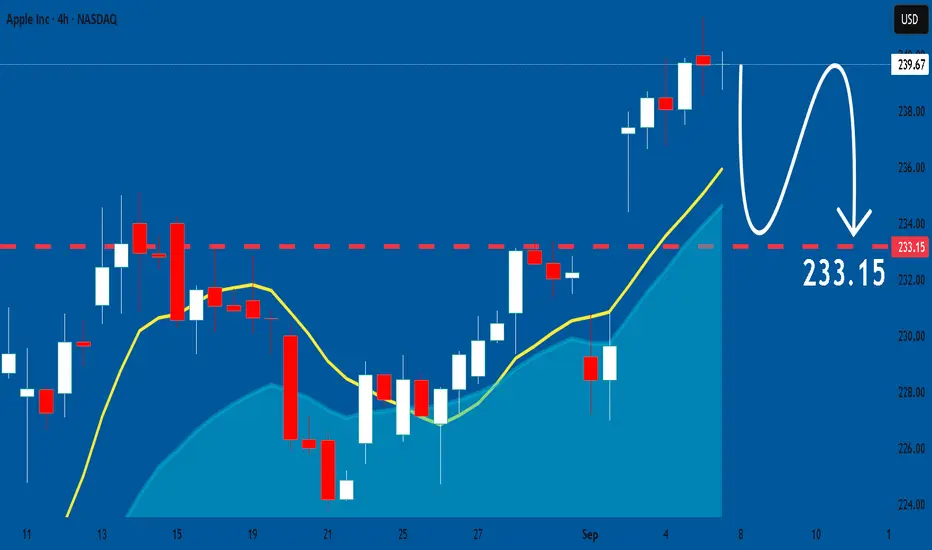
APPLE Massive Short! SELL!
My dear friends,
Please, find my technical outlook for APPLE below:
The price is coiling around a solid key level - 239.67
Bias - Bearish
Technical Indicators: Pivot Points High anticipates a potential price reversal.
Super trend shows a clear sell, giving a perfect indicators' convergence.
Goal - 234.66
About Used Indicators:
The pivot point itself is simply the average of the high, low and closing prices from the previous trading day.
Disclosure: I am part of Trade Nation's Influencer program and receive a monthly fee for using their TradingView charts in my analysis.
———————————
WISH YOU ALL LUCK
Will Bears Follow Through after Terrible Job Numbers?QQQ CME_MINI:NQ1! CME_MINI:ES1! stock market Forecast
Nvidia Stock NASDAQ:NVDA Forecast
Apple Stock AAPL Forecast
Microsoft Stock MSFT Forecast
Google Stock GOOGL Forecast
Amazon Stock AMZN Forecast
Meta Forecast Technical Analysis
Tesla Stock NASDAQ:TSLA Forecast
Magnificent 7 stocks forecast

AAPLE Inc. High Probale Plummet To Be TriggeredAAPL which has been on a quite an ecstacy in the past few weeks might have its Joy short-lived due to activities its did below. Activities being 'The change of character"
APPLE: Will Start Falling! Here is Why:
The price of APPLE will most likely collapse soon enough, due to the supply beginning to exceed demand which we can see by looking at the chart of the pair.
Disclosure: I am part of Trade Nation's Influencer program and receive a monthly fee for using their TradingView charts in my analysis.
❤️ Please, support our work with like & comment! ❤️
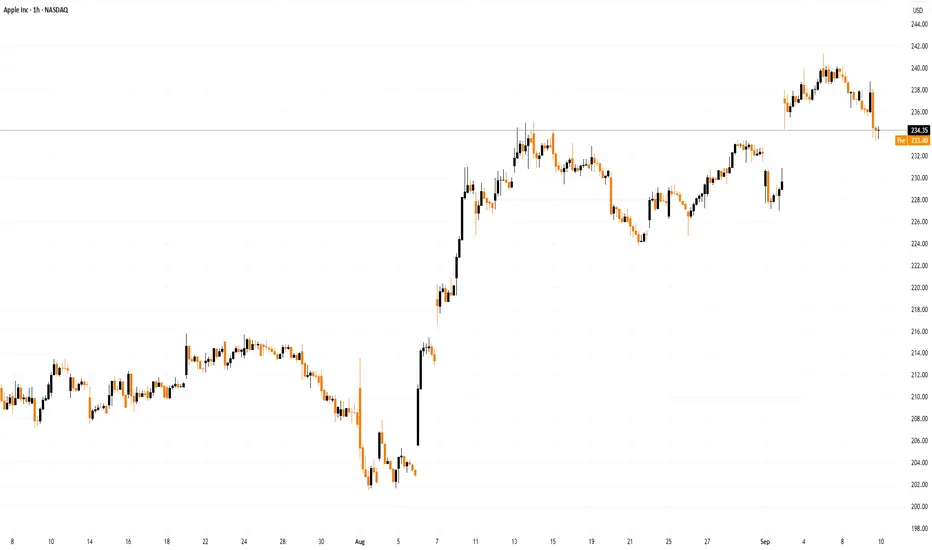
Apple (AAPL) Shares Jump to a Six-Month HighApple (AAPL) Shares Jump to a Six-Month High
As the AAPL chart shows, yesterday the price rose above $238 – its highest level since early March.
The optimistic sentiment was fuelled by:
→ A court ruling concerning Google, which we reported on yesterday. Apple shares advanced after the court allowed Alphabet to continue paying Apple for preloading Google Search on the iPhone. Bank of America analysts even raised their AAPL price target to $260.
→ The upcoming Apple presentation scheduled for 9 September. Expectations are that the event could unveil the iPhone 17 and new Apple Watch models, which may provide a bullish catalyst.
Technical Analysis of Apple (AAPL) Stocks
Analysing the chart in early August, we:
→ identified an ascending channel (shown in blue);
→ noted that, given the aggressive rally (accompanied by bullish gaps) and a strong fundamental backdrop, any corrections were likely to be limited.
Since then:
→ AAPL has moved higher, justifying the expansion of the blue channel;
→ the pullback (marked by an arrow) was minor, as expected, confirming the median line of the expanded channel as support;
→ in the short term, we could identify grounds for a new upward trajectory (shown in orange).
Yesterday’s price action in AAPL:
→ produced a wide bullish gap at the open (which may act as support);
→ broke through the long-term descending trendline (R), which had been acting as resistance;
→ indicated that the $235 level (around the August high) now functions as support.
Within this context, we could assume that:
→ in the short term, AAPL may maintain its upward trajectory within the orange channel;
→ in the longer term, bulls may target the upper boundary of the blue channel – located near the psychological $250 mark. Reaching this level could trigger stronger selling pressure.
In the event of a significant correction (for example, due to disappointment with new product launches), potential support levels could include:
→ the median of the blue channel;
→ the trendline R.
This article represents the opinion of the Companies operating under the FXOpen brand only. It is not to be construed as an offer, solicitation, or recommendation with respect to products and services provided by the Companies operating under the FXOpen brand, nor is it to be considered financial advice.
$GOOG $226 Premarket! 2.61 Golden Pocket Above for Puts Well what do we have here? We have Taz taking a peak at the GOOGLE pop 👀 would you just look at it? If you put the fib right at the last high and low, you get a nice Golden Pocket Target Above at $228.97 …
Now let’s be clear here. Congrats to the Bulls in my Room that saw that Alert from the Bot and Hopped in with the Big Boys.
For now, it’s time to go with tie short side imo. If we can get a tap of that 2.61 pocket above, I’ll swing something to the downside for next week. Targets would include a Gap fill. If not, then I will be patient and possibly not even enter. I would rather optimal entry. Then forced entry. Have a good one yall.

AMD (2025+) Catalysts & Risks: 300 USD PT Bulls🟥 AMD (2025+) Catalysts & Risks: Analyst Views
________________________________________
🔑 Key Catalysts Driving AMD’s Stock Growth (2025+)
🌌 Quantum-Centric Supercomputing with IBM
AMD’s collaboration with IBM to merge CPUs/GPUs with quantum computing promises a whole new class of hybrid architectures. If successful, this could unlock brand-new compute markets in research, defense, and enterprise.
Impact Score: 9.5/10
🏗️ Hyperscaler Traction & Data-Center GPU Gains
AMD’s MI355 and upcoming MI400 accelerators are gaining traction with big cloud players. Even a modest 10% market share in AI GPUs would be transformative for AMD’s revenue mix.
Impact Score: 9/10
📈 Analyst Upgrades & Bullish Price Targets
Wall Street has turned bullish—multiple PT hikes point to 20–40% upside. Analyst enthusiasm often accelerates institutional inflows, reinforcing AMD’s momentum.
Impact Score: 7.5/10
🌍 Global AI Accelerator Growth & Middle East Expansion
AMD is securing multi-billion sovereign AI infrastructure deals in the Gulf (Saudi, UAE). These large-scale contracts validate AMD’s credibility as a true Nvidia alternative.
Impact Score: 8.5/10
💰 Strong Financial Performance & Executive Optimism
Q1 results crushed expectations with revenue and profit growth across data center and AI. Sustained beats strengthen AMD’s credibility and support multiple expansion.
Impact Score: 8/10
🔗 Broad Ecosystem & Strategic Acquisitions
Acquisitions like Xilinx and Silo AI give AMD a richer portfolio spanning FPGAs, AI software, and custom servers (Helios). This positions AMD as more than just a chipmaker—an AI infrastructure player.
Impact Score: 7/10
________________________________________
⚠️ Key Negative Drivers & Risks
🇨🇳 China Export Restrictions
AMD is losing access to a massive end market due to US export rules. This already shaved off ~$1B in projected sales and could worsen with future policy shifts.
Risk Severity: 9/10
📉 Under-whelming AI GPU Sell-In
Past misses on data-center GPU sales remind investors that adoption is not guaranteed. If hyperscalers hesitate, AMD’s AI growth story could stall.
Risk Severity: 7.5/10
💸 Valuation & Excess Rally Risks
Shares are up massively YTD—if results don’t keep pace, profit-taking could spark sharp pullbacks.
Risk Severity: 7/10
⚡ Short-Term Volatility & Earnings Reaction
Even with growth, near-term misses or cautious guidance could swing the stock hard.
Risk Severity: 6.5/10
🥊 Competitive Pressure
Nvidia’s CUDA ecosystem remains deeply entrenched, while custom silicon from hyperscalers (Google TPUs, AWS Trainium) eats into the TAM. AMD is fighting uphill.
Risk Severity: 8/10
________________________________________
📝 Summary Outlook (Sept 2025)
AMD is no longer the underdog—it’s becoming a legitimate AI infrastructure contender. The IBM quantum partnership and hyperscaler adoption of MI400 GPUs could be game-changers. Sovereign AI deals in the Middle East and ecosystem-expanding acquisitions amplify the story.
But execution risk is high—China export bans, entrenched Nvidia dominance, and valuation stretch leave little room for error. Success hinges on AMD proving it can scale its AI GPUs and secure recurring demand.
Rank Catalyst 🚀 Score (0–10)
1⃣ 🌌 Quantum-Centric Supercomputing with IBM 9.5
2⃣ 🏗️ Hyperscaler GPU Adoption (MI355/MI400) 9
3⃣ 🌍 Middle East AI Mega Deals 8.5
4⃣ 💰 Strong Financial Growth 8
5⃣ 📈 Analyst Upgrades & PT Revisions 7.5
6⃣ 🔗 Ecosystem & Acquisitions (Xilinx, Silo AI, Helios) 7

Is September For the Bears?QQQ CME_MINI:NQ1! CME_MINI:ES1! stock market Forecast
Nvidia Stock NASDAQ:NVDA Forecast
Apple Stock NASDAQ:AAPL Forecast
Microsoft Stock MSFT Forecast
Google Stock GOOGL Forecast
Amazon Stock AMZN Forecast
Meta Forecast Technical Analysis
Tesla Stock TSLA Forecast
Magnificent 7 stocks forecast

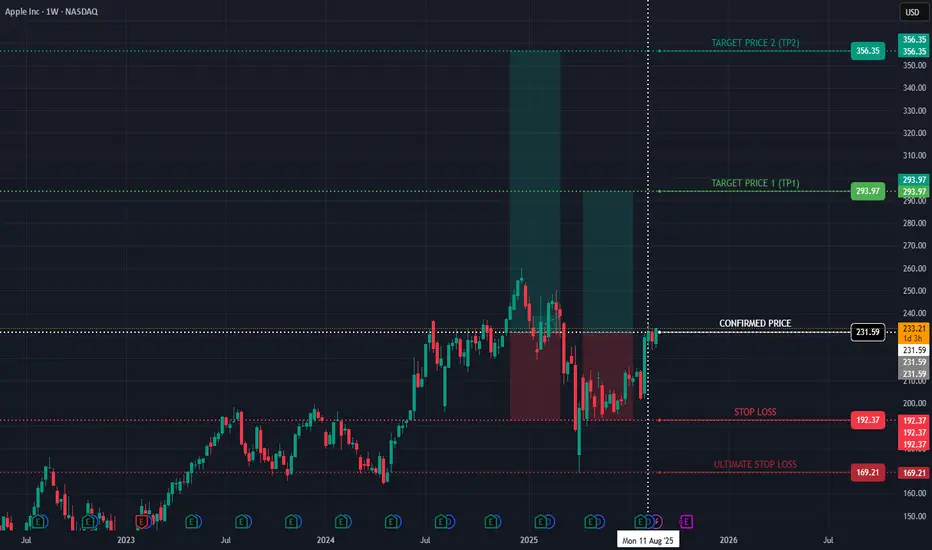
AAPL Bullish Stock Going UP and Confirmed!Hello,
Ayrfolio trade ideas are based on weekly charts and momentum, so remember to be patient! No day trades here unless the stock soars up intraday. Today we’re covering:
COMPANY: Apple Inc
STOCK SYMBOL: AAPL
POSITION: Long
TP1 Risk-Reward Ratio: 1.59
TP2 Risk-Reward Ratio: 3.18
Stop Loss: must wait AFTER daily candle closes to exit trade (regular candle, NOT Heiken Ashi)
Ultimate Stop Loss: can exit IMMEDIATELY if price reaches this level during any trading hours
EXPLANATION: Weekly momentum increased and confirmed on Monday 8/11/25 at $231.59/share. Although the stop losses are listed on the chart, if momentum has been lost then we can exit before the price reaches the stop loss.
DISCLAIMER: Please do your own due diligence before making any decisions.
P.S. - Stocks can soar. YOU can soar. Soaring is possible!
-Ayrfolio
Apple: Another Run at Key ResistanceApple shortly dipped back below the $230.20 mark but has since begun another push higher. We expect the stock to soon break through the $230.20 level sustainably and – as part of the green wave – move up toward the next major resistance at $260.10. The following wave pullback should remain above $230.20, allowing the broader green upward trend to continue gaining momentum.