APPLE Inverse Head and Shoulders give a new All Time HighApple Inc. (AAPL) has just completed an Inverse Head and Shoulders pattern, with its Head being the January 03 market Bottom. The Bear Cycle isn't technically over for Apple as the Channel Down that started back on the October 04 2021 Low hasn't yet been broken. In fact since the last two Lower Highs sequences have been +31.11% and +36.78%, the current rally is limited within the red Triangle Zone. As a result we have a short-term target at $165.00.
With the Inverse Head and Shoulders though technically aiming much higher, supported also by a 1W MACD Bullish Cross, if Apple closes a 1W candle above the Channel Down, we will re-buy and target $190.00 on the long-term, which is just below the 2.0 Fibonacci extension level.
-------------------------------------------------------------------------------
** Please LIKE 👍, FOLLOW ✅, SHARE 🙌 and COMMENT ✍ if you enjoy this idea! Also share your ideas and charts in the comments section below! **
-------------------------------------------------------------------------------
💸💸💸💸💸💸
👇 👇 👇 👇 👇 👇n
Aaplsignals

$AAPL bearish inside bar?$AAPL continue to pull back along with other tech companies. after massive rally.
inflation is still high and consumer is start to spend their more strictly. despite the
high labor cost. most tech companies are started to reduce their labor force as they start
to feel the consumer spending their money carefully.
No big catalyst so far for AAPL about up coming product except the new upcoming iphone.
which is nothing new anymore for most consumer.
below is the price level I'm looking for $AAPL:
AAPL average price move per day is $2-6 per day depending on market volatility and catalyst.
Below is the price level I'm looking for entry and exit for AAPL:
Buy call above 146.64 and sell at 147.38+ or above
Buy puts below 145.02 and sell at 143.74 or below
sometimes, the fist 30 minute of the opening bell is always volatile.
you can catch the move there. or wait for an 1 hour for better cheaper price
after it pulls back.
make sure that you set up alerts on those key level so you wont miss the move.
and always to take your profits as you see one.

APPLE confirmed a bullish extension. Potential for $167.Apple Inc. (AAPL) broke on Friday above the 1D MA50 (blue trend-line) following the strong rebound after Wednesday's big drop on the monthly inflation (down -0.5% to 7.7%), fueled by hopes of a future monetary easing by the Fed. Even though technically the last rejection was made on the 1D MA200 (orange trend-line), it is the 1D MA50 that confirmed the bullish extension during both July 07 but mostly March 22, which is the fractal that resembles the price action since mid-August the most.
With the RSI sequences between the two quite similar, it appears that we are in that final phase that will form the new Lower High on the Lower Highs trend-line since January 03, which has been basically the Resistance of this whole Bear Cycle. The March 2022 rally topped above the 0.786 Fibonacci retracement level. That is now on $167.45, with the January Lower Highs trend-line extending even above $170.00. Solid medium-term buy opportunity for Apple.
-------------------------------------------------------------------------------
** Please LIKE 👍, SUBSCRIBE ✅, SHARE 🙌 and COMMENT ✍ if you enjoy this idea! Also share your ideas and charts in the comments section below! This is best way to keep it relevant, support me, keep the content here free and allow the idea to reach as many people as possible. **
-------------------------------------------------------------------------------
You may also TELL ME 🙋♀️🙋♂️ in the comments section which symbol you want me to analyze next and on which time-frame. The one with the most posts will be published tomorrow! 👏🎁
-------------------------------------------------------------------------------
👇 👇 👇 👇 👇 👇
💸💸💸💸💸💸
👇 👇 👇 👇 👇 👇

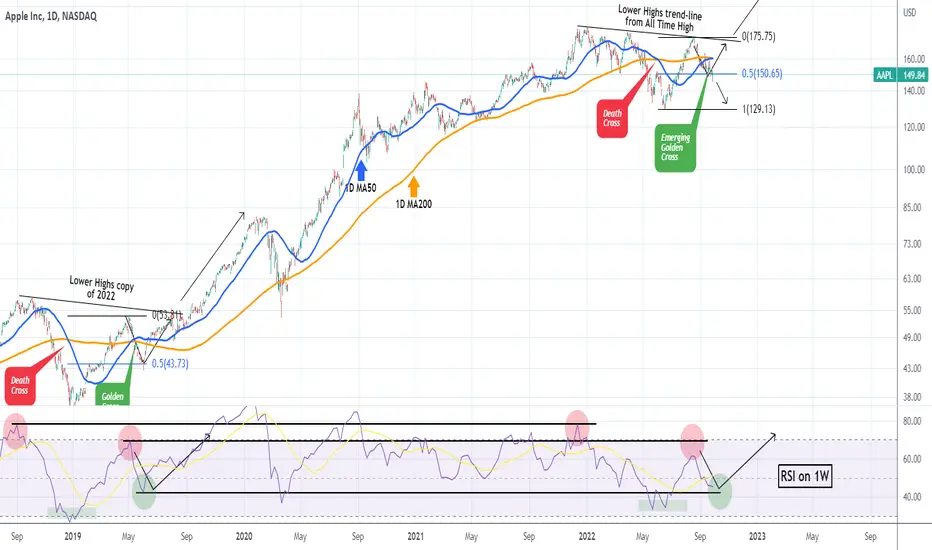
AAPLE -50% of June rally lost. Will it recover on the 2019 fractApple (AAPL) has fallen more than -17% from the mid-August High, losing more than half of the gains made on the June 16 rally. Right now it is exactly on the 0.5 Fibonacci retracement level on that High-Low sequence and on top of that a Golden Cross pattern is emerging (when the 1D MA50 (blue trend-line) crosses above the 1D MA200 (orange trend-line)).
We have explicitly outlined this potential fall to the 0.5 Fib if the price got rejected on the Lower Highs trend-line from the All Time High, on our August 17 idea:
As you see the timing couldn't be better as those where the days that the top was formed and the price got rejected. The last time we saw a similar pattern was on the June 03 2019 test of the 0.5 Fib. That was also caused by a rejection near the 2018 Lower Highs but the Golden Cross was formed a little earlier. After a marginal breach of the 0.5 Fib (such as the one we had yesterday), Apple resumed the uptrend and the recovery path.
See also the similarities on the RSI (1W time-frame), though this time it got rejected slightly below the Resistance level it did back in May 2019. This may possibly mean that we can see a rebound slightly higher than the symmetrical Support level. Another closing below it though can initiate an aggressive sell-off towards June's lows. In our view it is critical to see the Golden Cross forming, which should encourage buyers to accumulate.
-------------------------------------------------------------------------------
** Please LIKE 👍, SUBSCRIBE ✅, SHARE 🙌 and COMMENT ✍ if you enjoy this idea! Also share your ideas and charts in the comments section below! This is best way to keep it relevant, support me, keep the content here free and allow the idea to reach as many people as possible. **
-------------------------------------------------------------------------------
You may also TELL ME 🙋♀️🙋♂️ in the comments section which symbol you want me to analyze next and on which time-frame. The one with the most posts will be published tomorrow! 👏🎁
-------------------------------------------------------------------------------
👇 👇 👇 👇 👇 👇
👇 👇 👇 👇 👇 👇
👇 👇 👇 👇 👇 👇
AAPL UP? FINISH CORRECTION?AAPL seem like rebound on support area and EMA 200 TF 1 Day.
Seem like the correction is finish and continue bullish.
Entry= 157.31
TP= 180.04
SL= 152.94
Medium term (swing trade).
note: only take position after confirmation and do your own research before trading.

AAPL to 0The Big Short
Apple's tech is falling behind most major competitors. Without Steve Jobs, it is doomed.
The buying volume is also really bad.
Shorting to ZERO :)

$AAPL losing steam?$AAPL surge up since the start of summer along with the overall market. pending news about the new iphone 14 but the productions shortage and units makes it uncertain due to supply chain issues and inflation. overall big institution likes this stocks and its cash. but keep in mind that the stock has been up for couple months now with now massive pull back. so bears has been watching AAPL and waiting for opportunity.
here's my price range for AAPL
============================================================
For calls; buy above $174.90 and sell at 176.15 or above
For puts, buy below 173.60 and sell at 172.60 or below
============================================================
Welcome to this free technical analysis . ( mostly momentum play )
I am going to explain where I think this stock might possibly go the next day or week play and where I would look for trading opportunities for day trades or scalp play.
If you have any questions or suggestions on which stocks I should analyze, please leave a comment below.
If you enjoyed this analysis, I would appreciate it if you smashed that LIKE or BOOST button and maybe consider following my channel.

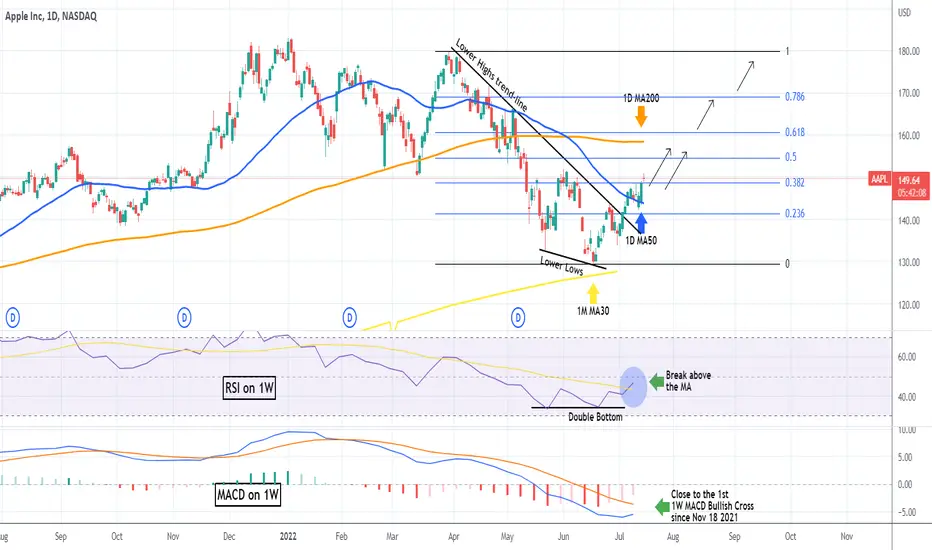
APPLE on key Resistance. Failure to break can result to $150.Apple Inc (AAPL) has been on an incredible +35% rise since the June 16 Low. It is trading above both the 1D MA50 (blue trend-line) and the 1D MA200 (orange trend-line). The 1W RSI broke last week above the 60.00 barrier for the first time since February 08. However despite the positives, here comes the most important Resistance test of all that will largely determine entering a new Bull Cycle or staying inside the 2022 Bear.
That is the Lower Highs trend-line of the January 03 All Time High (ATH). As you see, Apple hit that trend-line also on March 29 and got rejected. A similar pattern was last seen in late 2018 - early 2019 at the peak of the U.S. - China trade war. If we apply a similar Lower Highs trend-line, we see that the Jan- April 2019 rally failed to break it and got rejected back to the 0.5 Fibonacci retracement level, before the next double test broke above it into a new Bull Phase.
In a similar fashion, we expect Apple to have a strong rally if the Lower Highs trend-line breaks, but if rejected, test the 0.5 Fib which is at $150.00. Notice the importance of the Death/ Golden Cross formations but more importantly the symmetrical Resistance/ Support levels of the 1W RSI between 2019 and today. This can be an additional roadmap of rejection and where to buy then.
--------------------------------------------------------------------------------------------------------
Please like, subscribe and share your ideas and charts with the community!
--------------------------------------------------------------------------------------------------------

AAPLE holding the 1D MA50, targeting 158 short-term.Apple (AAPL) had a very strong 1D green candle yesterday, rebounding off the 1D MA50 (blue trend-line), which has been the Resistance since April 21, turning it into the Support. The break-out took place after the RSI on the 1W time-frame broke above its MA line on the widest margin since January 04. With the 1W MACD about to make the first Bullish Cross since November 18 2021, this could be the long-term buy signal that the market has been waiting for, for a sustainable recovery.
The technical short-term target is the 1D MA200 (orange trend-line) at around 158.00. The Fibonacci retracement levels can provide the next targets and pull-back/ buy levels. Overall the stock has the potential to reach its All Time High level before the end of the year.
--------------------------------------------------------------------------------------------------------
Please like, subscribe and share your ideas and charts with the community!
--------------------------------------------------------------------------------------------------------
APPLE can hit $185.00 in 3 months. 1D MA200 in focus.I haven't made an analysis publicly on Apple since my September 14 2021 idea:
It was when I first made public of the long-term Channel Up it was trading in and warned about a correction towards the 1D MA200 (orange trend-line), which has been the stocks major Support since the COVID crash of March 2020. Eventually the pattern proved to be a success, as the price corrected and then upon testing the 1D CCI Support Zone, it rebounded above the 2.0 Fibonacci extension target.
Right now AAPL has been correcting since January 04 High. On February 24 it almost hit the 1D MA200 again as well as the CCI Buy level, but the rebound was rejected near the 1D MA50 (blue trend-line) and now is again near the MA200. We can see even in corrections, that the CCI Buy Zone can give short-term buy entries. The key here is for the price to break above the 1D MA50, as in previous corrections that was the start of the new uptrend. The 1D MA50/ MA100 (green trend-line) bearish cross, hasn't affected the uptrend's chances before, in fact when it happened the price was already in rise mode.
It appears that the next 1D MA200 contact would be the next long-term Buy Signal for Apple, unless of course the 1D MA50 breaks first. Either way, the CCI has already give a Buy Signal, and for more than 1.5 year, it has been 100% accurate. The 2.0 Fibonacci extension based on the last low is just over $185.00 and that is our long-term target on AAPL.
--------------------------------------------------------------------------------------------------------
Please like, subscribe and share your ideas and charts with the community!
--------------------------------------------------------------------------------------------------------

Apple Analysis 29.01.2022Hello Traders,
welcome to this free and educational analysis.
I am going to explain where I think this asset is going to go over the next few days and weeks and where I would look for trading opportunities.
If you have any questions or suggestions which asset I should analyse tomorrow, please leave a comment below.
I will personally reply to every single comment!
If you enjoyed this analysis, I would definitely appreciate it, if you smash that like button and maybe consider following my channel.
Thank you for watching and I will see you tomorrow!

APPLE Further correction aheadPattern: Channel Up on 1D.
Signal: Sell towards the 1D MA200 (orange trend-line) and reverse to a buy either upon contact (buy signal last time) or when the CCI hits its Buy Zone (confirmed 3 times since November 2020).
Target: the 0.618 Fibonacci level.
** Please support this idea with your likes and comments, it is the best way to keep it relevant and support me. **
--------------------------------------------------------------------------------------------------------
!! Donations via TradingView coins also help me a great deal at posting more free trading content and signals here !!
🎉 👍 Shout-out to TradingShot's 💰 top TradingView Coin donor 💰 this week ==> Vergnes
--------------------------------------------------------------------------------------------------------

APPLE (AAPL) BUY AND SELL SETUPAAPLE 1HR:
APPLE CURRENTLY MOVING TOWARDS MULTIPLE TOUCH SUPPORT ZONE WHERE IT WILL MEET 4HR TRENLINE
IF THE PRICE RESPECT THE TRENDLINE THEN GO LONG...
OR
GO SHORT..

APPLE Strong bullish potential if the 1D MA30 breaks.I have used the Fibonacci Channel on this one as I wanted to find the true demand zone.
As you see the 0.382 - 0.0 level is a sustainable Buy Zone that delivers a bullish break-out near the 1.0 where investors are better off taking profits and then repeating the buy on lower levels.
Right now we have a Bullish Cross on MACD and the RSI is trading sideways on the 1D chart. Last time those took place, AAPL has already found a Bottom. Assuming this is the case, once the 1D MA30 (blue line) breaks, we can expect a sustainable uptrend to start. Accumulate within the lower Fib levels and sell once the break-out takes place.
** Please support this idea with your likes and comments, it is the best way to keep it relevant and support me. **
--------------------------------------------------------------------------------------------------------
!! Donations via TradingView coins also help me a great deal at posting more free trading content and signals here !!
🎉 👍 Shout-out to TradingShot's 💰 top TradingView Coin donor 💰 this week ==> Hunchocrypto1
--------------------------------------------------------------------------------------------------------
