$BTCUSD: immediate short term target at $98KBITSTAMP:BTCUSD : I believe CRYPTOCAP:BTC will make a new ATH in 2026. However, whether it will sweep the $80.5K low before going up to ATHs is uncertain.
In Elliot Wave terms, we have completed an abc correction. However, this can be just A of a larger degree ABC or this can be the entire ABC correction.
Either way, in the immediate short term, I see CRYPTOCAP:BTC rallying to $98K+ to complete Wave 1 up or Wave B. $98K is the 38.2% retracement of the entire correction from $126.2K to $80.5K. And there is a measured move AB = CD target of $98.1K.
I expect resistance to be very fierce at $98K.
Wave 1/Wave B can go beyond $98K of course.
But let's not get ahead of ourselves. $94K is still a very strong resistance. The two converging trendlines provided resistance to this rally so far. It took the two converging lines to actually converge for CRYPTOCAP:BTC to get above both. Once $94K is overcome, $96K, then $98K.
AB=CD


IREN to 200 $The hidden bullish divergence from A to C might be about to play out, and then put in place a AB=CD pattern that takes IREN to 200$

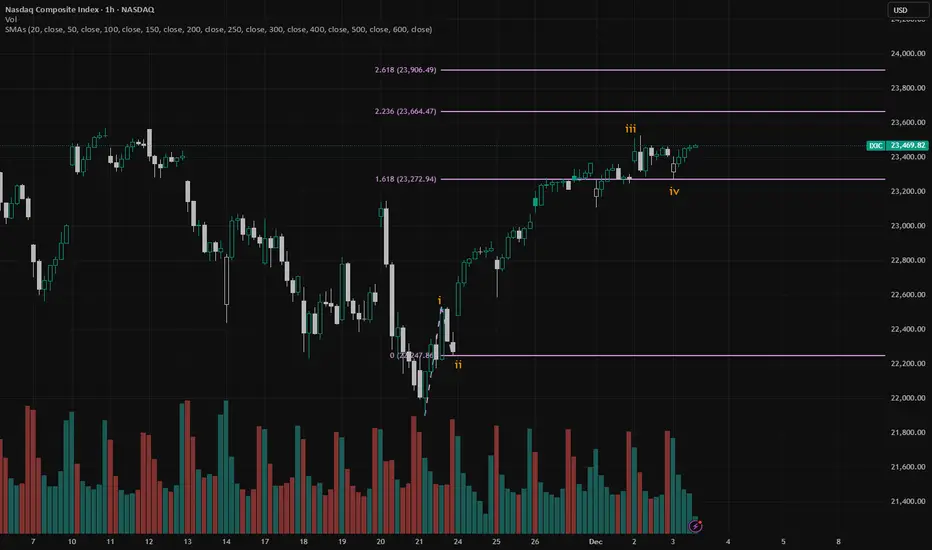
NASDAQ index: Wave v has startedOn the NASDAQ index, it's more clear than SPX that Wave v has started. Wave v at minimum is 61.8% of Wave i. Wave v = Wave i is also common.
I have QQQ.
$SPX: Wave 4 consolidation on 1-hr chartSP:SPX : looks like it's in a small degree Wave 4 consolidation. Wave 3 exceeded 161.8% of Wave 1. If Wave 5 = Wave 1, Wave 5 can reach 6950 area. However, Wave 5 = 61.8% Wave 1 is also quite common, which would take us to 6900 area.

$HIMS: starting a 5-wave sequenceNYSE:HIMS : I'm counting a 5-wave sequence starting from November low of $32.88. I see a clear 5-wave pattern from that low going to Nov. 28 high of $39.xx. Wave 2 started there.
Wave 2 so far has retraced just shy of 61.8% retracement. For a Wave 2, 50%-61.8% retracement are quite common and normal. However, it could retrace 99% of Wave 1.
If $32.88 is taken out, then this count is invalidated and NYSE:HIMS has not completed the major degree level consolidation.
If Wave 2 ended at today's low, a simple AB = CD projection takes us to $42.75.
For now, I have a small long position using covered stocks because Wave 2 may not have completed. My breakeven is at $37.5 after selling calls expiring this week. Looking to roll them to next week.

$BTCUSD: expecting a run to $96KBITSTAMP:BTCUSD : expecting BTC to recapture that falling wedge and reach the target of AB = CD, which is at $96K.

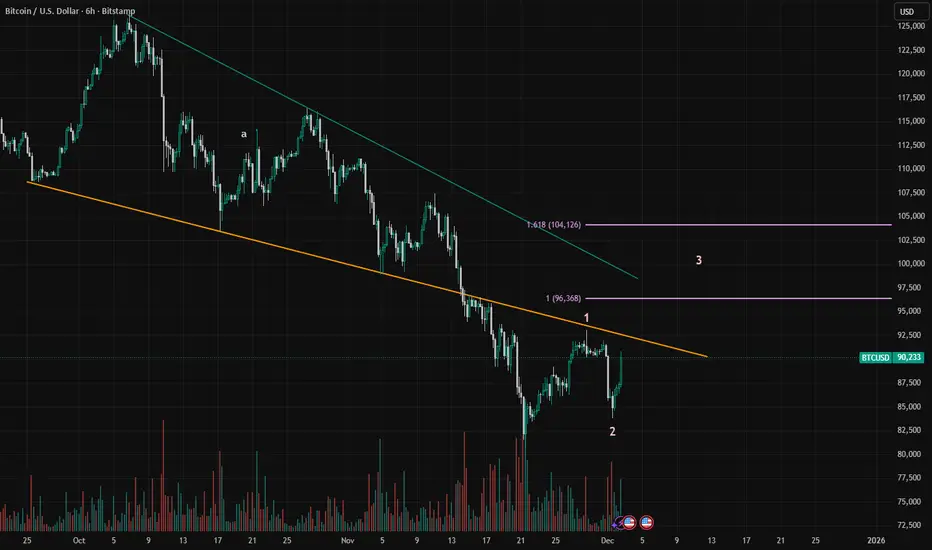
$BTCUSD: Wave 2 pullback complete; Wave 3 has announced itselfBITSTAMP:BTCUSD : Wave 2 pulled back to exceed 61.8% retracement and now Wave 3 has announced itself. Wave 3 = 1.618 Wave 1 takes us to $104K but I expect stubborn resistance along the way. AB = CD for a Wave 3 target gets us to $96K.
Selling AUD USD after measured move up. RR 2.5 Measured move in lovely swing leg moves in the AUD USD Currency pair. Selling short here with a RR of rouchly 2,5 with a conservative target and a stop above round number and old high. The trading range action around the entry here suggests that a reversal could be likely.

BTC 1W Bearish AB=CD harmonic, pt1=74200, pt2=48785BTC is in a bearish AB=CD harmonic pattern, heading to first price target at 74200. Expecting bullish retracement at that level before continuation to pt2 at 50000.
TOTAL crypto market cap is in a similar pattern, with loses projected to be > 2.4T USD.

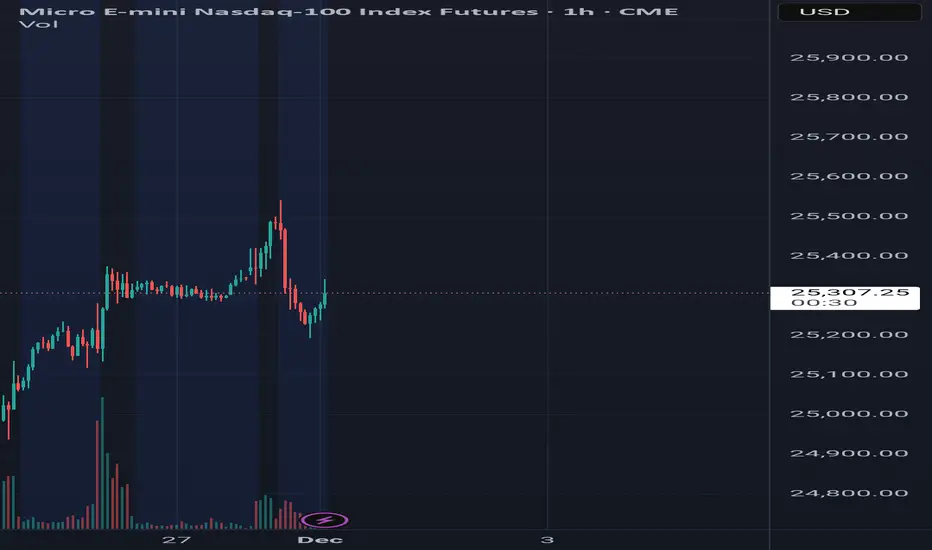
December 1st action Hello,
The market is at 25320 is right now.
The market will either go down to 25200-25000 first or it will go up to 25400-25500 before returning to 25200 on the 1st of December.
This is how the whales are planning to manipulate it today.
NQ1! 1M Bearish ABCD harmonic pt2@12982NQ1 Bearish ABCD (represented with `~` icon in this chart) hit pt1 at 19465 after first JPN carry trade crisis, then bullish retracement up to 1.272, now projected to continue bearish to pt2 @ 12982 (or lower).

EURUSD - why am I bearish on the priceWell, thank you for commenting on my ideas on EURUSD. This is what makes the TradingView community unique.
In one of the comments I learned that I am agains the mainstream believing that EURUSD is not going to continue growing (will not hit the next max after 1.19191 on Sep 15th). In this post I would like to provide arguments for which I am bearish in EURUSD, yet keeping in mind that those are just my humble opinions and as such they can be completely wrong.
So, let's do that:
Argument #0 - EURUSD in W1 in in Downtrend since June 2008
Argument #1 - Overbalance - total size of the corrections (marked light blue) are almost equal. Yet the recent correction perfectly is aligned with Garttley pattern (Argument 4).
Argument #2 - The BC parts of the above mentioned corrections are equal too (marked navy blue)
Argument #3 - the recent correction has performed a perfect ABC pattern
Argument #4 - The above mentioned Gartley pattern (I wrote a post on that) has been completed
Argument #5 - last but not least - the price returned exactly on Fibonacci Retracement 161.8 of the most recent correction to the up-movement starting on Sep 30th 2024.
Those argument create a massive Resistance Cluster at 1.17500 - 1.19600.
Altogether I have six argument to believe the local uptrend on EURUSD simply expired. But of course I may be absolutely wrong and EUR will go up from where it is now.
Just my humble opinion

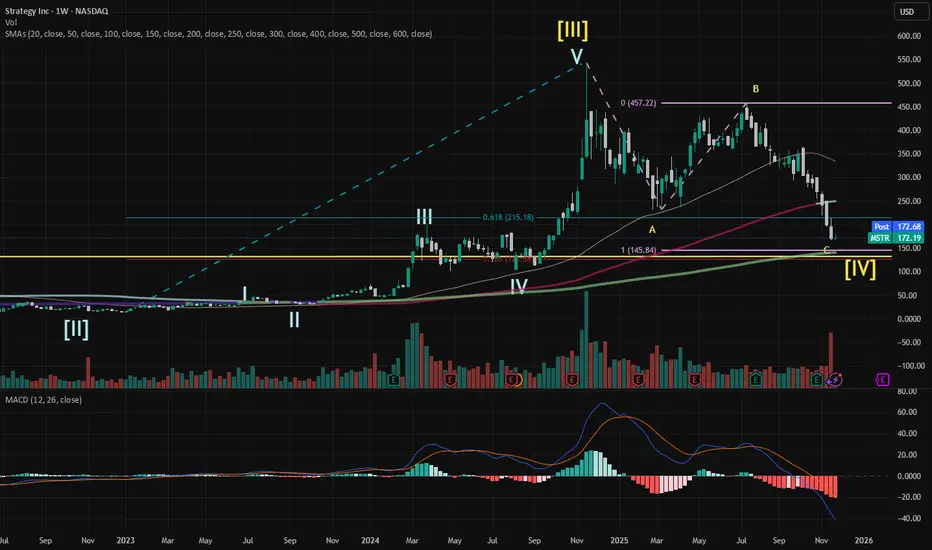
$MSTR: AB = CD is around $145NASDAQ:MSTR completed Wave in Nov 2024 and has been in Wave correction since. Elliott Wave theory states that often the correction will enter the zone of Wave 4 of one lesser degree, i.e., Wave III-Wave IV area of Wave . This corresponds to $200 in March 2024 and $102 in August 2024 (a 50% drop for Wave IV!).
Presently, MSTR at $172 already entered the top of that zone., AB = CD for the flat correction gives $145, which is right in the middle of this zone. $145 also is just above the 78.6% retracement.
This count is invalidated if MSTR drops below Wave top achieved in Feb 2021 at $131.50.
I don't believe MSTR will drop below $131.50 but hitting AB = CD at $145.84 is likely, which would probably correspond to CRYPTOCAP:BTC = $78K.
I don't own MSTR and don't plan to trade this name. If CRYPTOCAP:BTC drops to $78K, I plan to add to my position.
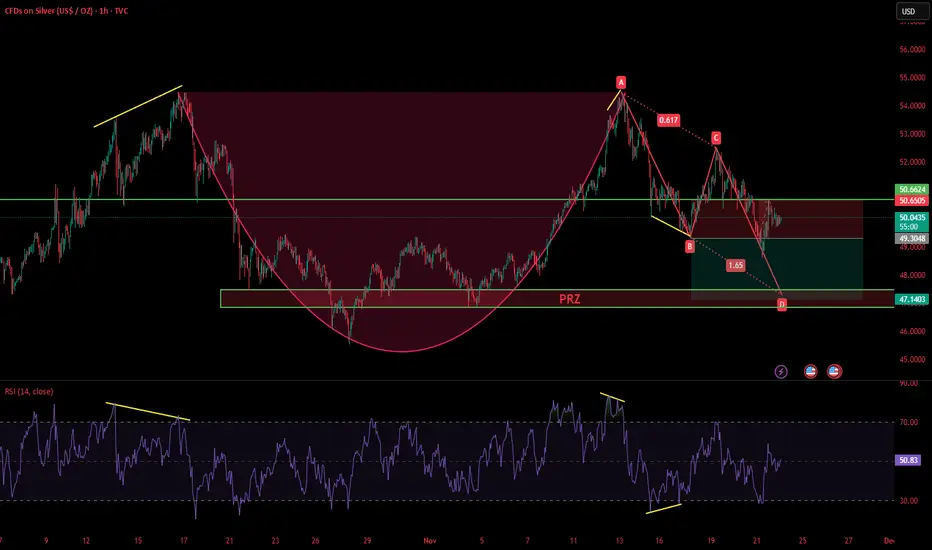
SILVERSilver may follow ABCD pattern and continue its downward trend towards its PRZ. Hopefully RSI divergence will be printed at PRZ as it is major support zone at 4H timeframe.
S&P 500 dip-buying setup?Keep an eye on this technical setup; I watch it closely, and it has proven to have a good track record. As you can see from the charts below, the VIX has closed north of the upper Bollinger Band (set to 2 standard deviations), and the daily price of the S&P 500 recently formed an AB=CD pullback to 6,594. This technical confluence often delivers a dip-buying opportunity.
Written by FP Markets Chief Market Analyst Aaron Hill

AB=CD Harmonic pattern on EURJPY: CAN THE SHORT BE FOR LONG?Recent push by EURJPY into higher highs have formed a AB=CD harmonic pattern on that indicates a potential reversal. As like every trading strategy that comes with pros and cons, it is best to trade with sufficient SL as the trade is a potential interest to me

$COIN: support zoneNASDAQ:COIN : the 61.8% retracement is $257 and AB = CD projects to $250. Whether this zone will serve as support will depend on BTC.

BTC Weekly Update | Still in Uptrend – Next Target 140K to 150KIn the start of 2025 (10 Feb), I shared a #BTC analysis when Bitcoin was trading around 95K, and our buying zone was clearly mentioned between 86K – 79K.
#BTC perfectly touched this zone and gave over 100% return!
Our position is still active and in strong profit.
Now, once again on the weekly timeframe, #BTC is showing a potential AB=CD pattern formation.
Currently, #BTC is moving within the Fibonacci golden zone (0.382–0.5), testing the trend line, and testing the EMA 50, theses are strong technical confluence zones for a bullish continuation.
Spot Trade Plan:
We will accumulate #BTC at CMP (Current Market Price).
Futures Trade Plan:
For confirmation, we will wait for:
A bullish candle on the 1D timeframe
A bullish divergence on the 4H chart
A clear breakout of the resistance zone
Once confirmed, we’ll look for a long setup with proper risk management.
Trend Outlook:
#BTC remains in a strong uptrend, and the next potential target zone could be around 140K – 150K if bullish momentum continues.
What’s your view on #BTC — are you bullish or expecting a deeper correction? Drop your thoughts below!
#BTC #Bitcoin #Crypto #BTCUSD #CryptoAnalysis #TechnicalAnalysis #TradingView #Bullish #ABCDPattern #Fibonacci #Uptrend #EMA50

Btc abcdSo this is like seeing into the future. Impossible you and I will agree. Harmonics should never be traded till they complete, or so they say.
Anyways the chart shows an incomplete AB=CD. A pitchfork.
Just an idea please don't take as gospel.

Watching the US$3,886 low closely right now!Whether Gold can hold onto its recent momentum is difficult to predict given the market uncertainty right now.
Not only is it a 50/50 bet whether the Fed pulls the trigger and cuts rates next month, but no one actually knows what US data we will be getting in the coming weeks, now that the US government shutdown has ended.
Additionally, it is still unclear when we will receive the data. September’s numbers will likely filter through next week and give us more of an idea of sentiment, but October’s data is tricky, particularly the jobs report!
Ultimately, the hawkish Fed rhetoric suggesting a potential pause next month will likely hinder upside in the yellow metal for now. You will note that Gold is down nearly 3.0% today, and if we see the unit engulf US$4,000 – a widely watched number – and the US$3,886 low formed in late October, this could trigger breakout selling to US$3,748, I believe: an AB=CD completion.
Consequently, while the trend clearly favours buyers in the longer term, we could be in for a little more pain to the downside, especially if we absorb US$3,886 bids.
Written by FP Markets Chief Market Analyst Aaron Hill

AUDCAD – 2618 Trading Strategy + 3-Bar Reversal ConfirmationThis setup is a textbook example of the 2618 trading strategy combined with a strict 3-Bar Reversal trigger for entry.
First leg: Market breaks structure, taking out prior lows.
Retracement: Price retraces back into the 61.8% Fibonacci level.
Confirmation: A 3-Bar Reversal forms, providing the entry signal.
Entry: Short position placed at confirmation of the 3-Bar setup.
Stops: Positioned above the retracement highs to protect against invalidation.
Targets: Measured at the 127.2% Fibonacci extension of the swing for optimal risk-to-reward.
📊 Why This Matters:
The 2618 strategy by itself is powerful, but pairing it with a confirmation pattern like the 3-Bar Reversal increases probability and filters out weak signals. This combination creates a disciplined, rules-based approach to trading that’s repeatable and consistent.
⚡ High-probability setup. Textbook execution. Risk defined. Reward targeted.

Head and shoulders pattern Hi guys
Here is attached xau chart with 15 minutes time frame and the trading system show us the famous pattern as head and shoulders.
Please be careful to direct all the approvals sign for getting action
One of them is equally low points that happened nearly of 0.7 Fibonacci retracement
