AUDCHF is printing Bearish AB=CD PatternAUDCHF is printing Bearish AB=CD Pattern on 1HR chart. Entry Point along with Stop Loss are marked on the chart.
AB=CD

EURSGD has printed Bullish AB=CD PatternEURSGD has printed Bullish AB=CD Pattern on 1HR chart. Entry Point along with Stop Loss are marked on the chart. Divergence is visible on RSI.

EURJPY is printing Bullish AB=CD PatternEURJPY is printing Bullish AB=CD Pattern on 1HR chart. Entry Point along with TPs are marked on the chart. We are going to trade it to point D with proper risk management.

NVDA: Monthly Bearish ABCD Signal Pending Lowering Target to $80Last month I posted a setup that made the argument that NVDA was trading within the Pattern Completion Zone of a Bearish ABCD visible on the Monthly Timeframe and that all I was looking for was a Monthly PPO Confirmation Signal which would likely be triggered by a Bearish Negative Monthly Candle within the Zone; this situation remains the same we are still trading within the zone even after the earnings pop, but we simply haven't had that negative month yet, however it does seem like it will soon give me the signal that I want and it's something to pay attention to, at this point I'd say it'd be ok to put on a midsized bearish entry via 1-3 month NVDA Puts around the $480-$500 strike or NVDS Calls at the $36 strike and upon generating the bearish negative signal candle it will be appropriate to put on the full bearish entry.
In addition, after the recent Price Action and Earnings, if we do get the signals we want here, NVDA will probably drop back down to around $80
The original setup can be found below:

Gold Potential Outlook Daily TFGold can continue downward momentum in the short term. However, trend reversal is on the cards.
AB=CD Harmonic Pattern + horizontal support show (Daily) that potential reversal zone can 1895-1880, from where Gold can rally

SPX500 - Could we see 4300-4400??OANDA:SPX500USD has had 3 big gap days to finish the week really strong.
Could we see the bigger pattern play out towards the 61.8% level from the ATH? or even 4400..
There are a lot of resistance areas to come before that level so ideal scenario is to wait until we get a tradable retracement to buy.
There could also be a deeper correction before higher prices as we are coming into some smaller pattern completions.
I will post these smaller TF charts below.
Plenty of data this week to move things around finishing with NFP on Friday.
Enjoy the week.. Can this rally continue.

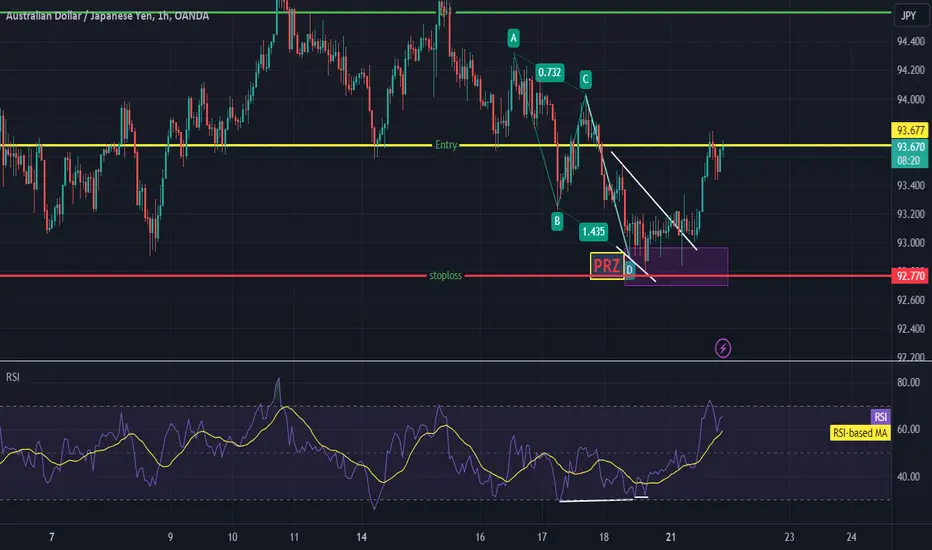
AUDJPY - Bearish Trend ReversalAs per the harmonics AB=CD, The pair has shown signs of a trend reversal at the D point. D point is the Potential Reversal Zone (PRZ). There is a divergence as well mentioned with a white line on RSI. The entry point, stop loss, and profit levels are the market. Let's hope it goes as planned!
USDCAD - Bullish Trend ReversalAs per the harmonics AB=CD, The pair has shown signs of a trend reversal pattern i.e. Double Top at the D point. D point is the Potential Reversal Zone (PRZ). There is a divergence as well mentioned with a white line on RSI. The entry point, stop loss, and profit levels are the market. Let's hope it goes as planned!

PEPEUSDTPEPEUSDT is in the formation of ABCD pattern.
As the pair has completed AB and perfectly retraced the BC wave and now looking for continuation of CD length.
If pair head towards CD the 1st optimum target could be the bottom of B wave.
What you people think of it?

NZDUSD - Bearish TrendThe pair is in a bearish trend and there is no divergence on RSI. The trend is expected to continue. The entry, stoploss, and profit levels are marked. We will see if the market continues or gives reversal signs at D (Potential Reversal Zone). We will take action accordingly or let the pair hit tp levels.

AUDUSD - Bearish PatternThe pair is in a bearish trend and there is no divergence on RSI. The trend is expected to continue. The entry, stoploss, and profit levels are marked. We will see if the market continues or gives reversal signs at D (Potential Reversal Zone). We will take action accordingly or let the pair hit tp levels.

EURUSD - Bearish TrendThe pair is in a bearish trend and there is no divergence on RSI. The trend is expected to continue. The entry, stoploss, and profit levels are marked. We will see if the market continues or gives reversal signs at D (Potential Reversal Zone). We will take action accordingly or let the pair hit tp levels.

GBPUSD - Bearish Harmonics AnalysisThe pair is in a bearish trend. The AB=CD harmonics have been applied for the marked take profit levels with the entry and stop-loss. The Potential Reversal zone (PRZ) is identified using harmonics. Let's see if PRZ performs or not!

How low will Gold go???Fibonacci extension tool is showing a 1.41 level inside of a 4 hr demand zone. We also have a measured move on the previous down leg. I suggest to watch this level and not just buy it at this level. Let's see if we get a reaction off the level that we can work with and THEN go through our process to take the trade long.

SELL USDCHFPrice got rejcted at a major resistance 0.88276 and we see an AB=CD formation in confluence with a double top and RSI bearish divergence,.. Sell with proper risk management.

EURUSD at technica resistance @W1Price geo to technical resistance cluster:
- 1:1 of the uptrend impulse from 16/03/2020 to 29/12/2020
- 1:1 of the uptrend impulse from 06/03/2023 to today
- FR 0.618 of the dontrend impulse starting 29/12/2020 to 22 Sep 2022
