USDCAD 1H AB=CD pattern Bullish ReversalUSDCAD 1H AB=CD pattern Bullish Reversal
Stop Loss: 1.37172
Buy Stop: 1.37635
TP1: 1.38102
TP2: 1.38567
In Harmonics, There could be divergence and there might not be
Risk-Reward = Reward / Risk = 1% to 1%
AB=CD

A Harmonic Pattern Entry Into A Potential Continuation TradeI don't look at Bitcoin often but when answering a question for another trader this weekend I stumbled across an interesting opportunity.
Higher timeframe we've recently broken and closed above a previous high, allowing me to project that price is likely to continue higher.
We've already started to retracement in the form of a complex pullback and if you look carefully on the lower timeframe this complex pullback as also created a bullish bat pattern which could be used as an entry.
Please leave any questions or comments below
Akil

#DOGEUSDT: Upcoming Big Bullish Move| Crypto| Setupsfx_| BINANCE:DOGEUSDT price is still bearish, however, after some point we can see strong bullish volume kicking in the market. After NFP today, we might see price dropping a little more until it reaches our area of entry. From which we can see strong price rebound towards our target area which would be 0.23.
We wish you all the best and always maintain a great risk to reward ratio.

$ZB - 30y Treasury Futures Sell off in Equity Risk OnThe 30-Year Treasury Bond Futures (ZB) sold off notably, driven by a combination of macro headlines and technical positioning. A key catalyst was the European Union’s decision to postpone the implementation of retaliatory auto tariffs until July 9th, which temporarily eased geopolitical tensions and triggered a risk-on rotation into equities — at the expense of duration-heavy fixed income assets.
From a technical standpoint, ZB fell sharply from the upper 3 standard deviation Bollinger Band and found support near the 2 standard deviation band, where it stabilized. It then retraced roughly 50% of the move, tagging the 20-period simple moving average. Market participants are now closely watching whether the contract completes a full measured move lower to 111'19, a level that represents:
The 100% Fibonacci extension of the prior decline
A test of the lower 3 standard deviation band
A notable inefficiency zone on the hourly chart
While the MOVE Index has declined and is now tracking sideways — signaling reduced bond market volatility — traders remain focused on long-end supply, fiscal slippage, and global rate re-alignments. Until these themes settle, technical levels like 111'19 may continue to act as magnets for price discovery in long-dated Treasuries.

Genmab 4h longZone + 1st measured move PB.
Could potentially go all the way up to the expanding triangle top?

AUS200 - Bullish Continuation Using 3 Bar Reversals, Fibs, AB=CDAfter a recent violation of a previous structure high, the AUS200 shown signs of relief with a pullback into the previous level of structure resistance which we would now look to act as present structure support.
At this level price has also given us a 3-Bar Reversal which can be used as a reason for entry.
Targets are protected at a previous level of structure highs on the daily, also being supported by a Fibonacci extension level and an AB=CD pattern projection.
If you have any questions, comments, or just want to share your ideas, please do so below. A please show your support by hitting that LIKE button before you go.
Akil

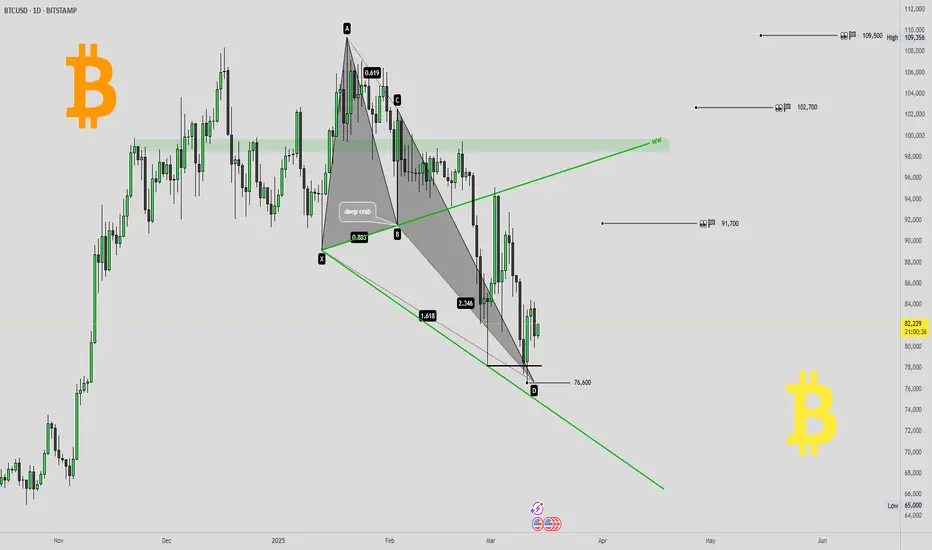
Bitcoin reversal confirmed ?!Bitcoin reversal confirmed ?! 👀
I would like to present you some charts with important levels and relevant patterns.
🖥daily-chart (BITSTAMP) and 💡everything important in the chart 👀
💥Here in the daily chart (BITSTAMP)
- a Deep-Crab harmonic with
- a WolveWave
and the daily-chart of the
🔥Daily MA200 re-test 👀
- gap fill
- support-line 2022 and 2024 TOPs
👉 BITCOIN roadmap/outlook (from 27th february 2024) 💡
🎯 If you like this idea, please leave me a 🚀 and follow for updates 🔥⏰
Furthermore, any criticism is welcome as well as any suggestions etc. - You're also very welcome to share this idea.
Have a nice evening & successful trading decisions 💪
M_a_d_d_e_n ✌
NOTE: The above information represents my idea and is not an investment/trading recommendation! Without any guarantee & exclusion of liability!
recap - " Bitcoin reversal confirmed ?! "BITCOIN reversal confirmed?! 👀
BITSTAMP:BTCUSD
How did this idea develop? 🤔
🥇Recap of the idea(s) from March 14, 2025 (see right 👀 under “Related Publications”)🎯
Hello ❤TradingView Community 👋
After the sell-off/correction ended on April 7, 2025' - Bitcoin reached an absolute low of $74434. This was followed by a nice rally and the complete fulfillment of the price targets from the idea of March 14, 2025 (push the play-button 😍).
Everything important is in the chart!
💡 This idea is closed at this point ✔
👉 All targets have been achieved 🎯💪
💥Follow me to stay up to date and be the first to receive these important updates/news & not miss anything! ⏰🔔
Furthermore, any criticism and suggestions etc. are welcome. - Feel free to share this idea.
Have a nice day & happy trading folks 🔥💪
M_a_d_d_e_n ✌
NOTE: The above information represents my idea and is not an investment/trading recommendation! No guarantee & exclusion of liability!
👉 BITCOIN roadmap/outlook (from 27th february 2024) 💡

#ABUK - very confusing / where is the bottom ??!!!!3 levels prices may respect it :
first : 49.18
secund : 43.64 ( may be )
third : 38.69 ( really, no one bigger than market )
i am waiting for any positive sign at any level, now MACD is negative on daily basis .
any way consider stop loss to save your capital
good luck

#EKHOA - only for share holders / not for new entry .EKHOA - 1 day timeframe
Bullish AB=CD pattern formed / For shareholders only
Stop loss: 24.50
T1: 26.95
T2: 28.21
T3: 29.65
Entry: around 25.00
MACD shows positive divergence daily, with increased volume over the past week, supporting our view.
Note: The stock has been in a downtrend and remains under negativity.
This is not financial advice, just our analysis based on chart data. Please consult your account manager before investing.
Thanks and good luck!

GBPNZD: 800+ Pips Possible Buying Opportunity!OANDA:GBPNZD
Price currently at the possible rebound area where we can expect price to reverse from, upcoming weeks expecting GBP to be bullish against NZD. However, first we will have to wait for price to reject and rebound strongly. Based on that you may take entry using accurate risk management. At least eying at 700-800 pips. Good Luck and Trade Safe.
show us some love by liking and commenting the idea. ❤️

XAUUSD[GOLD]: 1 Hour View Show Extreme Seller Volume Gold in a shorter time frame shows extreme bearish volume kicking in the market, where bulls are failing to push prices higher. Additionally, if you’re someone who analyses patterns, a HEAD AND SHOULDERS pattern has also formed. There are three targets you can aim for.
We extend our best wishes and good luck in your trading endeavours. Your unwavering support is greatly appreciated.
If you’d like to contribute, here are a few ways you can assist us:
- Like our ideas
- Comment on our ideas
- Share our ideas
Team Setupsfx_🚀❤️


Novo 1h longShould get up and at least break the neckline from the bigger SHS/IHS.
Stop below zone or lower trendline.

GOLD LONG VIEW.............
Hello Traders, here is the full analysis for this pair,
let me know in the comment section below if you have any questions,
the entry will be taken only if all rules of the strategies will be
satisfied. I suggest you keep this pair on your watch list and see if
the rules of your strategy are satisfied.
Dear Traders,
If you like this idea, do not forget to support it with a like and follow.
PLZ! LIKE COMMAND AND SUBSCRIBE

BTCUSD / BITCOIN | 4H | WAIT BREAKOUT Good morning, my friends
Bitcoin support level is $96,900.00, while the resistance level stands at $104,600.00.
Right now, I'm just waiting for an upward breakout. Once that happens, I'll provide a clear target.
Don't forget to hit the like button so you don't miss any updates on this analysis.
My dear friends, your likes are the biggest motivation for me to keep sharing my analyses. I truly appreciate everyone who supports my work with their likes—thank you so much!
With respect and love.

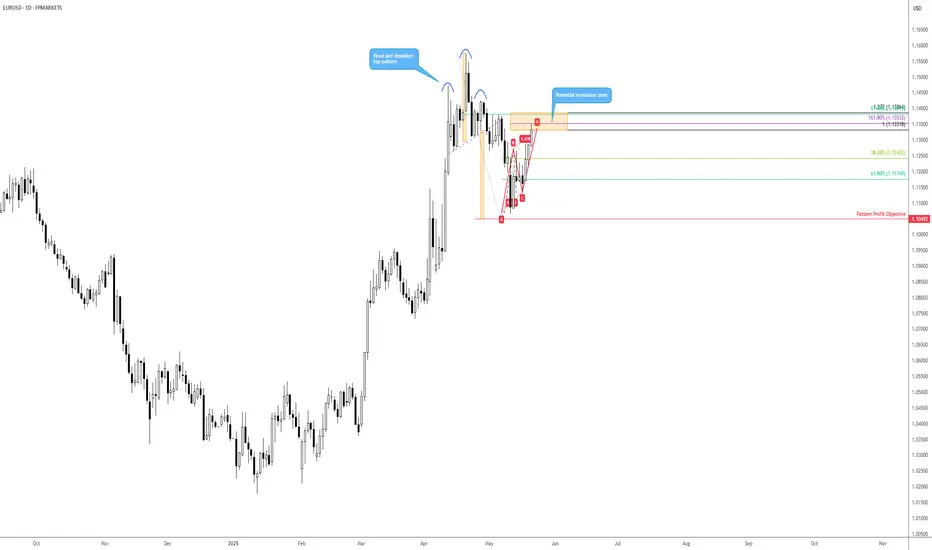
EUR/USD resistance calls for attentionFollowing the EUR/USD (euro versus the US dollar) trading within striking distance of a head and shoulders top pattern’s profit objective at US$1.1049, bulls went on the offensive. Consequently, price has pencilled in an AB=CD bearish formation at US$1.1332, according to the 100% projection ratio and a 1.618% Fibonacci extension ratio of US$1.1353 (B-C reciprocal). However, in terms of a resistance zone, I would be inclined to include the 1.272% Fibonacci projection ratio at US$1.1386, which shares chart space with a 61.8% Fibonacci retracement ratio from US$1.1382.
Harmonic traders tend to target the 38.2% and 61.8% Fibonacci retracement ratios derived from the A-D legs, which, assuming a temporary peak in price at current levels, reside at US$1.1242 and US$1.1175, respectively.
Gold to infinity and beyondSince April 22, Gold has completed an ABCD pattern and appears to be in a strong uptrend. Ride it to infinity and beyond.

USDJPY:Is it a beginning of major bullish trend? Read CaptionThe price of USDJPY has shown a mixed volume, making it difficult to determine the trend. However, if we analyse the data, we can see that USD is gaining strength in the coming time. This could be due to the strong news coming in this week, which may divert the USDJPY towards the 150 price region. There are four potential targets that price could hit and surpass. Please use this analysis solely for educational purposes, as it does not provide any guarantees.
Good luck and trade safely.
Thanks for your support! 😊
If you’d like to help us out, here are a few things you can do:
- Like our ideas
- Comment on our ideas
- Share our ideas
Team Setupsfx_
❤️

EAST it's easy, but only for professionals, long term positive.#EAST timeframe 1 day
Created a bearish AB=CD pattern
Sell point around 34.90
Stop loss / reentry 35.85 (estimated loss -2.77%)
First target at 33.00 (estimated profit 5.00%)
Second target 31.95 (estimated profit up to 8.60%)
MACD supports this idea
NOTE: this data is according to timeframe 1 day.
NOTE: stock remains positive for long term.
It's not advice for investing, only my vision according to the data on the chart.
Please consult your account manager before investing.
Thanks and good luck.

ORWE - fast and secure #ORWE - Timeframe 15 minutes .
Created 2 Bullish patterns ,( Gartley - AB=CD ) with same targets .
Entry level at 21.95
Stop loss 21.80
First target at 22.35
Second target 22.63
Third target 22.83
Also MACD and RSI show positive diversion that's may support our idea .
note : chart on timeframe 15 minutes
Its not an advice for investing only my vision according to the data on chart
Please consult your account manager before investing
Thanks and good luck

SPX : Where Where - according to the F
This is a continuation of the previous SELL idea. This time, we go into the details, where we can actually see price action moving in lock-step.
Lets make lots of money. Please keep the SL tight.
Good luck.
