ADA Bullish Move Incoming? (4H)Given that the ongoing correction has extended longer than expected, it appears that buyers have not yet fully entered the market. This current correction falls into the category of complex double corrections, which are often seen in mature or consolidating markets.
From a structural perspective, Cardano (ADA) seems to be forming a double correction, connected by an X-wave, linking the two corrective patterns together. The second correction, in particular, appears to take the form of a triangle, and we are currently observing Wave E of this triangle. Once Wave E completes, we can reasonably expect this double correction to conclude, setting the stage for a potential bullish move in Cardano.
For proper risk management, we have identified two entry zones, where positions should ideally be entered using a DCA (Dollar-Cost Averaging) strategy. This approach helps reduce risk and ensures better average entry prices during ongoing corrective moves.
⚠️ Trade management guidelines:
At Target 1, it is recommended to secure partial profits.
After that, move your stop loss to breakeven (entry level) to protect capital while letting the trade run.
❌ Invalidation rule:
A daily candle closing below the invalidation level will invalidate this analysis and should trigger a review of your position.
This setup is based on price structure, wave theory, and risk management principles, not speculation. Discipline, patience, and adherence to the outlined rules will be crucial for capitalizing on this potential move.
If you have a coin or altcoin you want analyzed, first hit the like button and then comment its name so I can review it for you.
This is not a trade setup, as it has no precise stop-loss, stop, or target. I do not publish my trade setups here.
Adausd

#ADA/USDT Spot LONG#ADA
The price is moving within a descending channel on the hourly timeframe. It has reached the upper boundary and is heading towards breaking it. A retest of this boundary is expected.
The Relative Strength Index (RSI) is showing an upward trend, as it has approached the upper boundary. A bearish reversal is expected.
There is a key support zone in green at 0.3800. The price has bounced from this zone several times and is expected to bounce again.
A consolidation trend is observed above the 100-period moving average, which we are approaching. This trend supports a decline towards this level.
Entry Price: 0.3916
Target 1: 0.4018
Target 2: 0.4155
Target 3: 0.4296
Stop Loss: Above the green support zone.
Remember this simple thing: Money management.
For any questions, please leave a comment.
Thank you.

ADAUSD breakout zone retest? The ADAUSD pair continues to display a bearish outlook, in line with the prevailing downward trend. Recent price action suggests a corrective pullback, potentially setting up for another move lower if resistance holds.
Key Level: 4,336
This zone, previously a consolidation area, now acts as a significant resistance level.
A failed test and rejection at 4,336 would likely resume the bearish momentum.
Downside targets include:
3,700 – Initial support
3,450 – Intermediate support
3,270 – Longer-term support level
Bullish Scenario (breakout above 4,520):
A confirmed breakout and daily close above 4,520 would invalidate the bearish setup.
In that case, potential upside resistance levels are:
4,520 – First resistance
4,736 – Further upside target
Conclusion
ADAUSD remains under bearish pressure, with the 4,520 level acting as a key inflection point. As long as the price remains below this level, the bias favours further downside. Traders should watch for price confirmation around that level to assess the next move.
This communication is for informational purposes only and should not be viewed as any form of recommendation as to a particular course of action or as investment advice. It is not intended as an offer or solicitation for the purchase or sale of any financial instrument or as an official confirmation of any transaction. Opinions, estimates and assumptions expressed herein are made as of the date of this communication and are subject to change without notice. This communication has been prepared based upon information, including market prices, data and other information, believed to be reliable; however, Trade Nation does not warrant its completeness or accuracy. All market prices and market data contained in or attached to this communication are indicative and subject to change without notice.

Swing Trade — High-Probability Bullish Reversal Setup in ConstruPrice swept the Previous Week Low (PWL), leaving a clear weekly rejection wick — liquidity taken, not accepted.
After that sweep, the daily chart displaced strongly to the upside, printing a bullish MSS with a clean break above $0.3842, and leaving a Daily FVG, pointing to a potential change in state of delivery.
⸻
🔹 Key Levels & Confluence
• Daily FVG:
$0.3825 – $0.3601
• Fibonacci retracement of the displacement leg:
• 0.786 → $0.3725
• 0.618 → $0.3634
This defines a high-quality POI, where:
• Weekly liquidity was swept
• Daily MSS is already in place
• FVG + discount alignment converge
⸻
🔹 What this means
This is not a confirmed reversal yet, but a valid bullish reversal setup in construction.
So far, the market has shown:
✔️ Weekly liquidity sweep
✔️ Daily bullish MSS
✔️ Daily imbalance (FVG) left behind
What is not confirmed yet:
❌ Sustained bullish acceptance
❌ Full invalidation of the broader bearish structure
⸻
🔹 Execution Model (Mandatory)
No blind entries.
Price must:
1. Retrace into the Daily FVG / 0.618–0.786 zone
2. Show reaction or absorption
3. Print bullish structure on LTF (15m–30m)
• MSS / BOS
• Displacement + LTF FVG
➡️ Execution is LTF-confirmed, not Daily-based.
⸻
🔹 Targets (Correct Structural Progression)
• Target 1 (Primary / Logical):
$0.4374 — high created by the daily displacement
→ First internal liquidity objective.
• Target 2 (Secondary):
$0.4840 — daily high that caused the bearish shift
→ Major daily structural level.
• Target 3 (HTF / Conditional):
$0.51 — weekly high that caused the bearish shift
→ Weekly liquidity and structure reference.
⚠️ Targets 2 and 3 are conditional and only valid if price:
• Holds above the Daily FVG
• Continues to build bullish structure
⸻
🔹 Invalidation
This bullish reversal idea fails if:
• No reaction inside the Daily FVG
• The low that caused the daily MSS is broken
In that case, this scenario becomes a corrective pullback within a larger bearish structure.
⸻
🧠 Final Note
This is not prediction.
This is context → liquidity → structure → conditional execution.
Let the market confirm — or stay flat.
NFA | Price Action only
Chat GPT used to structure the post.
BINANCE:ADAUSD COINBASE:ADAUSD

ADAUSD oversold bounce back resistance at 4,520The ADAUSD pair continues to display a bearish outlook, in line with the prevailing downward trend. Recent price action suggests a corrective pullback, potentially setting up for another move lower if resistance holds.
Key Level: 4,520
This zone, previously a consolidation area, now acts as a significant resistance level.
A failed test and rejection at 4,520 would likely resume the bearish momentum.
Downside targets include:
3,700 – Initial support
3,450 – Intermediate support
3,270 – Longer-term support level
Bullish Scenario (breakout above 4,520):
A confirmed breakout and daily close above 4,520 would invalidate the bearish setup.
In that case, potential upside resistance levels are:
3,450 – First resistance
3,270 – Further upside target
Conclusion
ADAUSD remains under bearish pressure, with the 4,520 level acting as a key inflection point. As long as price remains below this level, the bias favours further downside. Traders should watch for price confirmation around that level to assess the next move.
This communication is for informational purposes only and should not be viewed as any form of recommendation as to a particular course of action or as investment advice. It is not intended as an offer or solicitation for the purchase or sale of any financial instrument or as an official confirmation of any transaction. Opinions, estimates and assumptions expressed herein are made as of the date of this communication and are subject to change without notice. This communication has been prepared based upon information, including market prices, data and other information, believed to be reliable; however, Trade Nation does not warrant its completeness or accuracy. All market prices and market data contained in or attached to this communication are indicative and subject to change without notice.

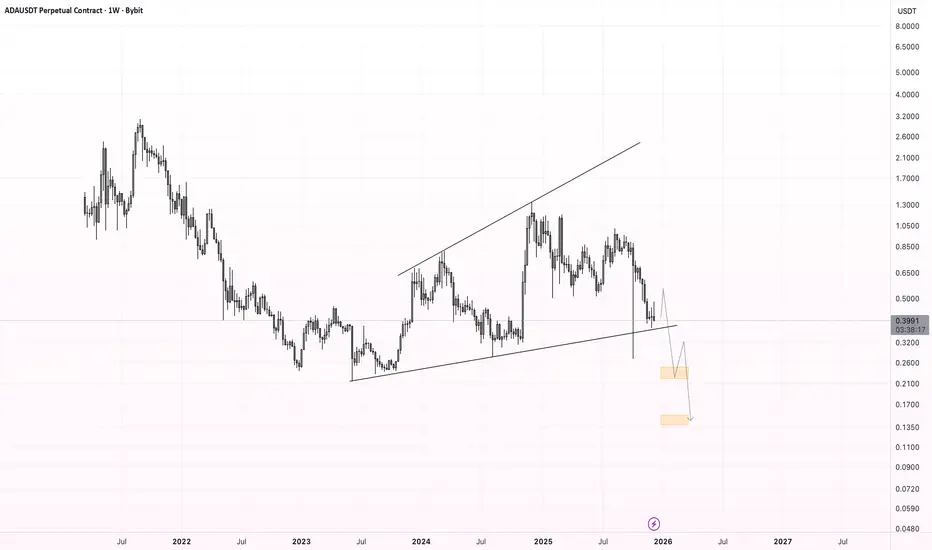
ADA's SituationWe can be hopeful that after breaking out of the wedge, we will see significant price growth.AB=CD
Best regards CobraVanguard.💚
Give me some energy !!
✨We spend hours finding potential opportunities and writing useful ideas, we would be happy if you support us.
Best regards CobraVanguard.💚

ADAUSD capped by falling resistance at 4,170The ADAUSD pair continues to display a bearish outlook, in line with the prevailing downward trend. Recent price action suggests a corrective pullback, potentially setting up for another move lower if resistance holds.
Key Level: 4,170
This zone, previously a consolidation area, now acts as a significant resistance level.
A failed test and rejection at 4,170 would likely resume the bearish momentum.
Downside targets include:
3,330 – Initial support
3,150 – Intermediate support
2,903 – Longer-term support level
Bullish Scenario (breakout above 4,170):
A confirmed breakout and daily close above 4,170 would invalidate the bearish setup.
In that case, potential upside resistance levels are:
4,480 – First resistance
5,750 – Further upside target
Conclusion
ADAUSD remains under bearish pressure, with the 4,170 level acting as a key inflection point. As long as price remains below this level, the bias favours further downside. Traders should watch for price confirmation around that level to assess the next move.
This communication is for informational purposes only and should not be viewed as any form of recommendation as to a particular course of action or as investment advice. It is not intended as an offer or solicitation for the purchase or sale of any financial instrument or as an official confirmation of any transaction. Opinions, estimates and assumptions expressed herein are made as of the date of this communication and are subject to change without notice. This communication has been prepared based upon information, including market prices, data and other information, believed to be reliable; however, Trade Nation does not warrant its completeness or accuracy. All market prices and market data contained in or attached to this communication are indicative and subject to change without notice.

#ADA//USDT Spot LONG #ADA
The price is moving in a descending channel on the 1-hour timeframe. It has reached the lower boundary and is heading towards breaking above it, with a retest of the upper boundary expected.
We have a downtrend on the RSI indicator, which has reached near the lower boundary, and an upward rebound is expected.
There is a key support zone in green at 0.3558. The price has bounced from this zone multiple times and is expected to bounce again.
We have a trend towards stability above the 100-period moving average, as we are moving close to it, which supports the upward movement.
Entry price: 0.3690
First target: 0.3741
Second target: 0.3842
Third target: 0.3976
Don't forget a simple principle: money management.
Place your stop-loss order below the green support zone.
For any questions, please leave a comment.
Thank you.

ADAUSDT Near Major Breakout Level — Trend Reversal or Bull Trap?On the 12-hour timeframe, ADAUSDT remains within a clear medium-term downtrend structure. Over the past few months, price has consistently formed lower highs and lower lows, capped by a dominant descending trendline.
However, recent price action shows an early bullish reaction from the lower support area, suggesting a potential transition phase or a short-term relief rally.
---
Pattern & Technical Structure
Primary Pattern:
Descending Trendline / Bearish Channel Breakdown Test
Price has been trading below the descending trendline (dynamic resistance) for an extended period.
The latest candles indicate a retest of the trendline, which now acts as a critical decision zone.
The marked horizontal levels (yellow dashed lines) represent key historical support and resistance zones.
Pattern Summary:
As long as price remains below the trendline, the broader structure stays bearish. A valid break and close above the trendline would be the first signal of a potential trend reversal or short-term bullish continuation.
---
Key Levels
Major Resistance:
0.413
0.468
0.520
High Resistance / Reversal Zone:
0.616 – 0.682
Key Support:
0.370
0.345
0.321 (structural low)
---
Bullish Scenario
Price successfully breaks and closes above the descending trendline (12H close).
Trendline flips into support after a successful retest.
Upside targets:
TP1: 0.413
TP2: 0.468
TP3: 0.520
If bullish momentum and volume expand, further upside toward 0.616 – 0.682 becomes possible.
Bullish Confirmation:
Higher low formation
Minor market structure shift
Strong candle close, not just a wick
---
Bearish Scenario
Price fails to break the trendline and forms a clear rejection (long upper wick / bearish engulfing).
Price revisits lower support zones:
First support: 0.370
Next support: 0.345
Worst-case scenario: 0.321 (new lower low)
A breakdown below 0.321 would confirm continuation of the major downtrend.
Bearish Confirmation:
Clear rejection at the trendline
Lower high formation
Increasing selling volume
---
Conclusion
ADAUSDT is currently at a critical decision zone.
The macro trend remains bearish, but the recent bullish reaction from lower support opens room for a short-term reversal or relief rally.
Traders are advised to wait for confirmation — either a breakout or rejection — at the trendline, as this area will define the next major move.
---
#ADA #ADAUSDT #Cardano #CryptoAnalysis #TechnicalAnalysis #Downtrend #Trendline #SupportResistance #Altcoins

ADA Bounces 10% From Critical Support - 3 Scenarios AheadCARDANO (ADA/USD) | Daily Chart | Technical Update - Bounce From Critical Support
Current Price: $0.393 | Date: January 3, 2026
🔄 UPDATE: STRONG REVERSAL FROM WEEKLY SUPPORT
💥 ADA surged over 10% from $0.33 lows - critical weekly support held strong
📈 Price now trading at $0.393, showing first signs of buyer strength after prolonged decline
⚡ 37,851% surge in futures volume signals major trader repositioning
🐋 Whale buying activity detected - large orders accumulating at support
📊 PRICE ACTION OVERVIEW
✅ Successfully defended $0.30-$0.33 multi-year support zone (tested multiple times 2023-2024)
🔄 Strong bounce with volume confirms buyer interest at these levels
📍 Currently testing $0.385 - first support/resistance on the recovery path
⚖️ Market at critical decision point - three distinct scenarios emerging
🎯 KEY TECHNICAL LEVELS
Resistance Zones:
$0.385-$0.407 - Immediate resistance cluster;
$0.435-$0.48 - Green scenario target zone; breaking here signals full trend reversal
Support Zones:
$0.33 - CRITICAL WEEKLY SUPPORT - Just defended successfully, highest priority watch level
$0.30 - Secondary weekly support - breach here invalidates bullish scenario
$0.26-$0.21 - Extreme downside target (Red scenario) - October 2023 lows
📈 THREE SCENARIO ANALYSIS
🟢 SCENARIO 1: BULLISH REVERSAL (Green Arrow)
Probability: 35-40% based on current momentum
Path: Break above $0.385 → Test $0.407 → Rally to $0.435-$0.45
Catalyst: Sustained whale accumulation, positive funding rate, volume continuation
Confirmation: Daily close above $0.385 with strong volume
🟡 SCENARIO 2: CONSOLIDATION (Yellow Arrow)
Probability: 40-45% - Most likely near-term outcome
Path: Sideways range between $0.32-$0.38 for several weeks
Pattern: Accumulation phase as market digests recent drop
Confirmation: Repeated tests of $0.33 support without breakdown
🔴 SCENARIO 3: BEARISH CONTINUATION (Red Arrow)
Probability: 20-25% if support fails
Path: Break below $0.33 → Rapid decline to $0.30 → Ultimate target $0.26-$0.21
Risk: Loss of weekly support triggers cascading sell orders
Confirmation: Daily close below $0.33 with volume
🌐 MARKET CONTEXT
🔥 Cardano futures volume exploded 37,851% on Bitmex exchange - from near zero to $255.52M
🐋 Whale activity shows accumulation pattern - large orders defending $0.33 support
📊 Funding rate flipped positive to 0.0068% - historically precedes ADA rallies
💼 Critical Integrations Budget approved late 2025 - enables third-party app integration with Cardano
🌍 Midnight protocol launch and Leios upgrades approaching - major technical catalysts
😨 Market sentiment: Fear & Greed Index at 28 (Fear) but improving from Extreme Fear
📈 Analysts targeting $0.48-$0.50 if weekly support holds and momentum continues
💡 TECHNICAL OUTLOOK
🎯 Short-term bias: Cautiously Bullish - successful support defense shifts momentum
✅ Critical win: Holding $0.33 weekly support validates bull case and attracts buyers
🚧 First challenge: Must reclaim $0.385-$0.407 zone to confirm reversal
⚖️ Base case (45% probability): Consolidation between $0.32-$0.38 while market decides direction
🟢 Bull scenario (35% probability): Break above $0.407 opens path to $0.435-$0.45, volume is key
🔴 Bear scenario (20% probability): Breakdown below $0.33 triggers capitulation to $0.26-$0.21
📊 Volume analysis: Current bounce needs sustained buying volume above 800M-1B daily to confirm
⏰ Watch period: Next 7-10 days critical - either confirms reversal or resumes downtrend
------------------------------------------------------------------------------------------------------------------
⚠️ DISCLAIMER
This is technical analysis for educational purposes only. Not financial advice. Always do your own research and manage risk appropriately.

ADAUSDT – Daily Chart. ADAUSDT – Daily Chart.
Macro downtrend intact (descending channel)
The price is sitting at a major HTF demand level after a prolonged sell-off.
Selling momentum is exhausting near channel support
Price is compressing → base formation possible
This zone often leads to sideways accumulation before expansion
Support: 0.35 – 0.32 (critical demand zone)
Invalidation: Below 0.30
First Resistance: 0.48 – 0.52
Major Supply: 0.70 – 0.82 (previous value area)
In Extreme Fear, strong coins usually move sideways at support to absorb sell pressure before trend reversal.
No blind longs. Wait for structure shift + volume confirmation.
DYOR | NFA

ADA/USDT | Is Cardano dead? (READ THE CAPTION)As you can see in the 4h chart of ADAUSDT, it has been consolidating in a zone between the Bearish Breaker and the Buliish Rejection Block and it is now being traded at 0.3510.
Currently, there's no clear indication as to where it is headed.
Next targets for ADA: 0.3620, 0.3730 and 0.3850.

Strong Bearish Sentiment on ADA heading to $0.255CARDANO (ADA/USD) | Daily Chart | Technical Analysis
Current Price: $0.337 | Date: January 1, 2026
📊 PRICE ACTION OVERVIEW
📉 Clear downtrend dominance - ADA has been in a sustained bearish trajectory since late 2025
💥 Price declined from highs around $1.00 - 1.02 (August 2025) down to current levels near $0.337
🔴 Trading near multi-month lows with continued selling pressure visible in recent candles
⚠️ Price action shows lower highs and lower lows - classic bearish structure intact
🎯 KEY TECHNICAL LEVELS
Resistance Zones:
$0.385 - Major overhead resistance level marked on chart; this represents a significant barrier that needs to break for any meaningful recovery attempt
Support Zones:
Current support ~$0.337 - Price hovering at current levels with limited buying interest
$0.21 - $0.25 - Strong support level/Target Point indicated by arrow; represents potential downside target if current support fails (~23% decline from current price)
Price Targets:
📍 Downside target: $0.255 as highlighted on the chart
🎯 Recovery resistance: $0.385 must be reclaimed to invalidate bearish bias
🌐 MARKET CONTEXT
🔻 ADA has dropped nearly 60% in 2025, underperforming major cryptocurrencies like Bitcoin and Ethereum
😨 Crypto Fear & Greed Index sits at 28 (Extreme Fear), reflecting cautious investor sentiment across the broader market
🏦 The CLARITY Act's Senate markup scheduled for January 2026 may cement ADA's status as a commodity, potentially unlocking institutional demand long-term
⚡ Cardano's Midnight protocol is developing a bridge to Solana to access $95B DeFi liquidity, with mainnet launch anticipated
📊 Analysts remain divided: some predict recovery to $0.48-0.55 range by late January/February 2026, while current technicals suggest downside risk remains
💡 TECHNICAL OUTLOOK
🎯 Short-term bias: Bearish - Direction Index confirms sellers are in control with no signs of reversal yet
⚠️ Critical level to watch: $0.21 support - a breakdown here opens the door to a massive sell off
🚧 Resistance challenge: Bulls need to reclaim $0.385 to shift momentum and invalidate the downtrend structure
📉 Risk scenario: expect accelerated selling toward the $0.255 zone
🔄 Recovery scenario: A hold above $0.255 and declining Bearish sentiment could signal early reversal signs, but confirmation is needed
------------------------------------------------------------------------------------------------------------------
⚠️ DISCLAIMER
This is technical analysis for educational purposes only. Not financial advice. Always do your own research and manage risk appropriately.

ADAUSD bearish below 4,170 resistanceThe ADAUSD pair continues to display a bearish outlook, in line with the prevailing downward trend. Recent price action suggests a corrective pullback, potentially setting up for another move lower if resistance holds.
Key Level: 4,170
This zone, previously a consolidation area, now acts as a significant resistance level.
A failed test and rejection at 4,170 would likely resume the bearish momentum.
Downside targets include:
3,330 – Initial support
3,150 – Intermediate support
2,903 – Longer-term support level
Bullish Scenario (breakout above 4,170):
A confirmed breakout and daily close above 4,170 would invalidate the bearish setup.
In that case, potential upside resistance levels are:
4,480 – First resistance
5,750 – Further upside target
Conclusion
ADAUSD remains under bearish pressure, with the 4,170 level acting as a key inflection point. As long as price remains below this level, the bias favours further downside. Traders should watch for price confirmation around that level to assess the next move.
This communication is for informational purposes only and should not be viewed as any form of recommendation as to a particular course of action or as investment advice. It is not intended as an offer or solicitation for the purchase or sale of any financial instrument or as an official confirmation of any transaction. Opinions, estimates and assumptions expressed herein are made as of the date of this communication and are subject to change without notice. This communication has been prepared based upon information, including market prices, data and other information, believed to be reliable; however, Trade Nation does not warrant its completeness or accuracy. All market prices and market data contained in or attached to this communication are indicative and subject to change without notice.

ADA: The Setup Is HerePrice just rallied 5.89% to $0.3814, which looks bullish on the surface. But here's the conflict: we've got a confirmed CHoCH Bearish signal—structure just flipped downward despite the swing trend still reading bullish. When structure and trend disagree, I'm paying attention to structure. It's telling us what's happening right now, not what happened 20 bars ago.
1. THE TECHNICAL REALITY 📉
• Stochastic hit 96.8—deep overbought territory
• Price kissing upper Bollinger Band at $0.3822
• 6.8% upper wick on current candle = sellers showed up at these highs
• Volume 174% above average confirms participation, but the wick formation suggests distribution, not accumulation
• Trading in discount zone below equilibrium ($0.4271), but that doesn't make this bullish—it just means we're in the lower half of a range that could become the upper half of a new, lower range
2. THE INDICATORS ⚖️
Bearish Signals:
• CHoCH Bearish confirmed—market structure flipped downward
• Stochastic 96.8 (extreme overbought)
• Price rejected at upper Bollinger Band with 6.8% wick
• Bearish order block overhead at $0.3915-$0.3780 (supply zone)
Bullish Signals:
• RSI 57.6 (neutral, not oversold)
• MACD showing bullish momentum (weak but present)
• Price above both EMA20 and EMA50
• Swing trend still technically bullish
The Conflict:
Structure says down, momentum says up. This is why my confidence is 68%, not 85%. The setup has edge, but it requires confirmation—don't front-run the rejection.
3. THE TRADE SETUP 🎯
🔴 Scenario A: Rejection & Continuation Lower
• Trigger: Bearish rejection at $0.3915 bearish OB (watch for engulfing candles or strong wicks)
• Entry: Confirmation of rejection in supply zone $0.3915-$0.3780
• Target: $0.3463 (swing low support)
• Stop: 4H close above $0.3915 (thesis invalidated)
• Secondary Support: Ascending trendline at $0.3500 if $0.3463 breaks
🟢 Scenario B: Bullish Reclaim
• Trigger: 4H close above $0.4554
• Result: CHoCH Bullish confirmed—bearish setup off the table
• Invalidation: Entire bearish thesis breaks above $0.3915
MY VERDICT
The probability favors a rejection and move lower. We're trading the lower boundary of a descending channel with supply overhead and overbought readings at resistance. But this isn't a slam dunk—wait for price to show its hand at that bearish OB. Risk management is critical: your invalidation is crystal clear at $0.3915.

ADAUSD downtrend consolidation resistance at 4,590The ADAUSD pair continues to display a bearish outlook, in line with the prevailing downward trend. Recent price action suggests a corrective pullback, potentially setting up for another move lower if resistance holds.
Key Level: 4,590
This zone, previously a consolidation area, now acts as a significant resistance level.
A failed test and rejection at 4,590 would likely resume the bearish momentum.
Downside targets include:
3,580 – Initial support
3,160 – Intermediate support
2,830 – Longer-term support level
Bullish Scenario (breakout above 4,590):
A confirmed breakout and daily close above 4,590 would invalidate the bearish setup.
In that case, potential upside resistance levels are:
4,880 – First resistance
5,350 – Further upside target
Conclusion
ADAUSD remains under bearish pressure, with the 4,590 level acting as a key inflection point. As long as price remains below this level, the bias favours further downside. Traders should watch for price confirmation around that level to assess the next move.
This communication is for informational purposes only and should not be viewed as any form of recommendation as to a particular course of action or as investment advice. It is not intended as an offer or solicitation for the purchase or sale of any financial instrument or as an official confirmation of any transaction. Opinions, estimates and assumptions expressed herein are made as of the date of this communication and are subject to change without notice. This communication has been prepared based upon information, including market prices, data and other information, believed to be reliable; however, Trade Nation does not warrant its completeness or accuracy. All market prices and market data contained in or attached to this communication are indicative and subject to change without notice.

Chuck's coin teetering on the brink of a dramatic plunge to 9cCardano, along with many other high market cap tokens, certainly stands out.
As we find ourselves in the crypto bear market,
I would argue that we have actually been in one for quite some time now.
The rapid declines can catch newcomers off guard.
Meanwhile, those who have weathered several cycles tend to quietly withdraw and wait for BTC to undergo its usual year-long downturn.
Will BTC hit a bottom again next November, similar to the previous four-year cycles?
The odds still seem to favor a yes.
Even with the influx of institutional capital.
This situation simply means that the OGs finally have the liquidity to cash out completely.
And they have been doing so with great intensity since the summer.
Unfortunately, altcoins do not benefit from this liquidity, and there are hardly any profitable wallets aside from those of founders and VCs who essentially created the coins or acquired them for a pittance.
Retail investors will likely bear the brunt of falling for the hype once more.

ADAUSD downtrend continuation below 4,590 resistance The ADAUSD pair continues to display a bearish outlook, in line with the prevailing downward trend. Recent price action suggests a corrective pullback, potentially setting up for another move lower if resistance holds.
Key Level: 4,590
This zone, previously a consolidation area, now acts as a significant resistance level.
A failed test and rejection at 4,590 would likely resume the bearish momentum.
Downside targets include:
3,580 – Initial support
3,160 – Intermediate support
2,830 – Longer-term support level
Bullish Scenario (breakout above 4,590):
A confirmed breakout and daily close above 4,590 would invalidate the bearish setup.
In that case, potential upside resistance levels are:
4,880 – First resistance
5,350 – Further upside target
Conclusion
ADAUSD remains under bearish pressure, with the 4,590 level acting as a key inflection point. As long as price remains below this level, the bias favours further downside. Traders should watch for price confirmation around that level to assess the next move.
This communication is for informational purposes only and should not be viewed as any form of recommendation as to a particular course of action or as investment advice. It is not intended as an offer or solicitation for the purchase or sale of any financial instrument or as an official confirmation of any transaction. Opinions, estimates and assumptions expressed herein are made as of the date of this communication and are subject to change without notice. This communication has been prepared based upon information, including market prices, data and other information, believed to be reliable; however, Trade Nation does not warrant its completeness or accuracy. All market prices and market data contained in or attached to this communication are indicative and subject to change without notice.

ADA - Bearish Expanding TrianglePrice is trading within a broadening (expanding) triangle , with higher highs and lower lows indicating increasing volatility and distribution. The structure favors a bearish resolution , and I’m expecting a breakdown below the lower trendline to confirm continuation to the downside.
Expectations:
Breakdown from the expanding triangle → acceleration lower.
Downside Targets:
🎯 $0.25
🎯 $0.15
As long as price stays below the upper boundary, the bearish scenario remains dominant.
ADA – Downtrend Dominates, Risk of Deeper PullbackHello everyone,
On the chart, the downtrend remains clearly intact, with a persistent sequence of lower highs and lower lows extending from October to the present. Price is trading entirely below EMA34 and EMA89, both of which are sharply sloping downward. This confirms that sellers continue to control the market, with no meaningful signs of exhaustion so far.
Throughout November and December, all rebound attempts have been weak, short-lived, and repeatedly rejected around the EMA34 near the 0.45 USD area. This behavior suggests that buying pressure is purely technical in nature and insufficient to form a reversal structure. At the moment, ADA is hovering around the nearby support zone of 0.37–0.39 USD. However, the current D1 candle structure — small bodies, short lower wicks, and declining volume — indicates fading momentum, a pattern that often precedes a breakdown of support.
From an EMA perspective, the widening gap between price and EMA34 (0.452) as well as EMA89 (0.560) further confirms that the downtrend is expanding rather than contracting. To shift the market’s bias, ADA would need at least a daily close above 0.45 USD. At this stage, there are no early signals supporting such a scenario. Volume has continued to dry up over recent weeks and is concentrated mainly on bearish candles, implying a lack of fresh inflows, while sellers still require relatively little pressure to push prices lower.
Based on the current technical picture, the highest-probability scenario remains a breakdown below the 0.37–0.38 support zone, followed by an extension of the decline toward deeper support around 0.30–0.33 USD. This area represents a significant liquidity zone that previously acted as a major support, where price could eventually see a technical bounce or begin forming a new accumulation base. Until ADA approaches that region, there is still insufficient evidence to expect a genuine trend reversal.
Wishing you all a successful trading day!

ADAUSD Bearish sideways consolidation capped at 4,590The ADAUSD pair continues to display a bearish outlook, in line with the prevailing downward trend. Recent price action suggests a corrective pullback, potentially setting up for another move lower if resistance holds.
Key Level: 4,590
This zone, previously a consolidation area, now acts as a significant resistance level.
A failed test and rejection at 4,590 would likely resume the bearish momentum.
Downside targets include:
3,580 – Initial support
3,160 – Intermediate support
2,830 – Longer-term support level
Bullish Scenario (breakout above 4,590):
A confirmed breakout and daily close above 4,590 would invalidate the bearish setup.
In that case, potential upside resistance levels are:
4,880 – First resistance
5,350 – Further upside target
Conclusion
ADAUSD remains under bearish pressure, with the 4,590 level acting as a key inflection point. As long as price remains below this level, the bias favours further downside. Traders should watch for price confirmation around that level to assess the next move.
This communication is for informational purposes only and should not be viewed as any form of recommendation as to a particular course of action or as investment advice. It is not intended as an offer or solicitation for the purchase or sale of any financial instrument or as an official confirmation of any transaction. Opinions, estimates and assumptions expressed herein are made as of the date of this communication and are subject to change without notice. This communication has been prepared based upon information, including market prices, data and other information, believed to be reliable; however, Trade Nation does not warrant its completeness or accuracy. All market prices and market data contained in or attached to this communication are indicative and subject to change without notice.

What I think is going on with Cardano right nowThis is my personal opinion and update regarding Cardano. It is not a financial advice.

ADAUSD Bearish sideways consolidation capped at 4,590The ADAUSD pair continues to display a bearish outlook, in line with the prevailing downward trend. Recent price action suggests a corrective pullback, potentially setting up for another move lower if resistance holds.
Key Level: 4,590
This zone, previously a consolidation area, now acts as a significant resistance level.
A failed test and rejection at 4,590 would likely resume the bearish momentum.
Downside targets include:
3,580 – Initial support
3,160 – Intermediate support
2,830 – Longer-term support level
Bullish Scenario (breakout above 4,590):
A confirmed breakout and daily close above 4,590 would invalidate the bearish setup.
In that case, potential upside resistance levels are:
4,880 – First resistance
5,350 – Further upside target
Conclusion
ADAUSD remains under bearish pressure, with the 4,590 level acting as a key inflection point. As long as price remains below this level, the bias favours further downside. Traders should watch for price confirmation around that level to assess the next move.
This communication is for informational purposes only and should not be viewed as any form of recommendation as to a particular course of action or as investment advice. It is not intended as an offer or solicitation for the purchase or sale of any financial instrument or as an official confirmation of any transaction. Opinions, estimates and assumptions expressed herein are made as of the date of this communication and are subject to change without notice. This communication has been prepared based upon information, including market prices, data and other information, believed to be reliable; however, Trade Nation does not warrant its completeness or accuracy. All market prices and market data contained in or attached to this communication are indicative and subject to change without notice.
