ADAUSD capped at 5,997 resistanceThe ADAUSD remains in a neutral trend, with recent price action showing signs of an oversold rally within the broader range trading.
Support Zone: 5,237 – a key level from previous consolidation. Price is currently testing or approaching this level.
A bullish rebound from 5,237 would confirm ongoing upside momentum, with potential targets at:
5,997 – initial resistance
6,285 – psychological and structural level
6,571 – extended resistance on the longer-term chart
Bearish Scenario:
A confirmed break and daily close below 5,237 would weaken the bullish outlook and suggest deeper downside risk toward:
4,950 – minor support
4,613 – stronger support and potential demand zone
Outlook:
Bullish bias remains intact while the ADAUSD holds above 5,997 A sustained break below this level could shift momentum to the downside in the short term.
This communication is for informational purposes only and should not be viewed as any form of recommendation as to a particular course of action or as investment advice. It is not intended as an offer or solicitation for the purchase or sale of any financial instrument or as an official confirmation of any transaction. Opinions, estimates and assumptions expressed herein are made as of the date of this communication and are subject to change without notice. This communication has been prepared based upon information, including market prices, data and other information, believed to be reliable; however, Trade Nation does not warrant its completeness or accuracy. All market prices and market data contained in or attached to this communication are indicative and subject to change without notice.
Adausd

How to Apply Quarter’s Theory on Cardano (ADA) | Crypto TAHow to Apply Quarter’s Theory on Cardano (ADA) | Crypto Technical Analysis
In this video, we break down how to draw and use Quarter’s Theory on Cardano (ADA) to understand market structure and price rotation in crypto.
You’ll learn how institutional traders use quarter levels to identify key turning points and why this method can help you see precision entries long before retail traders react.
Whether you’re trading spot or futures, this breakdown gives you a practical framework to read crypto price movement like a professional.
What You’ll Learn:
How to draw Quarter’s Theory levels on a crypto chart
Why market makers respect these levels across all timeframes
How to use quarter zones for entries, exits, and managing bias
Real example using ADA/USD
If you’re ready to stop guessing and start reading the market’s geometry, this is where to begin.
Tags: quarters theory, cardano analysis, crypto trading strategy, institutional trading concepts, market structure crypto

ADAUSD resistance retest at 5,997 The ADAUSD remains in a neutral trend, with recent price action showing signs of an oversold rally within the broader range trading.
Support Zone: 5,237 – a key level from previous consolidation. Price is currently testing or approaching this level.
A bullish rebound from 5,237 would confirm ongoing upside momentum, with potential targets at:
5,997 – initial resistance
6,285 – psychological and structural level
6,571 – extended resistance on the longer-term chart
Bearish Scenario:
A confirmed break and daily close below 5,237 would weaken the bullish outlook and suggest deeper downside risk toward:
4,950 – minor support
4,613 – stronger support and potential demand zone
Outlook:
Bullish bias remains intact while the ADAUSD holds above 5,997 A sustained break below this level could shift momentum to the downside in the short term.
This communication is for informational purposes only and should not be viewed as any form of recommendation as to a particular course of action or as investment advice. It is not intended as an offer or solicitation for the purchase or sale of any financial instrument or as an official confirmation of any transaction. Opinions, estimates and assumptions expressed herein are made as of the date of this communication and are subject to change without notice. This communication has been prepared based upon information, including market prices, data and other information, believed to be reliable; however, Trade Nation does not warrant its completeness or accuracy. All market prices and market data contained in or attached to this communication are indicative and subject to change without notice.

It might let us down once again !!!Cardano’s price on the 1-hour timeframe is forming an ascending triangle pattern.
If this pattern breaks to the upside, there’s hope that the AB leg will equal the CD leg, potentially pushing the price up to around $0.60.
However, since crypto often disappoints expectations, it might let us down once again—so stay cautious.

ICPUSDT - many positive indicators!The coin ICP has pumped nearly 160% in just one week, and believe it or not — all that move happened without even breaking out of the accumulation range it’s been forming for over 275 days.
So imagine what will happen once it finally breaks out!
The high volume and bullish indicators on the chart suggest that this coin’s minimum target is around $30, meaning roughly a 5x potential from the current level.
It has already broken above the 0.618 Fibonacci resistance, broken the main trendline (marked in blue), and even formed a Golden Cross pattern.
It’s still inside the accumulation zone for now, so this is your early entry opportunity — because once it breaks out, you won’t catch it again.
Mark my words.
Best Regards:
Ceciliones🎯

ADAUSD important support at 5,240
The ADAUSD remains in a neutral trend, with recent price action indicating a corrective pullback within the broader trading range.
Support Zone: 5,240 – a key level from previous consolidation. Price is currently testing or approaching this level.
A bullish rebound from 5,240 would confirm ongoing upside momentum, with potential targets at:
6,000 – initial resistance
6,285 – psychological and structural level
6,570 – extended resistance on the longer-term chart
Bearish Scenario:
A confirmed break and daily close below 5,240 would weaken the bullish outlook and suggest deeper downside risk toward:
4,950 – minor support
4,610 – stronger support and potential demand zone
Outlook:
Neutral bias remains intact while the ADAUSD holds above 5,240 A sustained break below this level could shift momentum to the downside in the short term.
This communication is for informational purposes only and should not be viewed as any form of recommendation as to a particular course of action or as investment advice. It is not intended as an offer or solicitation for the purchase or sale of any financial instrument or as an official confirmation of any transaction. Opinions, estimates and assumptions expressed herein are made as of the date of this communication and are subject to change without notice. This communication has been prepared based upon information, including market prices, data and other information, believed to be reliable; however, Trade Nation does not warrant its completeness or accuracy. All market prices and market data contained in or attached to this communication are indicative and subject to change without notice.

ADAUSDTBINANCE:ADAUSDT is wait for breakout trendline for start bullish trend so we wait for this breakout and ADA give best signal for buy.

ADAUSD corrective pullback supported at 5,928The ADAUSD remains in a neutral trend, with recent price action indicating a corrective pullback within the broader trading range.
Support Zone: 5,928 – a key level from previous consolidation. Price is currently testing or approaching this level.
A bullish rebound from 5,928 would confirm ongoing upside momentum, with potential targets at:
6,600 – initial resistance
6,740 – psychological and structural level
6,900 – extended resistance on the longer-term chart
Bearish Scenario:
A confirmed break and daily close below 5,928 would weaken the bullish outlook and suggest deeper downside risk toward:
5,707 – minor support
5,344 – stronger support and potential demand zone
Outlook:
Neutral bias remains intact while the ADAUSD holds above 5,928 A sustained break below this level could shift momentum to the downside in the short term.
This communication is for informational purposes only and should not be viewed as any form of recommendation as to a particular course of action or as investment advice. It is not intended as an offer or solicitation for the purchase or sale of any financial instrument or as an official confirmation of any transaction. Opinions, estimates and assumptions expressed herein are made as of the date of this communication and are subject to change without notice. This communication has been prepared based upon information, including market prices, data and other information, believed to be reliable; however, Trade Nation does not warrant its completeness or accuracy. All market prices and market data contained in or attached to this communication are indicative and subject to change without notice.

CARDANO Last chance to keep the Bull Cycle running.Cardano (ADAUSD) has been trading within a Channel Up every since its December 26 2022 Bear Cycle bottom. That was also the time the 1W RSI has been at its lowest (hitting 30.00). The most recent bullish signal has been the 1W Golden Cross, its first ever.
Following this however, the price failed to break above the Lower Highs trend-line of the pattern's previous Higher High and got rejected back to its bottom (Higher Lows trend-line), which momentarily got broken on the October 10 flash crash. Still, the market instantly recovered and more importantly the 1W RSI found Support on its own 3-year Higher Lows Zone, which has been the most effective buy entry of the Bull Cycle.
As long as the price stays inside the Channel Up, the Bull Cycle remains alive. The confirmation of further upside, thus a new Bullish Leg, only comes technically if the price breaks above the Lower Highs trend-line again. If it does, we expect a Higher High on the 1.382 Fibonacci extension (every Higher High seems to decline, 1.786 to 1.5 Fib) at $1.900. A 1W candle closing below its 1W MA200 (orange trend-line), most likely confirms the new Bear Cycle.
-------------------------------------------------------------------------------
** Please LIKE 👍, FOLLOW ✅, SHARE 🙌 and COMMENT ✍ if you enjoy this idea! Also share your ideas and charts in the comments section below! This is best way to keep it relevant, support us, keep the content here free and allow the idea to reach as many people as possible. **
-------------------------------------------------------------------------------
💸💸💸💸💸💸
👇 👇 👇 👇 👇 👇

ADAUSD testing pivotal 6890 resistance levelThe ADAUSD remains in a neutral trend, with recent price action indicating a corrective pullback within the broader trading range.
Support Zone: 6,136 – a key level from previous consolidation. Price is currently testing or approaching this level.
A bullish rebound from 6,136 would confirm ongoing upside momentum, with potential targets at:
6,890 – initial resistance
7,090 – psychological and structural level
7,260 – extended resistance on the longer-term chart
Bearish Scenario:
A confirmed break and daily close below 6,136 would weaken the bullish outlook and suggest deeper downside risk toward:
5,640 – minor support
5,395 – stronger support and potential demand zone
Outlook:
Bullish bias remains intact while the ADAUSD holds above 5,916 A sustained break below this level could shift momentum to the downside in the short term.
This communication is for informational purposes only and should not be viewed as any form of recommendation as to a particular course of action or as investment advice. It is not intended as an offer or solicitation for the purchase or sale of any financial instrument or as an official confirmation of any transaction. Opinions, estimates and assumptions expressed herein are made as of the date of this communication and are subject to change without notice. This communication has been prepared based upon information, including market prices, data and other information, believed to be reliable; however, Trade Nation does not warrant its completeness or accuracy. All market prices and market data contained in or attached to this communication are indicative and subject to change without notice.

ADAUSD oversold bounce supported at 5,916The ADAUSD remains in a neutral trend, with recent price action indicating a corrective pullback within the broader trading range.
Support Zone: 5,916 – a key level from previous consolidation. Price is currently testing or approaching this level.
A bullish rebound from 5,916 would confirm ongoing upside momentum, with potential targets at:
6,830 – initial resistance
7,090 – psychological and structural level
7,260 – extended resistance on the longer-term chart
Bearish Scenario:
A confirmed break and daily close below 5,916 would weaken the bullish outlook and suggest deeper downside risk toward:
5,640 – minor support
5,395 – stronger support and potential demand zone
Outlook:
Bullish bias remains intact while the ADAUSD holds above 5,916 A sustained break below this level could shift momentum to the downside in the short term.
This communication is for informational purposes only and should not be viewed as any form of recommendation as to a particular course of action or as investment advice. It is not intended as an offer or solicitation for the purchase or sale of any financial instrument or as an official confirmation of any transaction. Opinions, estimates and assumptions expressed herein are made as of the date of this communication and are subject to change without notice. This communication has been prepared based upon information, including market prices, data and other information, believed to be reliable; however, Trade Nation does not warrant its completeness or accuracy. All market prices and market data contained in or attached to this communication are indicative and subject to change without notice.

ADAUSDTIn this week’s BINANCE:ADAUSDT analysis, after a bearish reaction from the 0.85 USD zone, the price remains consolidating below previous highs, showing weakness in bullish momentum on the daily timeframe. If the current support fails, a move toward lower zones is likely before a potential bullish correction begins from support levels.
Supports:
* 0.59 USD
* 0.51 USD
Resistances:
* 0.69 USD
* 0.85 USD

DeGRAM | ADAUSD is forming a triangle📊 Technical Analysis
● ADA/USD is consolidating within a falling wedge pattern, with strong support near 0.6240 and a resistance barrier at 0.7000.
● The structure indicates potential bullish reversal as price tests the lower boundary while forming higher lows, hinting at breakout momentum.
💡 Fundamental Analysis
● Cardano’s network activity and DeFi adoption continue to expand, supporting gradual recovery prospects despite broader crypto market caution.
✨ Summary
● Long bias above 0.6240; target zone 0.7000. Technical and on-chain dynamics align for medium-term upside continuation.
-------------------
Share your opinion in the comments and support the idea with a like. Thanks for your support!

ADAUSD Cardano key support at 5,916The ADAUSD remains in a neutral trend, with recent price action indicating a corrective pullback within the broader trading range.
Support Zone: 5,916 – a key level from previous consolidation. Price is currently testing or approaching this level.
A bullish rebound from 5,916 would confirm ongoing upside momentum, with potential targets at:
6,830 – initial resistance
7,090 – psychological and structural level
7,260 – extended resistance on the longer-term chart
Bearish Scenario:
A confirmed break and daily close below 5,916 would weaken the bullish outlook and suggest deeper downside risk toward:
5,640 – minor support
5,395 – stronger support and potential demand zone
Outlook:
Bullish bias remains intact while the ADAUSD holds above 5,916 A sustained break below this level could shift momentum to the downside in the short term.
This communication is for informational purposes only and should not be viewed as any form of recommendation as to a particular course of action or as investment advice. It is not intended as an offer or solicitation for the purchase or sale of any financial instrument or as an official confirmation of any transaction. Opinions, estimates and assumptions expressed herein are made as of the date of this communication and are subject to change without notice. This communication has been prepared based upon information, including market prices, data and other information, believed to be reliable; however, Trade Nation does not warrant its completeness or accuracy. All market prices and market data contained in or attached to this communication are indicative and subject to change without notice.

Cardano ADA - mid/Long term 1WAltseason is, of course, inevitable — the targets are roughly known in advance, yet the path toward them always remains a mystery.
That’s what makes this market so fascinating — watching it unfold and being part of this great cyclical game.
Currently, the price is moving inside a triangle formation, which could even turn out to be a bullish flag.
We’ll soon find out — as breakouts usually occur around 80% completion of the pattern, the intrigue might last until January, when the real move begins.

ADAUSD oversold bounce back capped at 6,830 resistance The ADAUSD remains in a neutral trend, with recent price action indicating a corrective pullback within the broader trading range.
Support Zone: 5,916 – a key level from previous consolidation. Price is currently testing or approaching this level.
A bullish rebound from 5,916 would confirm ongoing upside momentum, with potential targets at:
6,830 – initial resistance
7,090 – psychological and structural level
7,260 – extended resistance on the longer-term chart
Bearish Scenario:
A confirmed break and daily close below 5,916 would weaken the bullish outlook and suggest deeper downside risk toward:
5,640 – minor support
5,395 – stronger support and potential demand zone
Outlook:
Bullish bias remains intact while the ADAUSD holds above 5,916 A sustained break below this level could shift momentum to the downside in the short term.
This communication is for informational purposes only and should not be viewed as any form of recommendation as to a particular course of action or as investment advice. It is not intended as an offer or solicitation for the purchase or sale of any financial instrument or as an official confirmation of any transaction. Opinions, estimates and assumptions expressed herein are made as of the date of this communication and are subject to change without notice. This communication has been prepared based upon information, including market prices, data and other information, believed to be reliable; however, Trade Nation does not warrant its completeness or accuracy. All market prices and market data contained in or attached to this communication are indicative and subject to change without notice.

#ADA/USDT Spot LONG#ADA
The price is moving within a descending channel on the 1-hour frame, adhering well to it, and is heading for a strong breakout and retest.
We have a bearish trend on the RSI indicator that is about to be broken and retested, which supports the upward breakout.
There is a major support area in green at 0.6335, which represents a strong support point.
We are heading for consolidation above the 100 moving average.
Entry price: 0.6721
First target: 0.6868
Second target: 0.7001
Third target: 0.7184
Don't forget a simple matter: capital management.
When you reach the first target, save some money and then change your stop-loss order to an entry order.
For inquiries, please leave a comment.
Thank you.

Cardano Finds Opportunity Zone—Buyers Step InCardano’s price stands at $0.641 at the time of writing, holding above the $0.623 support. The altcoin remains under the $0.661 resistance, where repeated rejections have hindered its upward progress over the past week.
If current conditions persist, ADA could breach $0.661 and aim for $0.696. However, for Cardano to mark a true recovery, it must reach and sustain levels above $0.754. Such a move would confirm renewed market strength and investor optimism.
Conversely, if ADA faces renewed selling, the price could drop below $0.623 and test $0.608. A failure to hold these supports would invalidate the bullish outlook and potentially trigger further downside pressure.

ADA/USDT — at a Make-or-Break Zone: Will Bulls Defend?Cardano (ADA) is now sitting at a critical decision point, testing the major demand zone between 0.55–0.625 USDT — a key level that has acted as the foundation for multiple rallies since early 2024. This zone represents the battlefield between long-term buyers and sellers, where price reactions have historically triggered large directional moves.
Recently, ADA experienced a deep liquidity sweep, leaving a long wick below the zone — a common sign of stop-loss hunting or institutional accumulation. Such moves often occur before a trend reversal, making this area one of the most strategic zones to watch in the coming weeks.
---
Pattern and Market Structure Analysis
The yellow block (0.55–0.625) is a macro demand/support zone, repeatedly tested and defended by buyers.
Main resistances are located at 0.9239, 1.2075, and 1.3264, forming the upper bounds of ADA’s broader trading range.
The overall structure shows a wide consolidation phase, potentially signaling re-accumulation if the current zone holds.
The long wick beneath support reflects a liquidity grab, often used by smart money to fill large buy orders before an upward move.
---
Bullish Scenario — Potential Start of a Major Rebound
1. Price holds and rebounds from 0.55–0.625 with a strong bullish reversal candle (bullish engulfing, hammer, or pin bar).
2. Increasing buying volume confirms accumulation interest at this level.
3. A clean breakout and daily close above 0.9239 would confirm bullish continuation toward 1.20 and 1.32.
4. Formation of a higher low above 0.625 will further validate a new uptrend structure.
🎯 Bullish Targets:
TP1: 0.92
TP2: 1.20
TP3: 1.32
📉 Suggested Stop Loss: Below 0.53 (outside the demand zone).
Narrative:
If this pattern confirms, ADA could begin a new major recovery wave, potentially marking the start of a strong uptrend cycle heading into 2026.
---
Bearish Scenario — Breakdown and Failed Retest
1. Price fails to hold above 0.55 and closes decisively below the yellow zone.
2. High selling volume confirms continuation pressure.
3. A failed retest of 0.55–0.625 as new resistance strengthens bearish momentum.
4. The next key downside targets are 0.40 and 0.27, both major liquidity levels.
🎯 Bearish Targets:
TP1: 0.40
TP2: 0.27
📈 Confirmation: Daily candle close below 0.55 with strong volume.
Narrative:
If this support collapses, ADA could enter a mid-term redistribution phase, potentially setting a new bottom before the next macro bull run.
---
Conclusion and Strategic Outlook
The 0.55–0.625 zone is ADA’s make-or-break region — a critical level that will likely define its direction for the months ahead.
Holding the zone could trigger a strong reversal rally toward 0.92–1.32.
Losing it would confirm a bearish continuation toward 0.27.
Traders should wait for confirmation through daily candle closes and volume surges before committing to major positions.
This zone offers both a high-risk accumulation opportunity for patient investors and a decisive pivot area for short-term traders.
---
#ADA #Cardano #ADAUSDT #CryptoAnalysis #TechnicalAnalysis #PriceAction #SupportZone #ReversalZone #Altcoin #CryptoMarket #DemandZone

ADA situation!Price is currently forming a triangle pattern, which presents two possible scenarios: bullish or bearish. I lean toward the bullish outlook, as the price is showing strong support within the PRZ (Potential Reversal Zone). If this assumption holds, we can expect a potential upward move.

Cardano Inflows Jump To 3-Month High As Holders Rescue ADA PriceCardano’s price currently hovers above the $0.66 support level but risks slipping below it if bearish momentum continues. A drop under this line could push ADA down to $0.60 in the coming days.
Continued whale selling could exacerbate downward pressure even if inflows remain strong. Persistent profit-taking from large holders would make sustained recovery more difficult.
However, if ADA manages to hold $0.66 and attract renewed buying interest, the altcoin could rise above $0.69 and potentially reach $0.75. Such a move would invalidate the bearish outlook and mark the start of a short-term rebound.

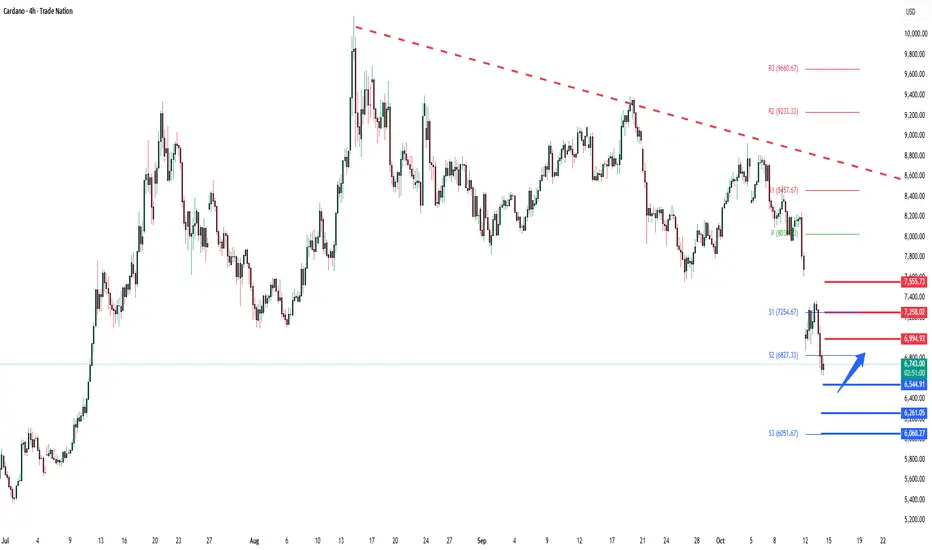
ADAUSD corrective pullback support at 6,545The ADAUSD remains in a neutral trend, with recent price action showing signs of a corrective pullback within the broader range trading.
Support Zone: 6,544 – a key level from previous consolidation. Price is currently testing or approaching this level.
A bullish rebound from 6,544 would confirm ongoing upside momentum, with potential targets at:
6,995 – initial resistance
7,258 – psychological and structural level
7,555 – extended resistance on the longer-term chart
Bearish Scenario:
A confirmed break and daily close below 6,544 would weaken the bullish outlook and suggest deeper downside risk toward:
6,260 – minor support
6,060 – stronger support and potential demand zone
Outlook:
Bullish bias remains intact while the ADAUSD holds above 6,544 A sustained break below this level could shift momentum to the downside in the short term.
This communication is for informational purposes only and should not be viewed as any form of recommendation as to a particular course of action or as investment advice. It is not intended as an offer or solicitation for the purchase or sale of any financial instrument or as an official confirmation of any transaction. Opinions, estimates and assumptions expressed herein are made as of the date of this communication and are subject to change without notice. This communication has been prepared based upon information, including market prices, data and other information, believed to be reliable; however, Trade Nation does not warrant its completeness or accuracy. All market prices and market data contained in or attached to this communication are indicative and subject to change without notice.
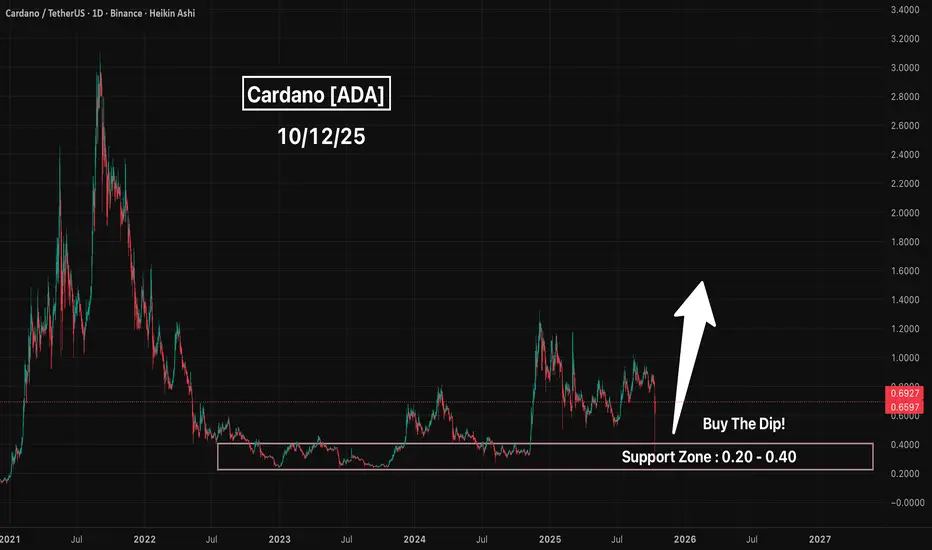
Cardano (ADA) - Price Action Looking Strong Bullish! Cardano (ADA) — Price Action Looking Strong 👀
Cardano just had a huge dip into the support zone. That’s exactly what you want to see from a healthy market setup.
This move likely cleared out weak hands and filled some serious buy orders in that $0.34–$0.36 range. The bounce that followed shows there’s still strong demand sitting underneath.
If ADA can hold above this zone, I wouldn’t be surprised to see it build momentum in the coming weeks as Bitcoin continues to push higher. Historically, ADA tends to lag a bit, but once it catches fire, it runs fast.
This might honestly be one of the last chances to grab ADA cheap before a bigger breakout move.
Key areas I’m watching:
🔹 Support: $0.20–$0.40 (liquidity sweep zone)
🔹 Next resistance: $1.33+ (psychological and structural breakout zone)
🔹 Bigger breakout target: $3.00-$5.00+ (breaking previous ATH if BTC keeps leading)
Not financial advice, but the setup looks clean. Structure’s shifting, liquidity’s cleared, and sentiment’s turning — this is where smart money usually starts paying attention.