#ADA/USDT Spot LONG#ADA
The price is moving within a descending channel on the hourly timeframe. It has reached the lower boundary and is heading towards a breakout, with a retest of the upper boundary expected.
The Relative Strength Index (RSI) is showing a downward trend, approaching the lower boundary, and an upward bounce is anticipated.
There is a key support zone in green at 0.3350, and the price has bounced from this level several times and is expected to bounce again.
The indicator is showing a trend towards consolidation above the 100-period moving average, which we are approaching, supporting the upward move.
Entry Price: 0.3606
Target 1: 0.3676
Target 2: 0.3765
Target 3: 0.3873
Stop Loss: Below the green support zone.
Remember this simple thing: Money management.
For any questions, please leave a comment.
Thank you.
Adausdlong

#ADA/USD Buy Trade Scenario.Here’s an up-to-date ADA/USD Buy trade outlook (technical + fundamental) to help you assess whether positioning for a Upside makes sense right now.
Thank You......

#ADA/USDT Spot LONG#ADA
The price is moving within a descending channel on the hourly timeframe. It has reached the lower boundary and is heading towards a breakout, with a retest of the upper boundary expected.
The Relative Strength Index (RSI) is showing a downward trend, approaching the lower boundary, and an upward bounce is anticipated.
There is a key support zone in green at 0.3950, and the price has bounced from this level several times. Another bounce is expected.
The RSI is showing a trend towards consolidation above the 100-period moving average, which we are approaching, supporting the upward move.
Entry Price: 0.4050
First Target: 0.4096
Second Target: 0.4194
Third Target: 0.4296
Stop Loss: Below the green support zone.
Remember this simple thing: Money management.
For any questions, please leave a comment.
Thank you.

#ADA/USDT Spot LONG#ADA
The price is moving within a descending channel on the hourly timeframe. It has reached the upper boundary and is heading towards breaking it. A retest of this boundary is expected.
The Relative Strength Index (RSI) is showing an upward trend, as it has approached the upper boundary. A bearish reversal is expected.
There is a key support zone in green at 0.3800. The price has bounced from this zone several times and is expected to bounce again.
A consolidation trend is observed above the 100-period moving average, which we are approaching. This trend supports a decline towards this level.
Entry Price: 0.3916
Target 1: 0.4018
Target 2: 0.4155
Target 3: 0.4296
Stop Loss: Above the green support zone.
Remember this simple thing: Money management.
For any questions, please leave a comment.
Thank you.

#ADA//USDT Spot LONG #ADA
The price is moving in a descending channel on the 1-hour timeframe. It has reached the lower boundary and is heading towards breaking above it, with a retest of the upper boundary expected.
We have a downtrend on the RSI indicator, which has reached near the lower boundary, and an upward rebound is expected.
There is a key support zone in green at 0.3558. The price has bounced from this zone multiple times and is expected to bounce again.
We have a trend towards stability above the 100-period moving average, as we are moving close to it, which supports the upward movement.
Entry price: 0.3690
First target: 0.3741
Second target: 0.3842
Third target: 0.3976
Don't forget a simple principle: money management.
Place your stop-loss order below the green support zone.
For any questions, please leave a comment.
Thank you.

ADAUSDT – Daily Chart. ADAUSDT – Daily Chart.
Macro downtrend intact (descending channel)
The price is sitting at a major HTF demand level after a prolonged sell-off.
Selling momentum is exhausting near channel support
Price is compressing → base formation possible
This zone often leads to sideways accumulation before expansion
Support: 0.35 – 0.32 (critical demand zone)
Invalidation: Below 0.30
First Resistance: 0.48 – 0.52
Major Supply: 0.70 – 0.82 (previous value area)
In Extreme Fear, strong coins usually move sideways at support to absorb sell pressure before trend reversal.
No blind longs. Wait for structure shift + volume confirmation.
DYOR | NFA

Cardano: Final Retest of Demand Before Parabolic Leg?This weekly BINANCE:ADAUSDT idea maps out a possible end‑of‑cycle accumulation inside the large red demand box that has held price since 2023. I work with this fib levels since top in 2021.
Price is retesting this zone while still trading under the long‑term descending trendline, (line chart) creating conditions for a potential macro breakout once that line is reclaimed and flipped to support. The dashed path outlines an impulsive leg toward the mid‑range around 1.30–1.95, (to 0.5 of fib Weekly) followed by higher Fibonacci extensions up to the 1.618 at roughly 4.55, with invalidation below the lower boundary of the demand box

ADA - Bearish Expanding TrianglePrice is trading within a broadening (expanding) triangle , with higher highs and lower lows indicating increasing volatility and distribution. The structure favors a bearish resolution , and I’m expecting a breakdown below the lower trendline to confirm continuation to the downside.
Expectations:
Breakdown from the expanding triangle → acceleration lower.
Downside Targets:
🎯 $0.25
🎯 $0.15
As long as price stays below the upper boundary, the bearish scenario remains dominant.
ADA – Downtrend Dominates, Risk of Deeper PullbackHello everyone,
On the chart, the downtrend remains clearly intact, with a persistent sequence of lower highs and lower lows extending from October to the present. Price is trading entirely below EMA34 and EMA89, both of which are sharply sloping downward. This confirms that sellers continue to control the market, with no meaningful signs of exhaustion so far.
Throughout November and December, all rebound attempts have been weak, short-lived, and repeatedly rejected around the EMA34 near the 0.45 USD area. This behavior suggests that buying pressure is purely technical in nature and insufficient to form a reversal structure. At the moment, ADA is hovering around the nearby support zone of 0.37–0.39 USD. However, the current D1 candle structure — small bodies, short lower wicks, and declining volume — indicates fading momentum, a pattern that often precedes a breakdown of support.
From an EMA perspective, the widening gap between price and EMA34 (0.452) as well as EMA89 (0.560) further confirms that the downtrend is expanding rather than contracting. To shift the market’s bias, ADA would need at least a daily close above 0.45 USD. At this stage, there are no early signals supporting such a scenario. Volume has continued to dry up over recent weeks and is concentrated mainly on bearish candles, implying a lack of fresh inflows, while sellers still require relatively little pressure to push prices lower.
Based on the current technical picture, the highest-probability scenario remains a breakdown below the 0.37–0.38 support zone, followed by an extension of the decline toward deeper support around 0.30–0.33 USD. This area represents a significant liquidity zone that previously acted as a major support, where price could eventually see a technical bounce or begin forming a new accumulation base. Until ADA approaches that region, there is still insufficient evidence to expect a genuine trend reversal.
Wishing you all a successful trading day!

What I think is going on with Cardano right nowThis is my personal opinion and update regarding Cardano. It is not a financial advice.

ADAUSDT —Breakout: 0.4355–0.4150 Will Decide the Next Trend?ADA is approaching a critical phase after successfully breaking above a major descending trendline that has guided the market lower for weeks. This breakout signals a potential shift in momentum, but the bullish move is not confirmed yet. Everything now depends on how price reacts to the 0.4355–0.4150 demand zone, the yellow block on the chart.
This zone is not just a simple consolidation range; it is the area where buyers previously stepped in aggressively and prevented deeper downside. If price retests this zone and holds, the breakout gains strong validity and opens the door for a broader trend reversal.
The breakout has happened. The market will now decide whether this is the beginning of a larger bullish leg, or merely a relief bounce within the existing downtrend.
---
Bullish Scenario
The bullish case remains intact as long as ADA holds above the 0.4355–0.4150 zone. A clean retest followed by a strong bullish 8h close would confirm buyers are in control.
If bullish confirmation holds:
First target: 0.5200, a key pivot resistance
Break above 0.52 leads to the next level at 0.5925
Sustained momentum could push ADA into the 0.6800–0.7300 zone
A full extension points toward the 0.8750 supply area, the larger upside magnet
As long as the yellow zone holds, the bias remains bullish.
---
Bearish Scenario
The bearish outlook only activates if price convincingly breaks back below 0.4150, invalidating the breakout and signaling that sellers still dominate the trend.
If a breakdown occurs:
Initial downside target sits around 0.375–0.360, the previous structural lows
Losing this level opens the possibility of forming a new lower low
In short, bearish momentum returns only if the key demand zone fails.
---
Pattern & Market Structure
Clean breakout from a major descending trendline
Price currently testing the transition phase between downtrend continuation or higher-low formation
The 0.4355–0.4150 zone acts as the trend validation zone, the most critical area on the chart
This is the most important structural zone ADA has interacted with in weeks.
#ADA #Cardano #ADAUSDT #CryptoAnalysis #Breakout #DemandZone #TechnicalAnalysis #MarketStructure

ADA : LIVE TRADE
Hello friends
According to the channel in which the price is located, you can see that every time it reached support, we had a growth, and now that it has reached the same support, we can expect another growth.
This analysis is purely technically reviewed and is not a buy or sell recommendation, so do not act emotionally and observe risk and capital management.
*Trade safely with us*

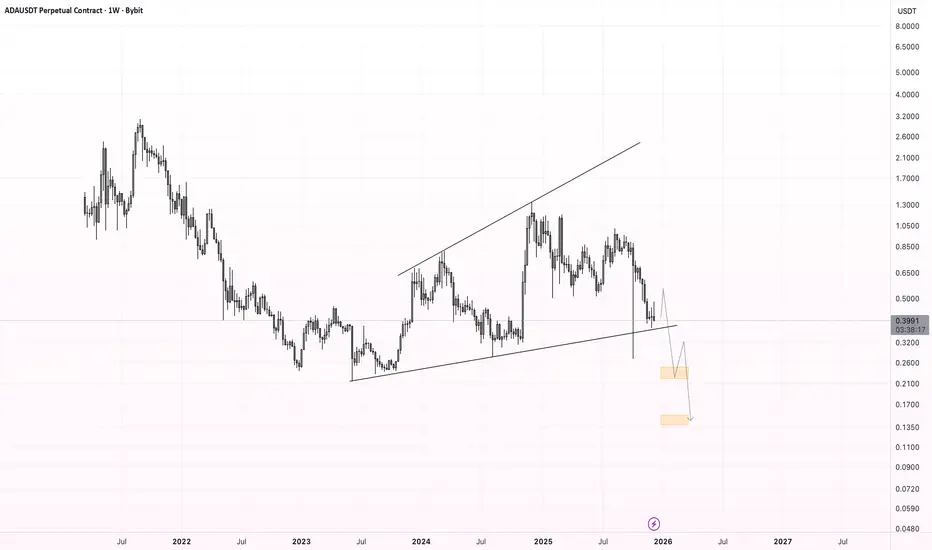
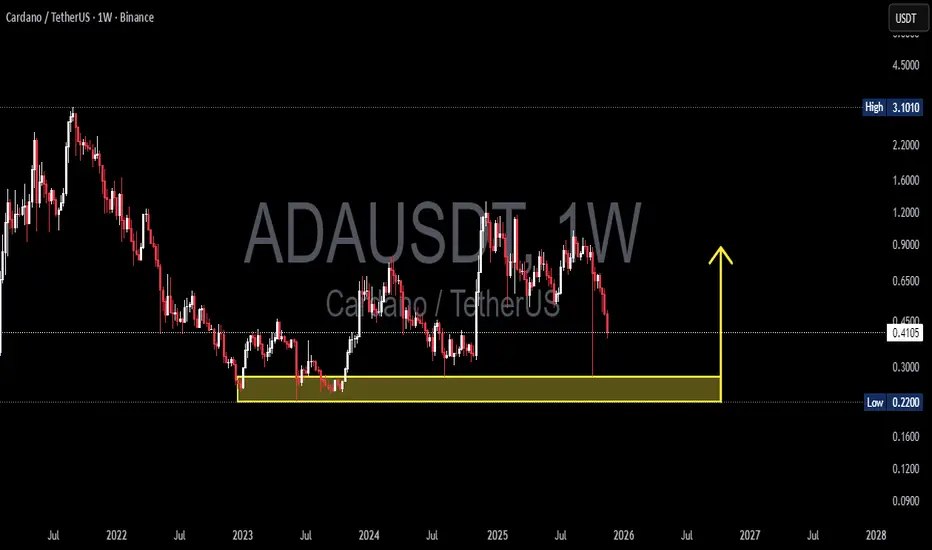
ADA/USDT — Major Reversal or Deep Breakdown?ADA/USDT on the weekly timeframe has returned to one of the most decisive zones since 2022.
The 0.275–0.22 region is not just another support — it is a historical demand and accumulation block where major reversals have repeatedly formed.
This week, ADA once again tapped this zone with a long downside wick, signaling a massive liquidity sweep. This is a clear indication that larger players are active here, collecting liquidity before choosing the next major direction.
This chart doesn’t reflect a simple pullback — it reflects the early stages of a major battle between long-term buyers and the dominant sellers who have controlled the trend since 2021.
---
🔥 Key Pattern & Market Dynamics
1. Long-term downtrend structure
Since the macro top, ADA has continued forming lower highs, maintaining bearish pressure in the weekly structure.
2. Strong accumulation demand (0.275–0.22)
This area has produced three major reversals in the past.
The latest reaction suggests either:
A liquidity hunt before a potential rebound, or
The beginning of a deeper breakdown if buyers fail to defend it.
3. Increased volatility
A wick of this size is rarely random.
It often precedes large directional moves, especially on the weekly chart.
---
📈 Bullish Scenario (If the Zone Holds)
A bullish continuation requires clear conditions:
✔ Strong rejection from 0.275–0.22
✔ Weekly close above the pivot zone at 0.40–0.45
✔ Formation of a higher-low structure
If confirmed, ADA may begin a structural trend reversal with:
Target 1: 0.65
Target 2: 1.00 – 1.20 (if volume expansion supports the breakout)
This would mark a shift from long-term weakness to medium-term recovery.
---
📉 Bearish Scenario (If the Zone Breaks)
A weekly close below 0.22 would be a significant bearish signal:
Historical demand fails
Market structure breaks down
A deeper markdown phase begins
Downside targets:
0.16 — next major psychological support
0.09 — historical accumulation zone
A loss of 0.22 would be one of ADA’s strongest bearish confirmations in years.
---
🧠 Core Message for Traders
This is not an ordinary support level —
this is a macro decision point that will define ADA’s direction for months ahead.
ADA now stands exactly where it stood in 2022–2023, and from this zone the market has only two paths:
➡ Hold the historical accumulation zone and reverse upward
or
➡ Break below it and enter a deeper long-term downtrend
Professional traders do not guess —
they wait for the weekly close, analyze volume, and watch how the market reacts to this key zone.
---
#ADA #ADAUSDT #Cardano #CryptoAnalysis #PriceAction #MarketStructure #WeeklyChart #SupportZone #CryptoTrading #CryptoOutlook
Cardano - This coin is holding strong!🔋Cardano ( CRYPTO:ADAUSD ) still remains bullish:
🔎Analysis summary:
Despite this month's massive crypto crackdown, Cardano already recovered about +100%. We simply saw a perfect rejection of a major confluence of support, pushing price higher. Soon, Cardano will break out of the triangle and a bullish breakout remains rather likely.
📝Levels to watch:
$0.8
SwingTraderPhil
SwingTrading.Simplified. | Investing.Simplified. | #LONGTERMVISION

ADAUSDTBINANCE:ADAUSDT is wait for breakout trendline for start bullish trend so we wait for this breakout and ADA give best signal for buy.

ADAUSDTIn this week’s BINANCE:ADAUSDT analysis, after a bearish reaction from the 0.85 USD zone, the price remains consolidating below previous highs, showing weakness in bullish momentum on the daily timeframe. If the current support fails, a move toward lower zones is likely before a potential bullish correction begins from support levels.
Supports:
* 0.59 USD
* 0.51 USD
Resistances:
* 0.69 USD
* 0.85 USD

#ADA/USDT Spot LONG#ADA
The price is moving within a descending channel on the 1-hour frame, adhering well to it, and is heading for a strong breakout and retest.
We have a bearish trend on the RSI indicator that is about to be broken and retested, which supports the upward breakout.
There is a major support area in green at 0.6335, which represents a strong support point.
We are heading for consolidation above the 100 moving average.
Entry price: 0.6721
First target: 0.6868
Second target: 0.7001
Third target: 0.7184
Don't forget a simple matter: capital management.
When you reach the first target, save some money and then change your stop-loss order to an entry order.
For inquiries, please leave a comment.
Thank you.

Cardano Finds Opportunity Zone—Buyers Step InCardano’s price stands at $0.641 at the time of writing, holding above the $0.623 support. The altcoin remains under the $0.661 resistance, where repeated rejections have hindered its upward progress over the past week.
If current conditions persist, ADA could breach $0.661 and aim for $0.696. However, for Cardano to mark a true recovery, it must reach and sustain levels above $0.754. Such a move would confirm renewed market strength and investor optimism.
Conversely, if ADA faces renewed selling, the price could drop below $0.623 and test $0.608. A failure to hold these supports would invalidate the bullish outlook and potentially trigger further downside pressure.

Cardano Inflows Jump To 3-Month High As Holders Rescue ADA PriceCardano’s price currently hovers above the $0.66 support level but risks slipping below it if bearish momentum continues. A drop under this line could push ADA down to $0.60 in the coming days.
Continued whale selling could exacerbate downward pressure even if inflows remain strong. Persistent profit-taking from large holders would make sustained recovery more difficult.
However, if ADA manages to hold $0.66 and attract renewed buying interest, the altcoin could rise above $0.69 and potentially reach $0.75. Such a move would invalidate the bearish outlook and mark the start of a short-term rebound.

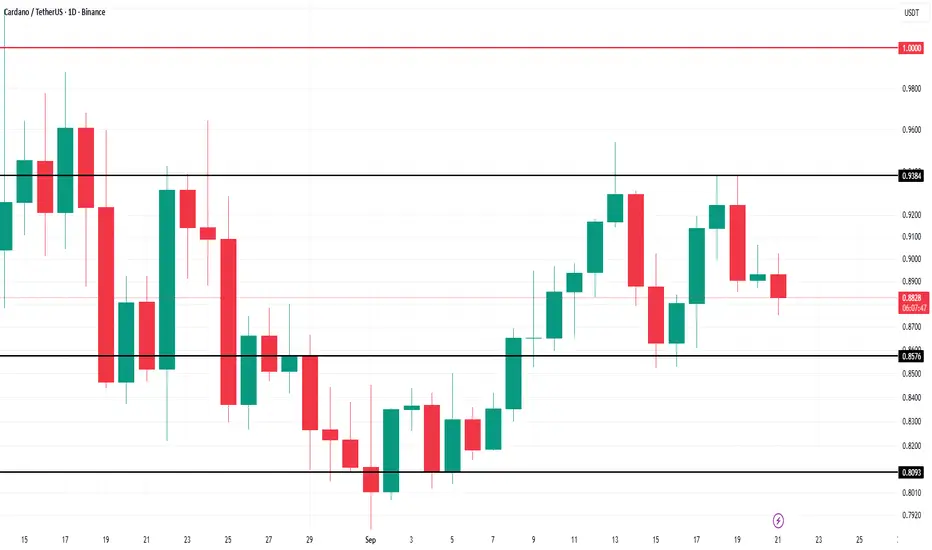
Cardano Price Gains Capped by Long-Term Holder PressureCardano’s price currently trades at $0.87, hovering just below its immediate resistance of $0.88. The token remains approximately 14% away from the psychologically important $1.00 level, a threshold that could reignite market enthusiasm if successfully breached.
Given the mixed outlook from investors and technical indicators, ADA is likely to continue its sideways movement. The cryptocurrency may remain rangebound between $0.83 and $0.88 until decisive buying volume emerges.
However, if long-term holders pause their selling and market sentiment improves, ADA could break past the $0.88 barrier and rise toward $0.93. Such a move would restore bullish confidence and potentially pave the way for a broader recovery phase in the weeks ahead

BUY AND HOLDHello friends
You see that after the good rise we had, the price is correcting, which is a natural thing and there is no need to worry, and in these corrections, you can buy in steps with capital and risk management and move with it to the specified goals.
Note that the holding period is at least 3 months, so be patient and observe capital management.
*Trade safely with us*

ADA/USDT; FREE SIGNALHello friends
According to the market cycle, you can see that every time after the price growth we had a correction and now it seems that the price wants to exit the correction and have a new growth. If the support levels continue, the price can move to the specified targets.
*Trade safely with us*

Cardano Whales $500 Million ADA Selling To Delay Price Rise To $Cardano’s price sits at $0.888 at press time, holding slightly above the $0.880 support. However, the current environment suggests a risk of losing this critical level if bearish sentiment intensifies. The vulnerability to downside remains clear as whale selling persists.
Should ADA fall through $0.880, the next key support sits at $0.837. A drop to this level would extend recent losses and may prompt further liquidation from smaller holders, creating additional downward pressure. This could stall ADA’s path to recovery.
Conversely, a successful bounce off $0.880 could open a short-term rally toward $0.931. Flipping this resistance into support would improve market sentiment, enabling ADA to target $0.962. Breaking this barrier would invalidate the bearish thesis and bring Cardano closer to $1.