#ADA/USDT Spot LONG#ADA
The price is moving within a descending channel on the hourly timeframe. It has reached the lower boundary and is heading towards a breakout, with a retest of the upper boundary expected.
The Relative Strength Index (RSI) is showing a downward trend, approaching the lower boundary, and an upward bounce is anticipated.
There is a key support zone in green at 0.2750, and the price has bounced from this level several times. Another bounce is expected.
The RSI is showing a trend towards consolidation above the 100-period moving average, which we are approaching, supporting the upward move.
Entry Price: 0.2900
First Target: 0.2936
Second Target: 0.3032
Third Target: 0.3160
Stop Loss: Below the green support zone.
Remember this simple thing: Money management.
For any questions, please leave a comment.
Thank you.
Adausdtlong

ADAUSDT - 1H - WHAT TO EXPECT TODAY ? 03-02-2026ADAUSDT - still kinda on the "move" and after some "INSTITUTIONAL" manipulations will continue DOWN...
Sadly any Set- Ups for trades "mutated " and multiply to 5m failed set ups, developed institutional "accumulation" and SL sweep range .
I'm not going to repost a pretty much similar charts for the most crypto pairs. After some analysing by your self you will find a plenty of Institutional manipulations today...
Stay "SAFE" today, don't rush with entering trades, seems going to be Loss Stop "hunting" day...
Educational "piece":
An Institutional Stop Loss (SL) Sweep (also known as a liquidity sweep or stop hunt)
is a trading concept within Smart Money Concepts (SMC)
where large financial institutions deliberately drive prices beyond well-defined support or resistance levels to trigger the clustered stop-loss orders of retail traders
Chart is itself explaining. Kept a "KISS" approach all the way ( "Keep It Simple, Stupid") & beginners friendly... ;)
I do hope that nobody ignoring SL ( Stop Loss) ! Without it, It is a fastest way to loose hard earned money...
;)
Trade safe & don't do "gambling". In the end it never pays, not worth it to risk loose all your $...
PS: above technical analysis is done for the community & educational purpose only! It is not a financial advice. Just share my very own insight to it.

ADAUSDT 1,938% profits potential with 6X leverage —LONG tradeCardano is in the same situation as Dogecoin which I shared with you just minutes ago. The action is happening at bottom prices for months, at the lowest since November 2024 based on candle close. Truly, bottom prices.
When the action was happening at this same level back in late 2024, a very strong advanced developed leading to the peak in December 2024. ADAUSDT closed five consecutive weeks green. The market then turned bearish until present day; lower lows and lower highs. Bearish volume has been declining since March 2025 when it peaked. This signal supports everything related to a reversal.
The main target for me based on past history and chart structure sits around $1.19 - $1.35. Strong resistance can be found at $1 also and some minor stops before these levels.
On a bullish move, +100% would be the bare minimum and worst case scenario.
Higher targets are also possible but this is hard to visualize. Since this is a leveraged trade-setup, we are more conservative with the targets. The most important part is to secure a good entry and thus a good position. As the market starts to run, we can update our targets if necessary based on marketwide action. But we start conservative to play it safe. If we confirm that a bull run will develop, then surely we adapt to market conditions to aim higher.
Thank you for reading...
Full trade-numbers below:
____
LONG ADAUSDT
Leverage: 6X
Potential: 1938%
Allocation: 5%
Entry zone: $0.3100 - $0.3600
Targets:
1) $0.4444
2) $0.5555
3) $0.6465
4) $0.7344
5) $0.8597
6) $1.0192
7) $1.1950
8) $1.3040
9) $1.4799
Stop: Close weekly below $0.3000
____
Namaste.

#ADA/USDT Spot LONG#ADA
The price is moving within a descending channel on the hourly timeframe. It has reached the lower boundary and is heading towards a breakout, with a retest of the upper boundary expected.
The Relative Strength Index (RSI) is showing a downward trend, approaching the lower boundary, and an upward bounce is anticipated.
There is a key support zone in green at 0.3350, and the price has bounced from this level several times and is expected to bounce again.
The indicator is showing a trend towards consolidation above the 100-period moving average, which we are approaching, supporting the upward move.
Entry Price: 0.3606
Target 1: 0.3676
Target 2: 0.3765
Target 3: 0.3873
Stop Loss: Below the green support zone.
Remember this simple thing: Money management.
For any questions, please leave a comment.
Thank you.

#ADA/USDT Spot LONG#ADA
The price is moving within a descending channel on the hourly timeframe. It has reached the lower boundary and is heading towards a breakout, with a retest of the upper boundary expected.
The Relative Strength Index (RSI) is showing a downward trend, approaching the lower boundary, and an upward bounce is anticipated.
There is a key support zone in green at 0.3950, and the price has bounced from this level several times. Another bounce is expected.
The RSI is showing a trend towards consolidation above the 100-period moving average, which we are approaching, supporting the upward move.
Entry Price: 0.4050
First Target: 0.4096
Second Target: 0.4194
Third Target: 0.4296
Stop Loss: Below the green support zone.
Remember this simple thing: Money management.
For any questions, please leave a comment.
Thank you.

#ADA/USDT Spot LONG#ADA
The price is moving within a descending channel on the hourly timeframe. It has reached the upper boundary and is heading towards breaking it. A retest of this boundary is expected.
The Relative Strength Index (RSI) is showing an upward trend, as it has approached the upper boundary. A bearish reversal is expected.
There is a key support zone in green at 0.3800. The price has bounced from this zone several times and is expected to bounce again.
A consolidation trend is observed above the 100-period moving average, which we are approaching. This trend supports a decline towards this level.
Entry Price: 0.3916
Target 1: 0.4018
Target 2: 0.4155
Target 3: 0.4296
Stop Loss: Above the green support zone.
Remember this simple thing: Money management.
For any questions, please leave a comment.
Thank you.

#ADA//USDT Spot LONG #ADA
The price is moving in a descending channel on the 1-hour timeframe. It has reached the lower boundary and is heading towards breaking above it, with a retest of the upper boundary expected.
We have a downtrend on the RSI indicator, which has reached near the lower boundary, and an upward rebound is expected.
There is a key support zone in green at 0.3558. The price has bounced from this zone multiple times and is expected to bounce again.
We have a trend towards stability above the 100-period moving average, as we are moving close to it, which supports the upward movement.
Entry price: 0.3690
First target: 0.3741
Second target: 0.3842
Third target: 0.3976
Don't forget a simple principle: money management.
Place your stop-loss order below the green support zone.
For any questions, please leave a comment.
Thank you.

ADAUSDT Near Major Breakout Level — Trend Reversal or Bull Trap?On the 12-hour timeframe, ADAUSDT remains within a clear medium-term downtrend structure. Over the past few months, price has consistently formed lower highs and lower lows, capped by a dominant descending trendline.
However, recent price action shows an early bullish reaction from the lower support area, suggesting a potential transition phase or a short-term relief rally.
---
Pattern & Technical Structure
Primary Pattern:
Descending Trendline / Bearish Channel Breakdown Test
Price has been trading below the descending trendline (dynamic resistance) for an extended period.
The latest candles indicate a retest of the trendline, which now acts as a critical decision zone.
The marked horizontal levels (yellow dashed lines) represent key historical support and resistance zones.
Pattern Summary:
As long as price remains below the trendline, the broader structure stays bearish. A valid break and close above the trendline would be the first signal of a potential trend reversal or short-term bullish continuation.
---
Key Levels
Major Resistance:
0.413
0.468
0.520
High Resistance / Reversal Zone:
0.616 – 0.682
Key Support:
0.370
0.345
0.321 (structural low)
---
Bullish Scenario
Price successfully breaks and closes above the descending trendline (12H close).
Trendline flips into support after a successful retest.
Upside targets:
TP1: 0.413
TP2: 0.468
TP3: 0.520
If bullish momentum and volume expand, further upside toward 0.616 – 0.682 becomes possible.
Bullish Confirmation:
Higher low formation
Minor market structure shift
Strong candle close, not just a wick
---
Bearish Scenario
Price fails to break the trendline and forms a clear rejection (long upper wick / bearish engulfing).
Price revisits lower support zones:
First support: 0.370
Next support: 0.345
Worst-case scenario: 0.321 (new lower low)
A breakdown below 0.321 would confirm continuation of the major downtrend.
Bearish Confirmation:
Clear rejection at the trendline
Lower high formation
Increasing selling volume
---
Conclusion
ADAUSDT is currently at a critical decision zone.
The macro trend remains bearish, but the recent bullish reaction from lower support opens room for a short-term reversal or relief rally.
Traders are advised to wait for confirmation — either a breakout or rejection — at the trendline, as this area will define the next major move.
---
#ADA #ADAUSDT #Cardano #CryptoAnalysis #TechnicalAnalysis #Downtrend #Trendline #SupportResistance #Altcoins

ADAUSDT – Daily Chart. ADAUSDT – Daily Chart.
Macro downtrend intact (descending channel)
The price is sitting at a major HTF demand level after a prolonged sell-off.
Selling momentum is exhausting near channel support
Price is compressing → base formation possible
This zone often leads to sideways accumulation before expansion
Support: 0.35 – 0.32 (critical demand zone)
Invalidation: Below 0.30
First Resistance: 0.48 – 0.52
Major Supply: 0.70 – 0.82 (previous value area)
In Extreme Fear, strong coins usually move sideways at support to absorb sell pressure before trend reversal.
No blind longs. Wait for structure shift + volume confirmation.
DYOR | NFA

Cardano Reversal Incoming?Hey traders,
After a tough 2025 (-70% YTD), Cardano is flashing one of the strongest setup I've seen for a reversal.
Why I'm buying ADA now:
Weekly Fibonacci Perfection: Price is hugging the 1.0 retracement level (~$0.37) from the recent swing high – this has acted as major support multiple times. Holding here = classic bottom formation. (Check the weekly chart – we're right on it!)
Undervalued AF: At ~$0.37–$0.38, we're at levels not seen since early cycle lows. Heavy realized losses in December ($900M+ capitulated) means sellers are exhausted – prime time for accumulation.
Friday Price Action = Strong Buyers Showed Up: Last Friday's candle defended the lows hard, closing with conviction. Volume picked up on the bounce, and we're seeing exchange outflows + whale adds. Reversal signals like TD Sequential buys and oversold RSI divergence are aligning.
Short-term: Watching for a break above $0.42–$0.45 resistance for confirmation. If we hold $0.36–$0.37 support, targeting $0.50–$0.54 next (prior highs), then $0.70+ if momentum kicks in.
Long-term still bullish with upgrades - Key Catalysts for 2026
Ouroboros Leios (Q1 rollout): Major consensus upgrade for 1,000+ TPS scalability while maintaining decentralization.
Midnight mainnet (early 2026): Privacy sidechain with selective disclosure, potentially boosting cross-chain adoption and NIGHT token synergy.
Bitcoin DeFi integration and tier-1 stablecoins (USDT/USDC): Aimed at deepening liquidity and TVL growth.
Systemic resilience focus, governance maturity, and treasury-funded initiatives (e.g., Venture Hub, DeFi liquidity injections).
Not financial advice , manage risk! What's your take on ADA here?

ADAUSDT: Bullish Push to 0.45?BINANCE:ADAUSDT is eyeing a bullish rebound on the 4-hour chart , with price forming higher lows after touching the downward trendline and cumulative long liquidation zone, converging with a potential entry area that could ignite upside momentum if buyers defend against short-term dips. This setup suggests a reversal opportunity amid recent downtrend, targeting higher resistance levels with strong risk-reward .🔥
Entry between 0.3780–0.3880 for a long position. Targets at 0.43 (first), 0.45 (second). Set a stop loss at a daily close below 0.37 , yielding a risk-reward ratio of approximately 1:2.5 to first target and up to 1:3.5 overall . Monitor for confirmation via a bullish candle close above entry with rising volume, leveraging the pair's momentum post-rebound.🌟
📝 Trade Setup
🎯 Entry (Long):
0.3780 – 0.3880
(Entries within this zone are valid with proper risk & capital management.)
🎯 Targets:
• 0.43 (first)
• 0.45 (second)
❌ Stop Loss:
• Daily close below 0.37
⚖️ Risk-to-Reward:
• Up to 1:3.5 overall
💡 Your view?
Does ADA hold this demand zone and push toward 0.45 — or is this rebound just a dead-cat bounce before another leg lower? 👇

What I think is going on with Cardano right nowThis is my personal opinion and update regarding Cardano. It is not a financial advice.

ADAUSDT —Breakout: 0.4355–0.4150 Will Decide the Next Trend?ADA is approaching a critical phase after successfully breaking above a major descending trendline that has guided the market lower for weeks. This breakout signals a potential shift in momentum, but the bullish move is not confirmed yet. Everything now depends on how price reacts to the 0.4355–0.4150 demand zone, the yellow block on the chart.
This zone is not just a simple consolidation range; it is the area where buyers previously stepped in aggressively and prevented deeper downside. If price retests this zone and holds, the breakout gains strong validity and opens the door for a broader trend reversal.
The breakout has happened. The market will now decide whether this is the beginning of a larger bullish leg, or merely a relief bounce within the existing downtrend.
---
Bullish Scenario
The bullish case remains intact as long as ADA holds above the 0.4355–0.4150 zone. A clean retest followed by a strong bullish 8h close would confirm buyers are in control.
If bullish confirmation holds:
First target: 0.5200, a key pivot resistance
Break above 0.52 leads to the next level at 0.5925
Sustained momentum could push ADA into the 0.6800–0.7300 zone
A full extension points toward the 0.8750 supply area, the larger upside magnet
As long as the yellow zone holds, the bias remains bullish.
---
Bearish Scenario
The bearish outlook only activates if price convincingly breaks back below 0.4150, invalidating the breakout and signaling that sellers still dominate the trend.
If a breakdown occurs:
Initial downside target sits around 0.375–0.360, the previous structural lows
Losing this level opens the possibility of forming a new lower low
In short, bearish momentum returns only if the key demand zone fails.
---
Pattern & Market Structure
Clean breakout from a major descending trendline
Price currently testing the transition phase between downtrend continuation or higher-low formation
The 0.4355–0.4150 zone acts as the trend validation zone, the most critical area on the chart
This is the most important structural zone ADA has interacted with in weeks.
#ADA #Cardano #ADAUSDT #CryptoAnalysis #Breakout #DemandZone #TechnicalAnalysis #MarketStructure

ADA : LIVE TRADE
Hello friends
According to the channel in which the price is located, you can see that every time it reached support, we had a growth, and now that it has reached the same support, we can expect another growth.
This analysis is purely technically reviewed and is not a buy or sell recommendation, so do not act emotionally and observe risk and capital management.
*Trade safely with us*

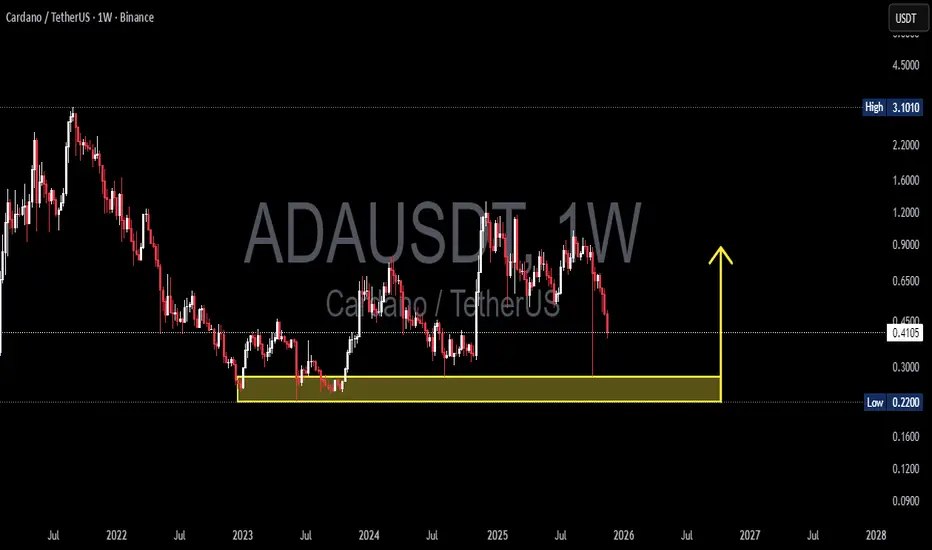
ADA/USDT — Major Reversal or Deep Breakdown?ADA/USDT on the weekly timeframe has returned to one of the most decisive zones since 2022.
The 0.275–0.22 region is not just another support — it is a historical demand and accumulation block where major reversals have repeatedly formed.
This week, ADA once again tapped this zone with a long downside wick, signaling a massive liquidity sweep. This is a clear indication that larger players are active here, collecting liquidity before choosing the next major direction.
This chart doesn’t reflect a simple pullback — it reflects the early stages of a major battle between long-term buyers and the dominant sellers who have controlled the trend since 2021.
---
🔥 Key Pattern & Market Dynamics
1. Long-term downtrend structure
Since the macro top, ADA has continued forming lower highs, maintaining bearish pressure in the weekly structure.
2. Strong accumulation demand (0.275–0.22)
This area has produced three major reversals in the past.
The latest reaction suggests either:
A liquidity hunt before a potential rebound, or
The beginning of a deeper breakdown if buyers fail to defend it.
3. Increased volatility
A wick of this size is rarely random.
It often precedes large directional moves, especially on the weekly chart.
---
📈 Bullish Scenario (If the Zone Holds)
A bullish continuation requires clear conditions:
✔ Strong rejection from 0.275–0.22
✔ Weekly close above the pivot zone at 0.40–0.45
✔ Formation of a higher-low structure
If confirmed, ADA may begin a structural trend reversal with:
Target 1: 0.65
Target 2: 1.00 – 1.20 (if volume expansion supports the breakout)
This would mark a shift from long-term weakness to medium-term recovery.
---
📉 Bearish Scenario (If the Zone Breaks)
A weekly close below 0.22 would be a significant bearish signal:
Historical demand fails
Market structure breaks down
A deeper markdown phase begins
Downside targets:
0.16 — next major psychological support
0.09 — historical accumulation zone
A loss of 0.22 would be one of ADA’s strongest bearish confirmations in years.
---
🧠 Core Message for Traders
This is not an ordinary support level —
this is a macro decision point that will define ADA’s direction for months ahead.
ADA now stands exactly where it stood in 2022–2023, and from this zone the market has only two paths:
➡ Hold the historical accumulation zone and reverse upward
or
➡ Break below it and enter a deeper long-term downtrend
Professional traders do not guess —
they wait for the weekly close, analyze volume, and watch how the market reacts to this key zone.
---
#ADA #ADAUSDT #Cardano #CryptoAnalysis #PriceAction #MarketStructure #WeeklyChart #SupportZone #CryptoTrading #CryptoOutlook
#ADAUSDT: Two Targets Both Possible, Let's See How Price MoveADAUSDT collapsed following the announcement of new tariffs on China, which caused fear in the cryptocurrency market and affected minor currency pairs. This led to a significant drop in the price of ADAUSDT. A minor decline may occur before the price reverses. There are two potential targets for the price to reach.
Entry area:
- We have identified the key area where a price reversal is likely to occur.
We wish you the best of luck and trade safely.
Team Setupsfx
ADAUSDTBINANCE:ADAUSDT is wait for breakout trendline for start bullish trend so we wait for this breakout and ADA give best signal for buy.

ADAUSDTNothing special, after October 10, we found a "bottom" in this cycle, where it will probably move in a chaotic direction, shedding shorts and longs on its way. The yellow dotted line indicates the area where a "turn" is possible (it is possible to make some decisions, political or drastic regulatory changes or in that spirit)
Red showed resistance zones in case of a possible reversal. And a break of the negative trend on TF 1D.There is also weak support, which may act as a "hope" zone with a possible slight increase and a rapid decline in price to the lows that we have already tested on October 10, and clearly rested in the support zone.
But I wouldn't be surprised if we're in the near future, it will bounce back significantly below October 10th.

ADAUSDTIn this week’s BINANCE:ADAUSDT analysis, after a bearish reaction from the 0.85 USD zone, the price remains consolidating below previous highs, showing weakness in bullish momentum on the daily timeframe. If the current support fails, a move toward lower zones is likely before a potential bullish correction begins from support levels.
Supports:
* 0.59 USD
* 0.51 USD
Resistances:
* 0.69 USD
* 0.85 USD

#ADA/USDT Spot LONG#ADA
The price is moving within a descending channel on the 1-hour frame, adhering well to it, and is heading for a strong breakout and retest.
We have a bearish trend on the RSI indicator that is about to be broken and retested, which supports the upward breakout.
There is a major support area in green at 0.6335, which represents a strong support point.
We are heading for consolidation above the 100 moving average.
Entry price: 0.6721
First target: 0.6868
Second target: 0.7001
Third target: 0.7184
Don't forget a simple matter: capital management.
When you reach the first target, save some money and then change your stop-loss order to an entry order.
For inquiries, please leave a comment.
Thank you.

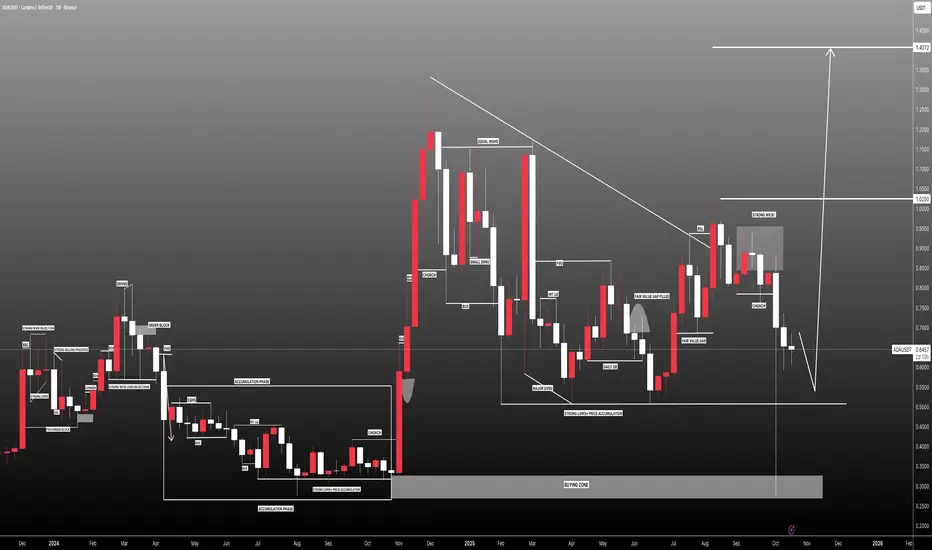
ADA/USDT — at a Make-or-Break Zone: Will Bulls Defend?Cardano (ADA) is now sitting at a critical decision point, testing the major demand zone between 0.55–0.625 USDT — a key level that has acted as the foundation for multiple rallies since early 2024. This zone represents the battlefield between long-term buyers and sellers, where price reactions have historically triggered large directional moves.
Recently, ADA experienced a deep liquidity sweep, leaving a long wick below the zone — a common sign of stop-loss hunting or institutional accumulation. Such moves often occur before a trend reversal, making this area one of the most strategic zones to watch in the coming weeks.
---
Pattern and Market Structure Analysis
The yellow block (0.55–0.625) is a macro demand/support zone, repeatedly tested and defended by buyers.
Main resistances are located at 0.9239, 1.2075, and 1.3264, forming the upper bounds of ADA’s broader trading range.
The overall structure shows a wide consolidation phase, potentially signaling re-accumulation if the current zone holds.
The long wick beneath support reflects a liquidity grab, often used by smart money to fill large buy orders before an upward move.
---
Bullish Scenario — Potential Start of a Major Rebound
1. Price holds and rebounds from 0.55–0.625 with a strong bullish reversal candle (bullish engulfing, hammer, or pin bar).
2. Increasing buying volume confirms accumulation interest at this level.
3. A clean breakout and daily close above 0.9239 would confirm bullish continuation toward 1.20 and 1.32.
4. Formation of a higher low above 0.625 will further validate a new uptrend structure.
🎯 Bullish Targets:
TP1: 0.92
TP2: 1.20
TP3: 1.32
📉 Suggested Stop Loss: Below 0.53 (outside the demand zone).
Narrative:
If this pattern confirms, ADA could begin a new major recovery wave, potentially marking the start of a strong uptrend cycle heading into 2026.
---
Bearish Scenario — Breakdown and Failed Retest
1. Price fails to hold above 0.55 and closes decisively below the yellow zone.
2. High selling volume confirms continuation pressure.
3. A failed retest of 0.55–0.625 as new resistance strengthens bearish momentum.
4. The next key downside targets are 0.40 and 0.27, both major liquidity levels.
🎯 Bearish Targets:
TP1: 0.40
TP2: 0.27
📈 Confirmation: Daily candle close below 0.55 with strong volume.
Narrative:
If this support collapses, ADA could enter a mid-term redistribution phase, potentially setting a new bottom before the next macro bull run.
---
Conclusion and Strategic Outlook
The 0.55–0.625 zone is ADA’s make-or-break region — a critical level that will likely define its direction for the months ahead.
Holding the zone could trigger a strong reversal rally toward 0.92–1.32.
Losing it would confirm a bearish continuation toward 0.27.
Traders should wait for confirmation through daily candle closes and volume surges before committing to major positions.
This zone offers both a high-risk accumulation opportunity for patient investors and a decisive pivot area for short-term traders.
---
#ADA #Cardano #ADAUSDT #CryptoAnalysis #TechnicalAnalysis #PriceAction #SupportZone #ReversalZone #Altcoin #CryptoMarket #DemandZone

#ADAUSDT: Is the crypto hype finally over? ADAUSDT is likely to drop first then it can reverse and continue the bullish move upwards of previous all time high. Before we can confirm any entry on this pair we need strong confirmation which will allow us to predict a correct and accurate swing move.
If you like the work then do consider liking and commenting on the idea.
Team Setupsfx_❤️

BUY AND HOLDHello friends
You see that after the good rise we had, the price is correcting, which is a natural thing and there is no need to worry, and in these corrections, you can buy in steps with capital and risk management and move with it to the specified goals.
Note that the holding period is at least 3 months, so be patient and observe capital management.
*Trade safely with us*
