#ADA/USDT Spot LONG#ADA
The price is moving within a descending channel on the hourly timeframe. It has reached the lower boundary and is heading towards a breakout, with a retest of the upper boundary expected.
The Relative Strength Index (RSI) is showing a downward trend, approaching the lower boundary, and an upward bounce is anticipated.
There is a key support zone in green at 0.3350, and the price has bounced from this level several times and is expected to bounce again.
The indicator is showing a trend towards consolidation above the 100-period moving average, which we are approaching, supporting the upward move.
Entry Price: 0.3606
Target 1: 0.3676
Target 2: 0.3765
Target 3: 0.3873
Stop Loss: Below the green support zone.
Remember this simple thing: Money management.
For any questions, please leave a comment.
Thank you.
Adausdtrade

#ADA/USD Buy Trade Scenario.Here’s an up-to-date ADA/USD Buy trade outlook (technical + fundamental) to help you assess whether positioning for a Upside makes sense right now.
Thank You......

#ADA/USDT Spot LONG#ADA
The price is moving within a descending channel on the hourly timeframe. It has reached the lower boundary and is heading towards a breakout, with a retest of the upper boundary expected.
The Relative Strength Index (RSI) is showing a downward trend, approaching the lower boundary, and an upward bounce is anticipated.
There is a key support zone in green at 0.3950, and the price has bounced from this level several times. Another bounce is expected.
The RSI is showing a trend towards consolidation above the 100-period moving average, which we are approaching, supporting the upward move.
Entry Price: 0.4050
First Target: 0.4096
Second Target: 0.4194
Third Target: 0.4296
Stop Loss: Below the green support zone.
Remember this simple thing: Money management.
For any questions, please leave a comment.
Thank you.

#ADA//USDT Spot LONG #ADA
The price is moving in a descending channel on the 1-hour timeframe. It has reached the lower boundary and is heading towards breaking above it, with a retest of the upper boundary expected.
We have a downtrend on the RSI indicator, which has reached near the lower boundary, and an upward rebound is expected.
There is a key support zone in green at 0.3558. The price has bounced from this zone multiple times and is expected to bounce again.
We have a trend towards stability above the 100-period moving average, as we are moving close to it, which supports the upward movement.
Entry price: 0.3690
First target: 0.3741
Second target: 0.3842
Third target: 0.3976
Don't forget a simple principle: money management.
Place your stop-loss order below the green support zone.
For any questions, please leave a comment.
Thank you.

ADAUSDT Near Major Breakout Level — Trend Reversal or Bull Trap?On the 12-hour timeframe, ADAUSDT remains within a clear medium-term downtrend structure. Over the past few months, price has consistently formed lower highs and lower lows, capped by a dominant descending trendline.
However, recent price action shows an early bullish reaction from the lower support area, suggesting a potential transition phase or a short-term relief rally.
---
Pattern & Technical Structure
Primary Pattern:
Descending Trendline / Bearish Channel Breakdown Test
Price has been trading below the descending trendline (dynamic resistance) for an extended period.
The latest candles indicate a retest of the trendline, which now acts as a critical decision zone.
The marked horizontal levels (yellow dashed lines) represent key historical support and resistance zones.
Pattern Summary:
As long as price remains below the trendline, the broader structure stays bearish. A valid break and close above the trendline would be the first signal of a potential trend reversal or short-term bullish continuation.
---
Key Levels
Major Resistance:
0.413
0.468
0.520
High Resistance / Reversal Zone:
0.616 – 0.682
Key Support:
0.370
0.345
0.321 (structural low)
---
Bullish Scenario
Price successfully breaks and closes above the descending trendline (12H close).
Trendline flips into support after a successful retest.
Upside targets:
TP1: 0.413
TP2: 0.468
TP3: 0.520
If bullish momentum and volume expand, further upside toward 0.616 – 0.682 becomes possible.
Bullish Confirmation:
Higher low formation
Minor market structure shift
Strong candle close, not just a wick
---
Bearish Scenario
Price fails to break the trendline and forms a clear rejection (long upper wick / bearish engulfing).
Price revisits lower support zones:
First support: 0.370
Next support: 0.345
Worst-case scenario: 0.321 (new lower low)
A breakdown below 0.321 would confirm continuation of the major downtrend.
Bearish Confirmation:
Clear rejection at the trendline
Lower high formation
Increasing selling volume
---
Conclusion
ADAUSDT is currently at a critical decision zone.
The macro trend remains bearish, but the recent bullish reaction from lower support opens room for a short-term reversal or relief rally.
Traders are advised to wait for confirmation — either a breakout or rejection — at the trendline, as this area will define the next major move.
---
#ADA #ADAUSDT #Cardano #CryptoAnalysis #TechnicalAnalysis #Downtrend #Trendline #SupportResistance #Altcoins

ADAUSDT – Daily Chart. ADAUSDT – Daily Chart.
Macro downtrend intact (descending channel)
The price is sitting at a major HTF demand level after a prolonged sell-off.
Selling momentum is exhausting near channel support
Price is compressing → base formation possible
This zone often leads to sideways accumulation before expansion
Support: 0.35 – 0.32 (critical demand zone)
Invalidation: Below 0.30
First Resistance: 0.48 – 0.52
Major Supply: 0.70 – 0.82 (previous value area)
In Extreme Fear, strong coins usually move sideways at support to absorb sell pressure before trend reversal.
No blind longs. Wait for structure shift + volume confirmation.
DYOR | NFA

Strong Bearish Sentiment on ADA heading to $0.255CARDANO (ADA/USD) | Daily Chart | Technical Analysis
Current Price: $0.337 | Date: January 1, 2026
📊 PRICE ACTION OVERVIEW
📉 Clear downtrend dominance - ADA has been in a sustained bearish trajectory since late 2025
💥 Price declined from highs around $1.00 - 1.02 (August 2025) down to current levels near $0.337
🔴 Trading near multi-month lows with continued selling pressure visible in recent candles
⚠️ Price action shows lower highs and lower lows - classic bearish structure intact
🎯 KEY TECHNICAL LEVELS
Resistance Zones:
$0.385 - Major overhead resistance level marked on chart; this represents a significant barrier that needs to break for any meaningful recovery attempt
Support Zones:
Current support ~$0.337 - Price hovering at current levels with limited buying interest
$0.21 - $0.25 - Strong support level/Target Point indicated by arrow; represents potential downside target if current support fails (~23% decline from current price)
Price Targets:
📍 Downside target: $0.255 as highlighted on the chart
🎯 Recovery resistance: $0.385 must be reclaimed to invalidate bearish bias
🌐 MARKET CONTEXT
🔻 ADA has dropped nearly 60% in 2025, underperforming major cryptocurrencies like Bitcoin and Ethereum
😨 Crypto Fear & Greed Index sits at 28 (Extreme Fear), reflecting cautious investor sentiment across the broader market
🏦 The CLARITY Act's Senate markup scheduled for January 2026 may cement ADA's status as a commodity, potentially unlocking institutional demand long-term
⚡ Cardano's Midnight protocol is developing a bridge to Solana to access $95B DeFi liquidity, with mainnet launch anticipated
📊 Analysts remain divided: some predict recovery to $0.48-0.55 range by late January/February 2026, while current technicals suggest downside risk remains
💡 TECHNICAL OUTLOOK
🎯 Short-term bias: Bearish - Direction Index confirms sellers are in control with no signs of reversal yet
⚠️ Critical level to watch: $0.21 support - a breakdown here opens the door to a massive sell off
🚧 Resistance challenge: Bulls need to reclaim $0.385 to shift momentum and invalidate the downtrend structure
📉 Risk scenario: expect accelerated selling toward the $0.255 zone
🔄 Recovery scenario: A hold above $0.255 and declining Bearish sentiment could signal early reversal signs, but confirmation is needed
------------------------------------------------------------------------------------------------------------------
⚠️ DISCLAIMER
This is technical analysis for educational purposes only. Not financial advice. Always do your own research and manage risk appropriately.

Cardano: Final Retest of Demand Before Parabolic Leg?This weekly BINANCE:ADAUSDT idea maps out a possible end‑of‑cycle accumulation inside the large red demand box that has held price since 2023. I work with this fib levels since top in 2021.
Price is retesting this zone while still trading under the long‑term descending trendline, (line chart) creating conditions for a potential macro breakout once that line is reclaimed and flipped to support. The dashed path outlines an impulsive leg toward the mid‑range around 1.30–1.95, (to 0.5 of fib Weekly) followed by higher Fibonacci extensions up to the 1.618 at roughly 4.55, with invalidation below the lower boundary of the demand box

ADA - Bearish Expanding TrianglePrice is trading within a broadening (expanding) triangle , with higher highs and lower lows indicating increasing volatility and distribution. The structure favors a bearish resolution , and I’m expecting a breakdown below the lower trendline to confirm continuation to the downside.
Expectations:
Breakdown from the expanding triangle → acceleration lower.
Downside Targets:
🎯 $0.25
🎯 $0.15
As long as price stays below the upper boundary, the bearish scenario remains dominant.
ADAUSDT —Breakout: 0.4355–0.4150 Will Decide the Next Trend?ADA is approaching a critical phase after successfully breaking above a major descending trendline that has guided the market lower for weeks. This breakout signals a potential shift in momentum, but the bullish move is not confirmed yet. Everything now depends on how price reacts to the 0.4355–0.4150 demand zone, the yellow block on the chart.
This zone is not just a simple consolidation range; it is the area where buyers previously stepped in aggressively and prevented deeper downside. If price retests this zone and holds, the breakout gains strong validity and opens the door for a broader trend reversal.
The breakout has happened. The market will now decide whether this is the beginning of a larger bullish leg, or merely a relief bounce within the existing downtrend.
---
Bullish Scenario
The bullish case remains intact as long as ADA holds above the 0.4355–0.4150 zone. A clean retest followed by a strong bullish 8h close would confirm buyers are in control.
If bullish confirmation holds:
First target: 0.5200, a key pivot resistance
Break above 0.52 leads to the next level at 0.5925
Sustained momentum could push ADA into the 0.6800–0.7300 zone
A full extension points toward the 0.8750 supply area, the larger upside magnet
As long as the yellow zone holds, the bias remains bullish.
---
Bearish Scenario
The bearish outlook only activates if price convincingly breaks back below 0.4150, invalidating the breakout and signaling that sellers still dominate the trend.
If a breakdown occurs:
Initial downside target sits around 0.375–0.360, the previous structural lows
Losing this level opens the possibility of forming a new lower low
In short, bearish momentum returns only if the key demand zone fails.
---
Pattern & Market Structure
Clean breakout from a major descending trendline
Price currently testing the transition phase between downtrend continuation or higher-low formation
The 0.4355–0.4150 zone acts as the trend validation zone, the most critical area on the chart
This is the most important structural zone ADA has interacted with in weeks.
#ADA #Cardano #ADAUSDT #CryptoAnalysis #Breakout #DemandZone #TechnicalAnalysis #MarketStructure

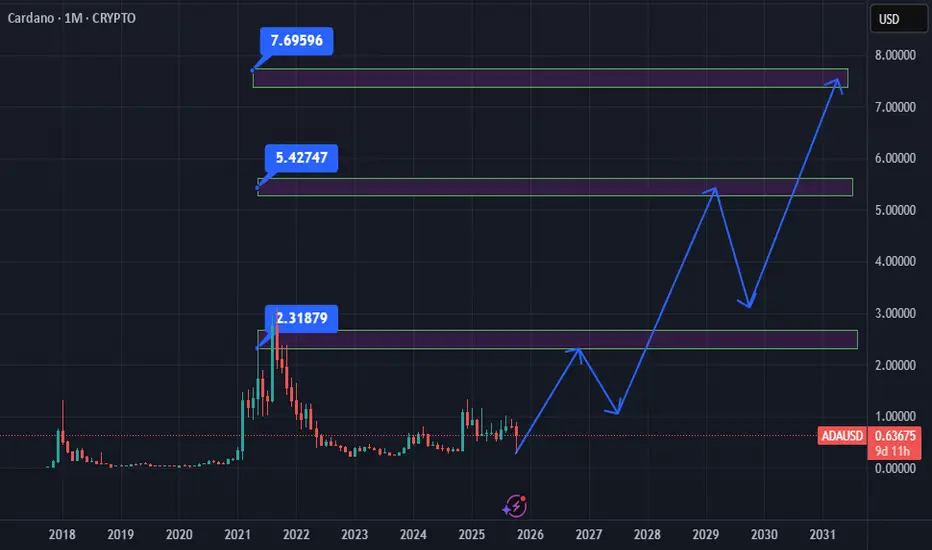
Cardano ADA price analysisIs a return to $2.70 realistic for CRYPTOCAP:ADA ?
The structure of OKX:ADAUSDT resembles OKX:ETCUSDT long-term behavior:
• A strong rally in 2020–2021
• A well-defined multi-year support zone that has repeatedly held
However, CRYPTOCAP:ADA ’s current market capitalization (~$16.5B) changes the equation.
A move back to $2.70 implies a valuation close to $100B, placing CRYPTOCAP:ADA in the same range as CRYPTOCAP:XRP , not CRYPTOCAP:ETC
#Cardano’s staking-based model aligns it more with CRYPTOCAP:ETH economic design than with PoW assets like CRYPTOCAP:BTC , CRYPTOCAP:LTC , CRYPTOCAP:ZEC etc. If network usage expands, price appreciation remains possible.
Key levels to watch:
• $0.60 — requires a confirmed breakout and hold
• Long-term outlook depends heavily on market recovery and ecosystem activity
Where do you position CRYPTOCAP:ADA ’s fair value in the next 6–12 months?
______________
◆ Follow us ❤️ for daily crypto insights & updates!
🚀 Don’t miss out on important market moves
🧠 DYOR | This is not financial advice, just thinking out loud

ADA : LIVE TRADE
Hello friends
According to the channel in which the price is located, you can see that every time it reached support, we had a growth, and now that it has reached the same support, we can expect another growth.
This analysis is purely technically reviewed and is not a buy or sell recommendation, so do not act emotionally and observe risk and capital management.
*Trade safely with us*

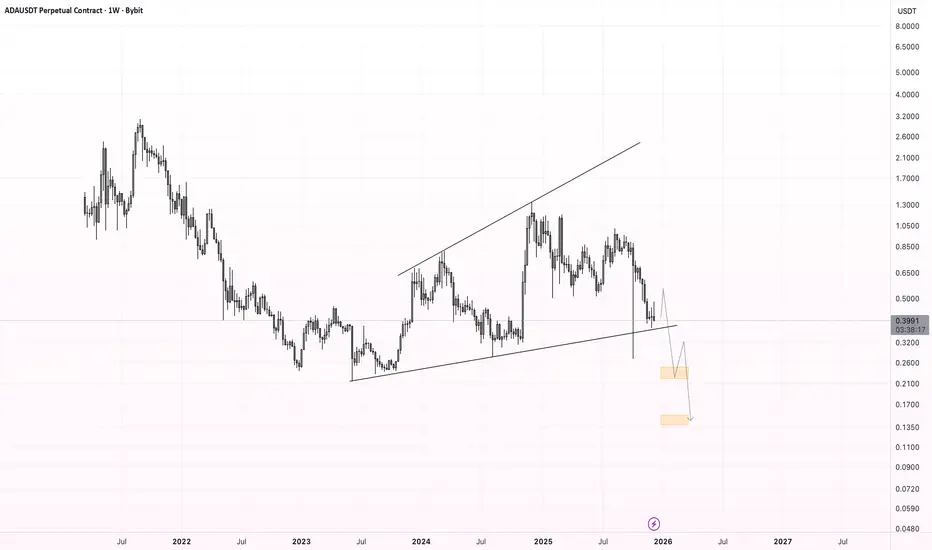
ADA/USDT — Major Reversal or Deep Breakdown?ADA/USDT on the weekly timeframe has returned to one of the most decisive zones since 2022.
The 0.275–0.22 region is not just another support — it is a historical demand and accumulation block where major reversals have repeatedly formed.
This week, ADA once again tapped this zone with a long downside wick, signaling a massive liquidity sweep. This is a clear indication that larger players are active here, collecting liquidity before choosing the next major direction.
This chart doesn’t reflect a simple pullback — it reflects the early stages of a major battle between long-term buyers and the dominant sellers who have controlled the trend since 2021.
---
🔥 Key Pattern & Market Dynamics
1. Long-term downtrend structure
Since the macro top, ADA has continued forming lower highs, maintaining bearish pressure in the weekly structure.
2. Strong accumulation demand (0.275–0.22)
This area has produced three major reversals in the past.
The latest reaction suggests either:
A liquidity hunt before a potential rebound, or
The beginning of a deeper breakdown if buyers fail to defend it.
3. Increased volatility
A wick of this size is rarely random.
It often precedes large directional moves, especially on the weekly chart.
---
📈 Bullish Scenario (If the Zone Holds)
A bullish continuation requires clear conditions:
✔ Strong rejection from 0.275–0.22
✔ Weekly close above the pivot zone at 0.40–0.45
✔ Formation of a higher-low structure
If confirmed, ADA may begin a structural trend reversal with:
Target 1: 0.65
Target 2: 1.00 – 1.20 (if volume expansion supports the breakout)
This would mark a shift from long-term weakness to medium-term recovery.
---
📉 Bearish Scenario (If the Zone Breaks)
A weekly close below 0.22 would be a significant bearish signal:
Historical demand fails
Market structure breaks down
A deeper markdown phase begins
Downside targets:
0.16 — next major psychological support
0.09 — historical accumulation zone
A loss of 0.22 would be one of ADA’s strongest bearish confirmations in years.
---
🧠 Core Message for Traders
This is not an ordinary support level —
this is a macro decision point that will define ADA’s direction for months ahead.
ADA now stands exactly where it stood in 2022–2023, and from this zone the market has only two paths:
➡ Hold the historical accumulation zone and reverse upward
or
➡ Break below it and enter a deeper long-term downtrend
Professional traders do not guess —
they wait for the weekly close, analyze volume, and watch how the market reacts to this key zone.
---
#ADA #ADAUSDT #Cardano #CryptoAnalysis #PriceAction #MarketStructure #WeeklyChart #SupportZone #CryptoTrading #CryptoOutlook
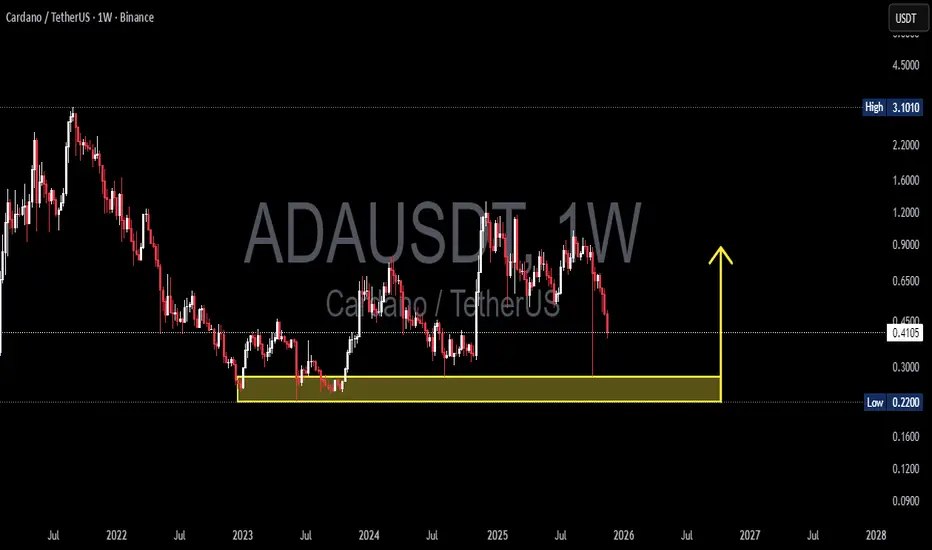
Cardano - This coin is holding strong!🔋Cardano ( CRYPTO:ADAUSD ) still remains bullish:
🔎Analysis summary:
Despite this month's massive crypto crackdown, Cardano already recovered about +100%. We simply saw a perfect rejection of a major confluence of support, pushing price higher. Soon, Cardano will break out of the triangle and a bullish breakout remains rather likely.
📝Levels to watch:
$0.8
SwingTraderPhil
SwingTrading.Simplified. | Investing.Simplified. | #LONGTERMVISION

#ADAUSDT: Two Targets Both Possible, Let's See How Price MoveADAUSDT collapsed following the announcement of new tariffs on China, which caused fear in the cryptocurrency market and affected minor currency pairs. This led to a significant drop in the price of ADAUSDT. A minor decline may occur before the price reverses. There are two potential targets for the price to reach.
Entry area:
- We have identified the key area where a price reversal is likely to occur.
We wish you the best of luck and trade safely.
Team Setupsfx
ADAUSDTBINANCE:ADAUSDT is wait for breakout trendline for start bullish trend so we wait for this breakout and ADA give best signal for buy.

ADAUSDTIn this week’s BINANCE:ADAUSDT analysis, after a bearish reaction from the 0.85 USD zone, the price remains consolidating below previous highs, showing weakness in bullish momentum on the daily timeframe. If the current support fails, a move toward lower zones is likely before a potential bullish correction begins from support levels.
Supports:
* 0.59 USD
* 0.51 USD
Resistances:
* 0.69 USD
* 0.85 USD

Cardano/ADA Primed for Explosion: Key Targets Up to $5The chart should display sufficient key points and important levels while maintaining simplicity and order, avoiding clutter – this is what true analysis means. These levels in the monthly timeframe provide ideal zones for long-term investors to enter and exit, and offer traders a broader movement perspective since we're in a higher timeframe BINANCE:ADAUSD
#ADA/USDT Spot LONG#ADA
The price is moving within a descending channel on the 1-hour frame, adhering well to it, and is heading for a strong breakout and retest.
We have a bearish trend on the RSI indicator that is about to be broken and retested, which supports the upward breakout.
There is a major support area in green at 0.6335, which represents a strong support point.
We are heading for consolidation above the 100 moving average.
Entry price: 0.6721
First target: 0.6868
Second target: 0.7001
Third target: 0.7184
Don't forget a simple matter: capital management.
When you reach the first target, save some money and then change your stop-loss order to an entry order.
For inquiries, please leave a comment.
Thank you.

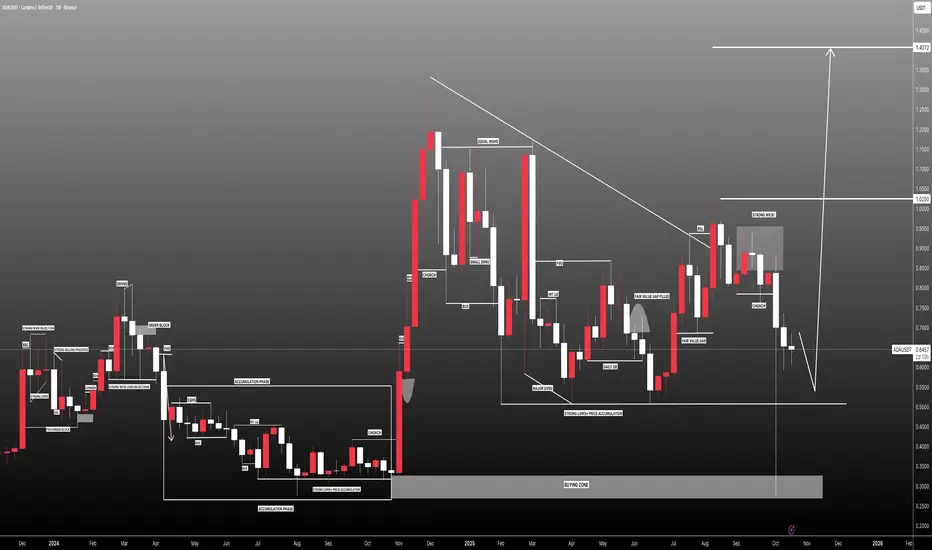
ADA/USDT — at a Make-or-Break Zone: Will Bulls Defend?Cardano (ADA) is now sitting at a critical decision point, testing the major demand zone between 0.55–0.625 USDT — a key level that has acted as the foundation for multiple rallies since early 2024. This zone represents the battlefield between long-term buyers and sellers, where price reactions have historically triggered large directional moves.
Recently, ADA experienced a deep liquidity sweep, leaving a long wick below the zone — a common sign of stop-loss hunting or institutional accumulation. Such moves often occur before a trend reversal, making this area one of the most strategic zones to watch in the coming weeks.
---
Pattern and Market Structure Analysis
The yellow block (0.55–0.625) is a macro demand/support zone, repeatedly tested and defended by buyers.
Main resistances are located at 0.9239, 1.2075, and 1.3264, forming the upper bounds of ADA’s broader trading range.
The overall structure shows a wide consolidation phase, potentially signaling re-accumulation if the current zone holds.
The long wick beneath support reflects a liquidity grab, often used by smart money to fill large buy orders before an upward move.
---
Bullish Scenario — Potential Start of a Major Rebound
1. Price holds and rebounds from 0.55–0.625 with a strong bullish reversal candle (bullish engulfing, hammer, or pin bar).
2. Increasing buying volume confirms accumulation interest at this level.
3. A clean breakout and daily close above 0.9239 would confirm bullish continuation toward 1.20 and 1.32.
4. Formation of a higher low above 0.625 will further validate a new uptrend structure.
🎯 Bullish Targets:
TP1: 0.92
TP2: 1.20
TP3: 1.32
📉 Suggested Stop Loss: Below 0.53 (outside the demand zone).
Narrative:
If this pattern confirms, ADA could begin a new major recovery wave, potentially marking the start of a strong uptrend cycle heading into 2026.
---
Bearish Scenario — Breakdown and Failed Retest
1. Price fails to hold above 0.55 and closes decisively below the yellow zone.
2. High selling volume confirms continuation pressure.
3. A failed retest of 0.55–0.625 as new resistance strengthens bearish momentum.
4. The next key downside targets are 0.40 and 0.27, both major liquidity levels.
🎯 Bearish Targets:
TP1: 0.40
TP2: 0.27
📈 Confirmation: Daily candle close below 0.55 with strong volume.
Narrative:
If this support collapses, ADA could enter a mid-term redistribution phase, potentially setting a new bottom before the next macro bull run.
---
Conclusion and Strategic Outlook
The 0.55–0.625 zone is ADA’s make-or-break region — a critical level that will likely define its direction for the months ahead.
Holding the zone could trigger a strong reversal rally toward 0.92–1.32.
Losing it would confirm a bearish continuation toward 0.27.
Traders should wait for confirmation through daily candle closes and volume surges before committing to major positions.
This zone offers both a high-risk accumulation opportunity for patient investors and a decisive pivot area for short-term traders.
---
#ADA #Cardano #ADAUSDT #CryptoAnalysis #TechnicalAnalysis #PriceAction #SupportZone #ReversalZone #Altcoin #CryptoMarket #DemandZone


#ADAUSDT: Is the crypto hype finally over? ADAUSDT is likely to drop first then it can reverse and continue the bullish move upwards of previous all time high. Before we can confirm any entry on this pair we need strong confirmation which will allow us to predict a correct and accurate swing move.
If you like the work then do consider liking and commenting on the idea.
Team Setupsfx_❤️

BUY AND HOLDHello friends
You see that after the good rise we had, the price is correcting, which is a natural thing and there is no need to worry, and in these corrections, you can buy in steps with capital and risk management and move with it to the specified goals.
Note that the holding period is at least 3 months, so be patient and observe capital management.
*Trade safely with us*
