#ADA/USD Sell Trade Scenario.Here’s an up-to-date ADA/USD Sell trade outlook (technical + fundamental) to help you assess whether positioning for a Downside makes sense right now.
Thank You......
Adausdtshort

#ADA/USDT Spot LONG#ADA
The price is moving within a descending channel on the hourly timeframe. It has reached the lower boundary and is heading towards a breakout, with a retest of the upper boundary expected.
The Relative Strength Index (RSI) is showing a downward trend, approaching the lower boundary, and an upward bounce is anticipated.
There is a key support zone in green at 0.2750, and the price has bounced from this level several times. Another bounce is expected.
The RSI is showing a trend towards consolidation above the 100-period moving average, which we are approaching, supporting the upward move.
Entry Price: 0.2900
First Target: 0.2936
Second Target: 0.3032
Third Target: 0.3160
Stop Loss: Below the green support zone.
Remember this simple thing: Money management.
For any questions, please leave a comment.
Thank you.

ADAUSDT - 1H - WHAT TO EXPECT TODAY ? 03-02-2026ADAUSDT - still kinda on the "move" and after some "INSTITUTIONAL" manipulations will continue DOWN...
Sadly any Set- Ups for trades "mutated " and multiply to 5m failed set ups, developed institutional "accumulation" and SL sweep range .
I'm not going to repost a pretty much similar charts for the most crypto pairs. After some analysing by your self you will find a plenty of Institutional manipulations today...
Stay "SAFE" today, don't rush with entering trades, seems going to be Loss Stop "hunting" day...
Educational "piece":
An Institutional Stop Loss (SL) Sweep (also known as a liquidity sweep or stop hunt)
is a trading concept within Smart Money Concepts (SMC)
where large financial institutions deliberately drive prices beyond well-defined support or resistance levels to trigger the clustered stop-loss orders of retail traders
Chart is itself explaining. Kept a "KISS" approach all the way ( "Keep It Simple, Stupid") & beginners friendly... ;)
I do hope that nobody ignoring SL ( Stop Loss) ! Without it, It is a fastest way to loose hard earned money...
;)
Trade safe & don't do "gambling". In the end it never pays, not worth it to risk loose all your $...
PS: above technical analysis is done for the community & educational purpose only! It is not a financial advice. Just share my very own insight to it.

ADAUSDT - ACCUMULATION/INSTITUTIONAL/RETAIL SL 03-02-2026ADAUSDT - G-Money's short version analysis based purely on technical analysis only, no nonsense or "BS". I do totally ignore any fundamental analysis, technical analysis only
ADAUSDT - still kinda on the "move" and continue DOWN...All the way down to 0.2000-0.1880 ....
ACCUMULATION PHASE, Institutional traders gonna to "clear up" a plenty retail stop loses again....
Thought of the day: sometimes you can "win" much more money by not trading...
Wisdom of G-Money2022 :)
Chart is itself explaining. Kept a "KISS" approach all the way ( "Keep It Simple, Stupid") & beginners friendly... ;)
I do hope that nobody ignoring SL ( Stop Loss) ! Without it, It is a fastest way to loose hard earned money...
;)
Trade safe & don't do "gambling". In the end it never pays, not worth it to risk loose all your $...
PS: above technical analysis is done for the community & educational purpose only! It is not a financial advice. Just share my very own insight to it.

ADAUSDT - A QUICK SELL SET UP - 30-01-2026ADUSDT - G-Money's short version analysis based purely on technical analysis only, no nonsense or "BS". I do totally ignore any fundamental analysis, technical analysis only
ADAUSDT - still kinda on the "move" and continue DOWN... Done run for 1H already...4H IS NOT FINISHED YET...Search for entry on the LTF. SL "must be", don't get ruined down by big money...
Who did enter this trade earlier congratulations! Who missed it... See you next time! ;)
Chart is itself explaining. Kept a "KISS" approach all the way ( "Keep It Simple, Stupid") & beginners friendly... ;)
I do hope that nobody ignoring SL ( Stop Loss) ! Without it, It is a fastest way to loose hard earned money...
;)
Trade safe & don't do "gambling". In the end it never pays, not worth it to risk loose all your $...
PS: above technical analysis is done for the community & educational purpose only! It is not a financial advice. Just share my very own insight to it.

ADAUSDT - A QUICK SELL SET UP - 29-01-2026ADAUSDT - G-Money's short version analysis based purely on technical analysis only, no nonsense or "BS". I do totally ignore any fundamental analysis, technical analysis only
ADAUSDT - still kinda on the "move" and continue DOWN...
Who did enter this trade earlier congratulations! Who missed it... See you next time! ;)
Chart is itself explaining. Kept a "KISS" approach all the way ( "Keep It Simple, Stupid") & beginners friendly... ;)
I do hope that nobody ignoring SL ( Stop Loss) ! Without it, It is a fastest way to loose hard earned money...
;)
Trade safe & don't do "gambling". In the end it never pays, not worth it to risk loose all your $...
PS: above technical analysis is done for the community & educational purpose only! It is not a financial advice. Just share my very own insight to it.

#ADA/USDT Spot LONG#ADA
The price is moving within a descending channel on the hourly timeframe. It has reached the lower boundary and is heading towards a breakout, with a retest of the upper boundary expected.
The Relative Strength Index (RSI) is showing a downward trend, approaching the lower boundary, and an upward bounce is anticipated.
There is a key support zone in green at 0.3350, and the price has bounced from this level several times and is expected to bounce again.
The indicator is showing a trend towards consolidation above the 100-period moving average, which we are approaching, supporting the upward move.
Entry Price: 0.3606
Target 1: 0.3676
Target 2: 0.3765
Target 3: 0.3873
Stop Loss: Below the green support zone.
Remember this simple thing: Money management.
For any questions, please leave a comment.
Thank you.

#ADA/USDT Spot LONG#ADA
The price is moving within a descending channel on the hourly timeframe. It has reached the lower boundary and is heading towards a breakout, with a retest of the upper boundary expected.
The Relative Strength Index (RSI) is showing a downward trend, approaching the lower boundary, and an upward bounce is anticipated.
There is a key support zone in green at 0.3950, and the price has bounced from this level several times. Another bounce is expected.
The RSI is showing a trend towards consolidation above the 100-period moving average, which we are approaching, supporting the upward move.
Entry Price: 0.4050
First Target: 0.4096
Second Target: 0.4194
Third Target: 0.4296
Stop Loss: Below the green support zone.
Remember this simple thing: Money management.
For any questions, please leave a comment.
Thank you.

#ADA//USDT Spot LONG #ADA
The price is moving in a descending channel on the 1-hour timeframe. It has reached the lower boundary and is heading towards breaking above it, with a retest of the upper boundary expected.
We have a downtrend on the RSI indicator, which has reached near the lower boundary, and an upward rebound is expected.
There is a key support zone in green at 0.3558. The price has bounced from this zone multiple times and is expected to bounce again.
We have a trend towards stability above the 100-period moving average, as we are moving close to it, which supports the upward movement.
Entry price: 0.3690
First target: 0.3741
Second target: 0.3842
Third target: 0.3976
Don't forget a simple principle: money management.
Place your stop-loss order below the green support zone.
For any questions, please leave a comment.
Thank you.

ADA - Bearish Expanding TrianglePrice is trading within a broadening (expanding) triangle , with higher highs and lower lows indicating increasing volatility and distribution. The structure favors a bearish resolution , and I’m expecting a breakdown below the lower trendline to confirm continuation to the downside.
Expectations:
Breakdown from the expanding triangle → acceleration lower.
Downside Targets:
🎯 $0.25
🎯 $0.15
As long as price stays below the upper boundary, the bearish scenario remains dominant.
ADAUSDTNothing special, after October 10, we found a "bottom" in this cycle, where it will probably move in a chaotic direction, shedding shorts and longs on its way. The yellow dotted line indicates the area where a "turn" is possible (it is possible to make some decisions, political or drastic regulatory changes or in that spirit)
Red showed resistance zones in case of a possible reversal. And a break of the negative trend on TF 1D.There is also weak support, which may act as a "hope" zone with a possible slight increase and a rapid decline in price to the lows that we have already tested on October 10, and clearly rested in the support zone.
But I wouldn't be surprised if we're in the near future, it will bounce back significantly below October 10th.

#ADA/USDT Spot LONG#ADA
The price is moving within a descending channel on the 1-hour frame, adhering well to it, and is heading for a strong breakout and retest.
We have a bearish trend on the RSI indicator that is about to be broken and retested, which supports the upward breakout.
There is a major support area in green at 0.6335, which represents a strong support point.
We are heading for consolidation above the 100 moving average.
Entry price: 0.6721
First target: 0.6868
Second target: 0.7001
Third target: 0.7184
Don't forget a simple matter: capital management.
When you reach the first target, save some money and then change your stop-loss order to an entry order.
For inquiries, please leave a comment.
Thank you.

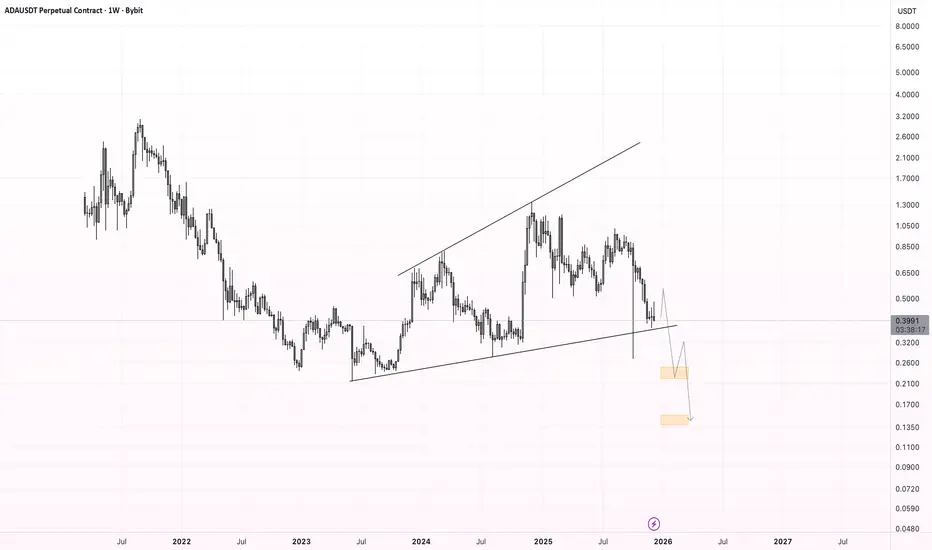
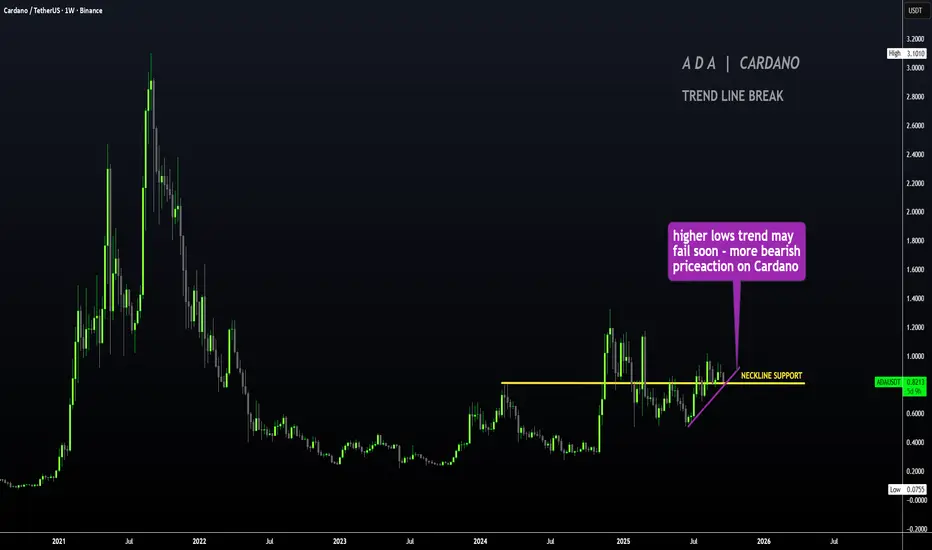
ADA - Failure to LAUNCH, BEARISH Short TermHello Traders
Cardano / ADAUSDT is not looking good for the short term after the higher lows trendline has been broken (trendline analysis / support analysis).
The 4h shows a bearish drop with a nasty red candle:
Also, if we consider a technical indicator - the moving averages - the price has fallen far under the 200d MA, for the first time in months. This is not a good sign, unless we can recover towards the upside within a week and stay right under it like a few days ago:
If there is no return to the upside, a coupe of bounce zones we can watch in the near to longer term include :
👋 Thanks for your support
BYBIT:ADAUSDT
#ADA/USDT Trading Strategy ( ADAUSDT ) Buy Trade Setup.#ADA
The price is moving within an ascending channel on the 1-hour frame, adhering well to it, and is on track to break it strongly upwards and retest it.
We have support from the lower boundary of the ascending channel, at 0.6712.
We have a downtrend on the RSI indicator that is about to break and retest, supporting the upside.
There is a major support area in green at 0.6736, which represents a strong basis for the upside.
Don't forget a simple thing: ease and capital.
When you reach the first target, save some money and then change your stop-loss order to an entry order.
For inquiries, please leave a comment.
We have a trend to hold above the 100 Moving Average.
Entry price: 0.7395.
First target: 0.7634.
Second target: 0.7943.
Third target: 0.8324.
Don't forget a simple thing: ease and capital.
When you reach the first target, save some money and then change your stop-loss order to an entry order.
For inquiries, please leave a comment.
Thank you.

#ADA/USDT#ADA
The price is moving within a descending channel on the 1-hour frame and is expected to break and continue upward.
We have a trend to stabilize above the 100 moving average once again.
We have a downtrend on the RSI indicator that supports the upward move with a breakout.
We have a support area at the lower limit of the channel at 0.6300, acting as strong support from which the price can rebound.
Entry price: 0.6360
First target: 0.6460
Second target: 0.6580
Third target: 0.6700

#ADA/USDT#ADA
The price is moving within a descending channel on the 1-hour frame, adhering well to it, and is heading for a strong breakout and retest.
We are seeing a bounce from the lower boundary of the descending channel, which is support at 0.7025.
We have a downtrend on the RSI indicator that is about to break and retest, supporting the upward trend.
We are looking for stability above the 100 moving average.
Entry price: 0.7045
First target: 0.7364
Second target: 0.7584
Third target: 0.7884

#ADA/USDT#ADA
The price is moving in a descending channel on the 1-hour frame and is adhering to it well and is heading to break it upwards strongly and retest it
We have a bounce from the lower limit of the descending channel, this support is at a price of 0.5923
We have a downtrend on the RSI indicator that is about to break and retest, which supports the rise
We have a trend to stabilize above the moving average 100
Entry price 0.6615
First target 0.7111
Second target at 0.7585
Third target at 0.8205

Cardano / TetherUS
Weekly Analysis of Cardano
Hello and greetings to dear followers,
This is a simple and effective analysis of the weekly Cardano chart, clearly highlighting excellent buying opportunities. Based on the market value of the cryptocurrency, we have updated and published this analysis.
Chart Overview:
Monthly Liquidity Level: The monthly liquidity is $0.2756.
Buy Zone: The weekly buying zone is $0.2096, and the likelihood of the price reaching this level is very high.
When the price approaches these areas, we will enter a buying position upon receiving daily confirmation. Given the CHoCH (Change of Character) on the weekly chart, it’s not unexpected for the price to reach these levels to attract the necessary liquidity for a new peak, and this time we could witness an exceptional position for this asset!
Position Update:
I will regularly update my selling positions in the 4-hour and daily time frames, and I will republish this analysis along with those updates.
Risk Disclosure:
This analysis is intended solely for informational purposes and should not be considered financial or investment advice. Trading in financial markets carries risks and may result in the loss of your capital. Therefore, I kindly ask you to conduct the necessary research before making any investment and to enter trades with full awareness.
Thank you, and I wish you success!
Fereydoon Bahrami

#ADA/USDT Ready to launch upwards#ADA
The price is moving in a descending channel on the 1-hour timeframe and sticking to it well
We have a bounce from the lower limit of the descending channel, this support is at 0.9500
We have a downtrend on the RSI indicator that is about to be broken, which supports the rise
We have a trend to stabilize above the 100 moving average
Entry price 0.9682
First target 1.02
Second target 1.06
Third target 1.11

ADAUSDT Short Idea / Elliot Wave Principles / Fib AnalysisWhen analysing the market, I noticed this potential Elliot Wave setup on ADAUSDT. For a number of reasons, I suspect that this pairing is forming a good opportunity to achieve a ~5.5 R:R short.
The process taken to get to this idea is as follows:
Macro view of the support / resistance flip zone on ADA between $1.20 and $1.30.
Clean chart showing the interaction with the support / resistance zone.
Validation of Wave 1 Rules
Validation of Wave 1/2/3 Rules
Validation of Wave 4 Rules
Validation of Wave 5 Rules
Correction Wave and Short Area of Interest

ADA/USDT – Key Demand Zone Around $1The blue box on BINANCE:ADAUSDT.P represents a strong demand zone that could attract buyers, making it a pivotal area to watch. Its proximity to the psychological level of $1 enhances its significance, as this level could act as both a technical and psychological support.
Key Observations:
Demand Zone: The blue box aligns with a high-probability buying area where buyers are likely to step in.
Psychological Level: The $1 mark serves as a key round number, potentially reinforcing support in this zone.
Buyer Activity: Increased interest from buyers at this level could signal a trend reversal or continuation.
Strategy:
Monitor price action within the blue box for confirmation signals such as bullish candlestick patterns, strong wicks, or increased volume.
A break and hold above $1 could confirm the zone as a new support level.
Place stops below the demand zone to manage risk effectively.
If the zone holds, CRYPTOCAP:ADA has the potential to stage a significant bounce from this key level.
I keep my charts clean and simple because I believe clarity leads to better decisions.
My approach is built on years of experience and a solid track record. I don’t claim to know it all, but I’m confident in my ability to spot high-probability setups.
My Previous Analysis
🐶 DOGEUSDT.P: Next Move
🎨 RENDERUSDT.P: Opportunity of the Month
💎 ETHUSDT.P: Where to Retrace
🟢 BNBUSDT.P: Potential Surge
📊 BTC Dominance: Reaction Zone
🌊 WAVESUSDT.P: Demand Zone Potential
🟣 UNIUSDT.P: Long-Term Trade
🔵 XRPUSDT.P: Entry Zones
🔗 LINKUSDT.P: Follow The River
📈 BTCUSDT.P: Two Key Demand Zones
🟩 POLUSDT: Bullish Momentum
🌟 PENDLEUSDT: Where Opportunity Meets Precision
🔥 BTCUSDT.P: Liquidation of Highly Leveraged Longs
🌊 SOLUSDT.P: SOL's Dip - Your Opportunity
🐸 1000PEPEUSDT.P: Prime Bounce Zone Unlocked
🚀 ETHUSDT.P: Set to Explode - Don't Miss This Game Changer
🤖 IQUSDT: Smart Plan
⚡️ PONDUSDT: A Trade Not Taken Is Better Than a Losing One

Cardano: Crash Ahead? Prepare for a Potential 20%+ Downside!Hey Realistic Traders, let’s dive into the analysis of BINANCE:ADAUSDT
On the daily chart, Cardano continues to struggle below the critical EMA200, signaling a persistent bearish bias. Even more telling, the price has repeatedly respected the bearish trendline, underscoring the strength of this downtrend.
To make matters worse, we've seen a breakout from two major bearish formations: the Rising Wedge and the Ascending Broadening Wedge. Both patterns point to a continuation of the downward spiral. Adding fuel to the fire, the MACD has made a clear bearish crossover, confirming that the bears are firmly in control.
Based on these signals, we anticipate a sharp drop toward the first target at 0.2753. After that, a brief pullback could bring prices back into the green zone before heading even lower to the second target at 0.2384.
This technical outlook remains valid as long as the price stays above the support area at 0.4158.
Disclaimer: "Please note that this analysis is solely for educational purposes and should not be considered a recommendation to take a long or short position on Cardano.
Please support the channel by engaging with the content, using the rocket button, and sharing your opinions in the comments below.

Altcoin Season Cancelled? Cardano Faces 30%+ CrashHonestly, most altcoins are stuck in a bearish rut. We haven’t seen any of them making new highs instead, they're hitting fresh lows. BINANCE:ADAUSDT is no exception, staying stubbornly below the EMA200 line. So, the talk of an alt season? We’re not buying it. Let’s zoom in on Cardano and see what’s really going on.
On the daily chart, Cardano is digging in below the EMA200 line and the bearish trendline, reinforcing the strong bearish trend. A rising wedge pattern had formed, but instead of breaking out, it got hit with a series of heavy bearish candlesticks. And just to keep things interesting, the MACD has thrown in a bearish crossover for good measure.
Recently, Cardano took a nosedive, breaking out of the rising wedge with a surge in trading volume, not exactly what the bulls were hoping for. To add insult to injury, the MACD line slipped below the signal line, signaling that the bears were tightening their grip.
With all these bearish signals lining up, we’re eyeing a possible slide toward Target Area 1 at 0.2506 or even a deeper dip to Target Area 2 at 0.2197. These targets are mapped out using the Fibonacci ratios of 1.272 and 1.618.
However, there might be some hope for the bulls if the price breaks above the resistance level at 0.3815.
Disclaimer: "This analysis is purely for educational purposes and shouldn’t be taken as a recommendation to go long or short on Cardano."
If you’re enjoying the ride, hit that rocket button, share your thoughts in the comments, and keep the conversation going!
