Amd - This correction is not over yet!🤬Amd ( NASDAQ:AMD ) can still drop another -30%:
🔎Analysis summary:
2025 has been an incredible - yet expected - year for Amd. And now, Amd is literally just perfectly rejecting the overall resistance trendline. Looking at higher timeframe structure, Amd is still not done with the drop and can correct another -20% to -30% soon.
📝Levels to watch:
$175
SwingTraderPhil
SwingTrading.Simplified. | Investing.Simplified. | #LONGTERMVISION
Advancedmicrodevices

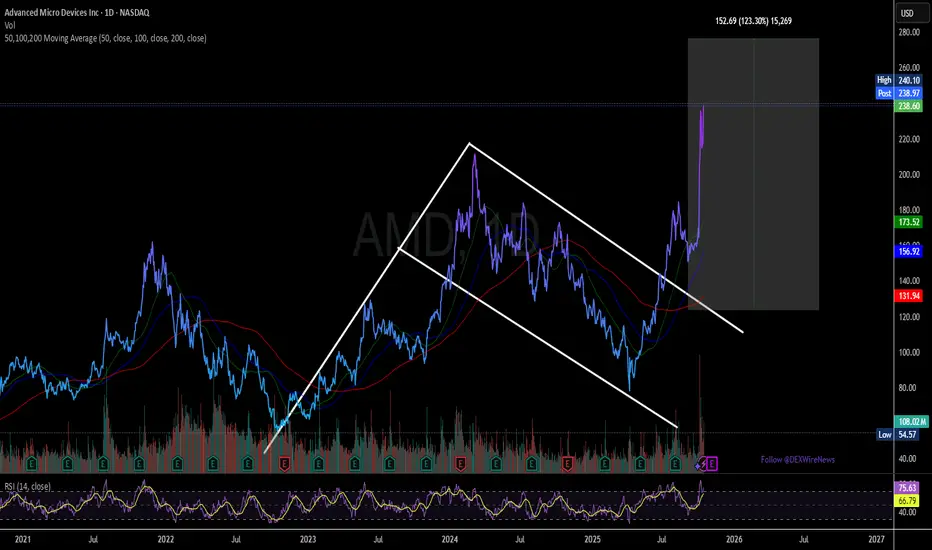
Amd - This stock is just crashing!🎯Amd ( NASDAQ:AMD ) is clearly heading lower:
🔎Analysis summary:
After we witnessed a major bullish break and retest in April of 2025, Amd rallied about +150%. But with the recent rejection at the major resistance trendline, Amd is now reversing. Following this bearish market structure, Amd can still correct about -25%.
📝Levels to watch:
$150
SwingTraderPhil
SwingTrading.Simplified. | Investing.Simplified. | #LONGTERMVISION

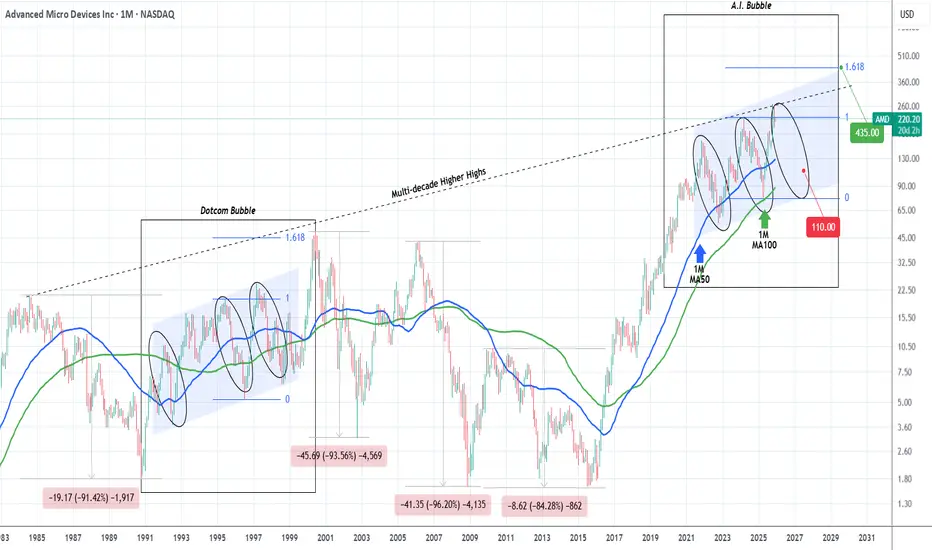
AMD started the A.I. Bubble's final Bear Cycle.2.5 months ago (October 27, see chart below), we gave a bold sell signal on Advanced Micro Devices (AMD), which at the time was against the prevailing bullish market sentiment but started to pay off immediately as the market topped and got rejected:
We still view that Top as the Higher High of its 6-year Channel Up, hence expecting the rejection to evolve into a technical Bearish Leg (Bear Cycle), targeting $110.00.
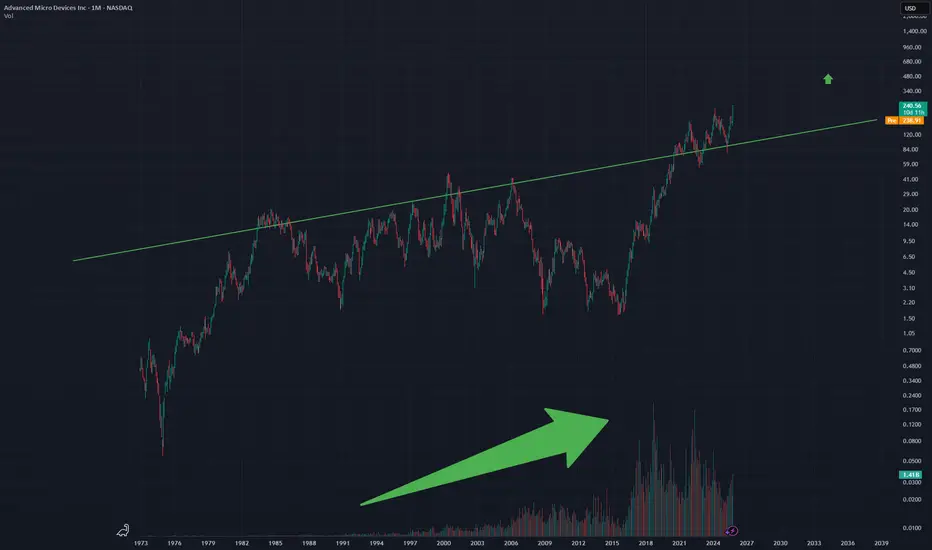
On today's analysis, we take the long-term horizon a step further as we go back to 1984 and the start of AMD's multi-decade Higher Highs trend-line, a Resistance level that has historically pushed the stock to its key market Tops.
On this 1M time-frame, we have pointed out the Dotcom (Internet) Bubble comparing it with the current A.I. Bubble. As you can see there are strong similarities between the two eras and more specifically the symmetry among their Bullish and Bearish Legs. As mentioned on the previous analysis, the current fractal has technically topped, and is now starting the new Bearish Leg towards $110 and the 1M MA100 (green trend-line).
During the Dotcom Bubble when that corresponding final Bearish Leg was completed, the market started is final parabolic rally that peaked marginally above the 1.618 Fibonacci extension and the Bubble burst.
For investors that have a long-term multi-year horizon, that translates for the A.I. Bubble into a $435 Target by 2030.
---
** Please LIKE 👍, FOLLOW ✅, SHARE 🙌 and COMMENT ✍ if you enjoy this idea! Also share your ideas and charts in the comments section below! This is best way to keep it relevant, support us, keep the content here free and allow the idea to reach as many people as possible. **
---
💸💸💸💸💸💸
👇 👇 👇 👇 👇 👇
AMD Hull MA Pullback: Strong Upside Projection Ahead!🔥 AMD Profit Playbook — Hull MA Pullback Power Move 🔥
Asset: AMD – Advanced Micro Devices Inc.
Market: NASDAQ
Style: Day/Swing Trade Profit Playbook
📈 Trade Thesis
The bullish structure stays intact with a clean HULL Moving Average pullback confirming continued upside momentum. The flow remains constructive as long as price respects trend behavior and avoids deep retracements.
🎯 Entry Plan
You can enter at any valid price zone based on your personal system, confirmation signals, or preferred demand levels. Traders use different timing tools — choose what aligns with your process. ⚙️📊
🛑 Stop Loss Zone
SL: 160.00
This is the “Thief SL” level — tight, sharp, and designed for aggressive traders only.
Note: Dear Ladies & Gentlemen (Thief OG’s), this is not a mandatory SL. Choose your own SL based on your risk appetite. Your money = your responsibility. Stay smart, stay safe. 💼⚠️
🎯 Take Profit Targets
Target 1 → 236.00
📌 Strong resistance + trap + liquidity pocket — smart place to escape with clean profits.
Target 2 → 260.00
📌 Heavy resistance + overbought zone + trap formation — high-reaction level, so secure profits before the crowd reacts.
Note: Dear Ladies & Gentlemen (Thief OG’s), TPs are guidance only. You decide your exits. You make money → you take money at your own risk. 💸🫡
👀 Related Pairs to Watch (Correlated / Sector Influence)
These tickers often react together due to semiconductor sector rotation, AI-demand cycles, and ETF weightings:
NASDAQ:NVDA
– Direct peer. Moves with AI spending cycles. Large swings can influence AMD sentiment.
NASDAQ:SMH (VanEck Semiconductor ETF)
– Sector trend indicator. If SMH pumps, AMD usually follows.
NASDAQ:SOXX (iShares Semiconductor ETF)
– Broad chip-market strength gauge. Market-wide chip themes impact AMD direction.
NASDAQ:QCOM
– Tech-chip correlation, especially during macro chip-cycle expansions.
NYSE:TSM
– Manufacturing leader. Capacity signals often impact AMD pricing expectations.
Watching these pairs helps you gauge risk-on/off behavior across semiconductors and improves timing on AMD entries/exits. ⚡📊
📘 Final Notes
This setup is crafted for fun with a “thief-style trading twist”, but still aligned with proper technical structure and TradingView’s rules.
Nothing here is a financial recommendation — just pure charting vibes, strategy style, and technical storytelling. 🎨📉📈
✨ “If you find value in my analysis, a 👍 and 🚀 boost is much appreciated — it helps me share more setups with the community!”
Disclaimer:
This is thief-style trading strategy just for fun. Not financial advice. Trade responsibly.
#AMD #NASDAQ #SwingTrade #DayTrade #HULLMA #BullishSetup #LiquidityZones #Semiconductors #SMH #SOXX #NVDA #TSLAstyleCharts #PriceAction #TechnicalAnalysis #ThiefStyleTrader 🚀🔥

AMD Advanced Micro Devices Options Ahead of EarningsIf you haven`t bought AMD before the previous earnings:
Now analyzing the options chain and the chart patterns of AMD Advanced Micro Devices prior to the earnings report this week,
I would consider purchasing the 220usd strike price Calls with
an expiration date of 2026-9-18,
for a premium of approximately $22.15.
If these options prove to be profitable prior to the earnings release, I would sell at least half of them.
Disclosure: I am part of Trade Nation's Influencer program and receive a monthly fee for using their TradingView charts in my analysis.
AMD Shares Fall Despite Strong NewsAMD Shares Fall Despite Strong News
It emerged this week that the US government, together with Advanced Micro Devices (AMD), has launched the “Mission Genesis” initiative aimed at boosting national computing power through advanced supercomputing. The project is expected not only to significantly expand federal computational capacity but also to increase AMD’s revenue.
Nevertheless, AMD was among yesterday’s weakest performers. Market sentiment has been dampened by concerns over intensifying competition from Google. According to media reports:
→ Google’s TPU (Tensor Processing Unit) chips show strong potential for AI training.
→ Meta Platforms is already in talks to invest billions in Google’s chips for use in its data centres from 2027.
A decline of around 20% in AMD’s share price since the start of the month is worrying, yet the chart analysis offers some encouragement for the bulls.
Technical Analysis of AMD Shares
Price action suggests that since April, AMD has been trading within a broad upward channel (shown in blue). Within this structure:
→ the price set an all-time high at the end of October, where the upper boundary acted as resistance;
→ between 7 and 17 November, the median line held as support before eventually giving way;
→ today, AMD is testing the lower boundary of the channel, which may act as support.
Additional factors that could reinforce this lower-channel support include:
→ the psychological $200 level;
→ a wide bullish gap, with its upper boundary near $205.
Taking these elements into account, it is reasonable to assume that conditions may be favourable for the bulls to attempt to revive the broader 2025 uptrend.
This article represents the opinion of the Companies operating under the FXOpen brand only. It is not to be construed as an offer, solicitation, or recommendation with respect to products and services provided by the Companies operating under the FXOpen brand, nor is it to be considered financial advice.

Amd - Here comes the massive reversal!🩻Amd ( NASDAQ:AMD ) is starting to reverse:
🔎Analysis summary:
Starting back in mid 2025, Amd retested a major confluence of support and rallied about +200%. All of this was expected and the rally ended with a retest of a significant trendline. Eventually, after some back and forth, Amd will then create a short term retracement.
📝Levels to watch:
$250
SwingTraderPhil
SwingTrading.Simplified. | Investing.Simplified. | #LONGTERMVISION

AMD Under Watch ⇌ Sellers Strengthening at Major Supply Zones🔥📉 AMD “ADVANCED MICRO DEVICES INC.” – Bearish Profit Playbook | Thief Layers Deployed 🚨
Hey traders! 😎🔍
Here’s my bearish swing/day-trade playbook on AMD, crafted with a fun + professional thief-style twist while staying within TradingView rules. Let’s break it down 👇💼
📉 Plan: Bearish Outlook Active
Price action remains heavy, momentum cooling off, and sellers showing presence near key zones.
Thief Squad preparing for controlled entries 😎🧤.
🎯 Entry Plan (Thief Layering Strategy)
This setup uses a layered limit-style approach — also known as multiple staggered entries to smooth positions.
📌 Proposed Sell-Limit Layers:
230
220
210
(You can extend layers based on your own system — thief flexibility ALWAYS 😎)
⚠️ Note: These are example layers for illustration, not fixed instructions. Adjust based on your own risk model.
🛑 Stop-Loss (Thief Safety Net)
SL Zone: 240
Dear Ladies & Gentlemen (Thief OG’s) 💼🕶️
This SL is simply my reference point — NOT a rule.
You decide your own SL based on your risk appetite, not mine.
Make money? Then take money… at your OWN risk 💰😄.
🎯 Target Zone
Price has a strong support cluster aligning with:
Moving Averaging acting as dynamic support
Oversold zone building
Trap mechanics likely
So the quick escape target is:
👉 TP: 180
Dear Ladies & Gentlemen (Thief OG’s) 💼😄
My TP is not mandatory — adjust yours as you wish.
Take your profits and leave before the “police” catches our position 🚓💨😆.
🔗 Related Pairs to Watch (Correlation Insights)
These assets often move with similar sentiment due to tech-sector correlation, semiconductor supply chain, and risk-on/off flows:
💻 NVDA (NVIDIA)
Strong semiconductor leader — AMD often shadows NVDA’s volatility and sector direction.
📱 QQQ (NASDAQ 100 ETF)
AMD is inside the NASDAQ index. When QQQ sells off, AMD typically follows the broader tech flow.
🌐 SMH (Semiconductor ETF)
Tracks the entire chip sector. Helps understand overall industry strength or weakness.
⚡ TSLA (Tesla)
Not directly connected, but both ride similar high-beta risk cycles. Weak tech sentiment can drag TSLA and AMD simultaneously.
Watching these helps confirm momentum, risk appetite, and sector-wide signals 📊🔍.
🧠 Additional Notes
This setup is for educational, fun, strategy-style illustration purposes.
NOT forcing a fixed entry, SL, or TP on anyone.
Trade smart. Manage risk. Thief style = creativity + discipline ✨😎
✨ “If you find value in my analysis, a 👍 and 🚀 boost is much appreciated — it helps me share more setups with the community!”

Amd - Here comes the major reversal!👺Amd ( NASDAQ:AMD ) is reversing right now:
🔎Analysis summary:
Over the course of the past couple of months, we witnessed a very expected rally on Amd of about +250%. But right now, Amd is retesting a major resistance trendline. If we actually see bearish confirmation in the near future, the next bearmarket will start quite soon.
📝Levels to watch:
$250
SwingTraderPhil
SwingTrading.Simplified. | Investing.Simplified. | #LONGTERMVISION

AMD Shares Rise Above $250 Ahead of Earnings ReportAMD Shares Rise Above $250 Ahead of Earnings Report
Today, 4 November, after the close of the main trading session, Advanced Micro Devices (AMD) is set to release its quarterly earnings report and outline its plans for the near future. Market participants remain optimistic, as several key bullish developments last month strengthened confidence in AMD’s role in the AI infrastructure race:
→ AMD shares surged in early October following news of a multibillion-dollar deal with OpenAI.
→ Oracle Cloud chose AMD’s graphics processing units (GPUs) for its new AI supercomputers.
→ IBM announced a breakthrough in quantum computing made possible through the use of AMD chips.
Buoyed by this wave of positive news and high expectations, AMD’s share price climbed above the psychological $250 mark (+61% since early October), reaching a record high.
Technical Analysis of AMD Stock
Price analysis shows that since April, the market has been forming a broad upward channel (shown in blue):
→ Strong news led to the correction phase (shown in red) being replaced by a resumption of the bullish trend in an aggressive manner;
→ Today, AMD’s price is testing the upper boundary of the channel.
The thickened S/R lines indicate that the angle of ascent is becoming steeper. Much now depends on today’s earnings release. Traders are awaiting confirmation from CEO Lisa Su regarding the company’s revenue forecasts tied to new deals amid the ongoing AI boom.
If bold expectations fail to materialise, a pullback could follow:
→ towards the lower thickened support line;
→ or deeper, towards the median line of the upward channel.
Alternatively, we may see the bulls attempt to break above the upper boundary and extend the blue channel higher.
This article represents the opinion of the Companies operating under the FXOpen brand only. It is not to be construed as an offer, solicitation, or recommendation with respect to products and services provided by the Companies operating under the FXOpen brand, nor is it to be considered financial advice.

Amd - This is still not over yet!🚀Amd ( NASDAQ:AMD ) can rally another +25%:
🔎Analysis summary:
This month alone, Amd has been rallying another +50%. All of this happened because of an expected rejection at a major confluence of support. Looking at the rising channel pattern though, Amd can still rally another +25% before this rally might actually be over.
📝Levels to watch:
$300
SwingTraderPhil
SwingTrading.Simplified. | Investing.Simplified. | #LONGTERMVISION

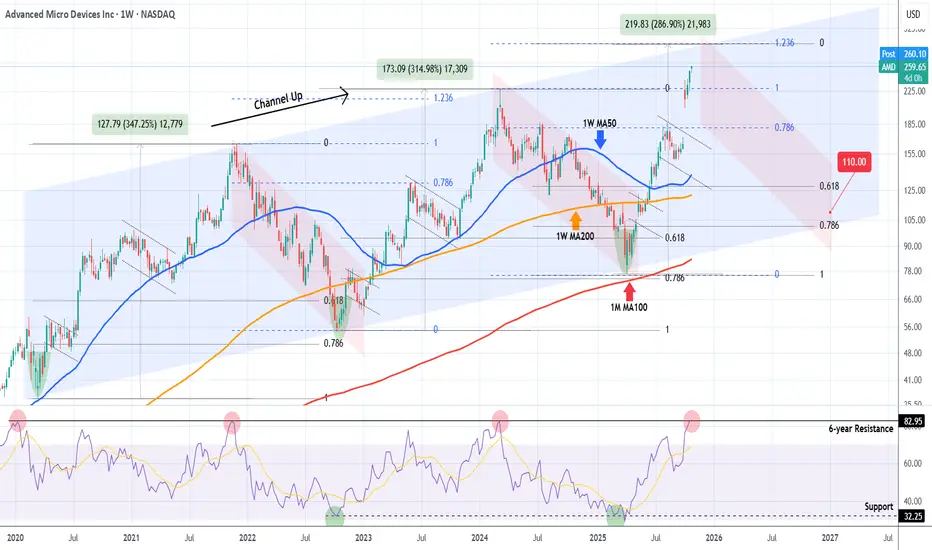
AMD Is it approaching a multi-year top and turning into a Sell ?Almost 8 months ago (March 07, see chart below) we made a bold call (for the time) on Advanced Micro Devices (AMD), expecting it to bottom on its 1M MA100 (red trend-line) and then rebound, targeting $320:
Well the Bullish Leg of its 6-year Channel Up had been even more aggressive than we expected and is already approaching its top (Higher Highs trend-line), much earlier than we expected.
This is technically the right time to book the amazing +240% profits from the April 07 bottom, as the 1W RSI just hit its 6-year Resistance, which has marked the Channel's two Tops.
Even though the Bullish Leg can technically extend as high as +287% on the 1.236 Fibonacci extension (like the previous did), the focus of a long-term investor should now be to buy (much) lower, preferably as close to the 1M MA100 as possible.
The last two Higher Lows of the Channel Up have been priced just above the 0.786 Fibonacci retracement level, so our fair long-term Target is currently at $110.00.
So do you also think AMD is approaching the end of the (long-term) road and is gradually turning into a Sell?
-------------------------------------------------------------------------------
** Please LIKE 👍, FOLLOW ✅, SHARE 🙌 and COMMENT ✍ if you enjoy this idea! Also share your ideas and charts in the comments section below! This is best way to keep it relevant, support us, keep the content here free and allow the idea to reach as many people as possible. **
-------------------------------------------------------------------------------
💸💸💸💸💸💸
👇 👇 👇 👇 👇 👇
Amd - This is just the beginning!🎈Amd ( NASDAQ:AMD ) breaks out soon:
🔎Analysis summary:
Just a couple of months ago, we witnessed a very strong bullish retest on Amd. Back then the channel continuation remained extremely likely, perfectly playing out until today. But despite the recent parabolic rise, Amd can still rally another +50% according to the chart.
📝Levels to watch:
$200 and $300
SwingTraderPhil
SwingTrading.Simplified. | Investing.Simplified. | #LONGTERMVISION

AMD: Wave [iv] Low AMD shares have recently gained upward momentum as anticipated, confirming the low of wave in magenta. In light of this, we have added a new resistance level at $223.50 to the chart. The primary outlook is for the stock to continue completing the magenta five-wave sequence to the upside, thereby finishing the larger magenta wave (1). Afterward, wave (2) is expected to pull price back toward support at $164.53. Alternatively, AMD could see a direct sell-off, which would bring the alternative wave alt.(2) to an early conclusion. In this scenario, wave alt.(1) would already be complete, with a probability of 27%.

AMD - Bullish on Volume and Potential AI I like the volume chart on AMD on this Monthly timeframe, with a consistent growth curve.
AMD also may play a role in the developing AI framework.
Also on chart price can be seen to have broken above the strongest resistance in green.
Monthly chart
Advanced Micro Devices Stock Broke Out of a Bullish Flag TodayThe price of Advanced Micro Devices, Inc. (NASDAQ: NASDAQ:AMD ) has broken out of a falling wedge pattern gaining roughly 9% today. With the daily price chart showing a golden cross pattern the stock is poised to reach the $270 pivot and beyond amidst growing interest.
The surge reflects recent optimism about AMD’s expanding role in the AI chip market, fueled by new partnerships, including a significant deal to supply chips to Oracle’s cloud infrastructure and collaborations with AI leaders like OpenAI.
Moreover, the investors’ confidence is also boosted by recent positive commentary by analysts, who also raised their price targets on AMD stock.
About Advanced Micro Devices, Inc.
It operates in three segments: Data Center, Client and Gaming, and Embedded. The company offers artificial intelligence (AI) accelerators, x86 microprocessors, and graphics processing units (GPUs) as standalone devices or as incorporated into accelerated processing units, chipsets, and data center and professional GPUs; and embedded processors and semi-custom system-on-chip (SoC) products, microprocessor and SoC development services and technology, data processing units, field programmable gate arrays (FPGA), system on modules, smart network interface cards, and adaptive SoC products.
AMD Shares Surge After Partnership Announcement with OpenAIAMD Shares Surge After Partnership Announcement with OpenAI
According to media reports:
→ The deal involves AMD supplying processors of various generations to support the deployment of artificial intelligence infrastructure with a total capacity of 6 gigawatts.
→ The partnership is expected to generate billions in revenue for AMD starting in 2026.
→ Barclays analysts have raised their price target for AMD shares from $200 to $300.
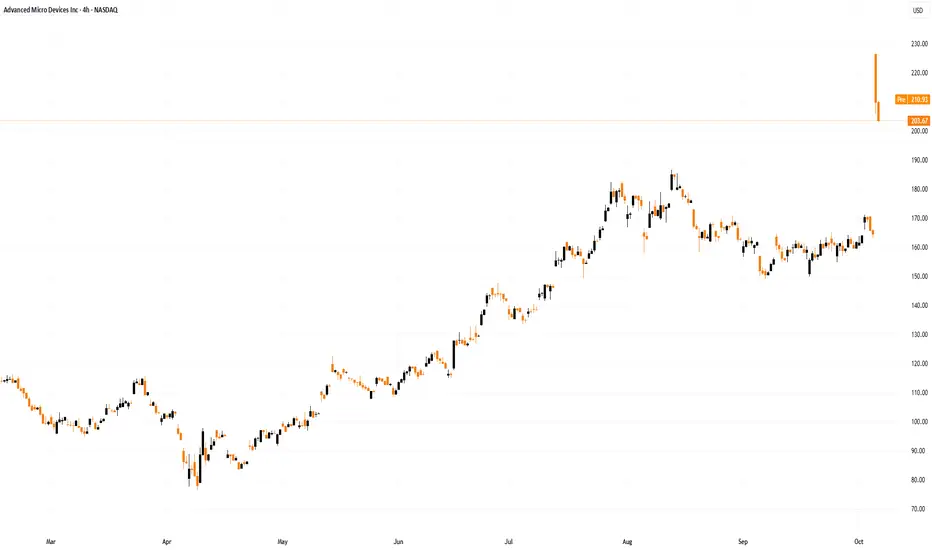
The major announcement fuelled a sharp rally of around 30% in AMD’s share price, though this surge triggered aggressive selling pressure near the historic peak around the $227 level.
Technical Analysis of AMD Stock Chart
Price action analysis shows that:
→ The trading session opened with a wide bullish gap, breaking through the key psychological level of $200.
→ The price also surpassed previous resistance levels at $180 and $190.
→ During the session, the price pulled back, forming two large bearish candles on the four-hour chart.
A reasonable interpretation:
→ The initial reaction was highly emotional, but the optimism is fading quickly.
→ The price movement indicates strong bearish activity following the sharp rise.
Selling pressure is being driven by:
→ Investors locking in substantial profits now, as the deal’s financial impact will unfold gradually over time (creating future opportunities to re-enter at lower prices).
→ Technical signs of an overbought market.
Signs that AMD shares may be overbought include:
→ The RSI indicator, which exceeded 80 yesterday.
→ The price opening significantly above the upper boundary of the ascending channel.
Possible Scenarios for AMD Stock Price
Short-term: Bearish activity could drive a correction towards:
→ The median line of the ascending channel, where demand and supply typically balance.
→ The psychological level of $200, which may influence sentiment among traders reacting to the news.
Long-term: AMD shares remain fundamentally attractive, given that:
→ The AI boom continues to serve as a major growth driver.
→ Market participants expect the Federal Reserve to begin cutting interest rates.
This article represents the opinion of the Companies operating under the FXOpen brand only. It is not to be construed as an offer, solicitation, or recommendation with respect to products and services provided by the Companies operating under the FXOpen brand, nor is it to be considered financial advice.
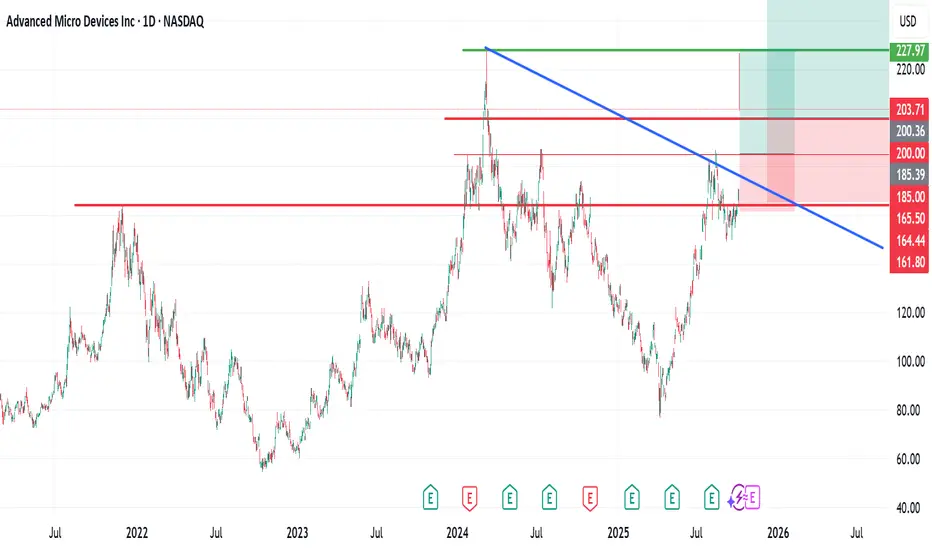
AMD woke up from sleep; It was its timesAMD Update and New Outlook.
In my previous forecast, I maintained a bullish stance on AMD, identifying entry zones between $176 – $172 and projecting a potential move toward $200, with a longer-term target near its all-time high of $226.
Following the recent news of OpenAI acquiring a 10% stake in AMD, the asset successfully reached my forecasted targets.
After the subsequent rally, AMD has experienced a natural pullback, presenting fresh long-term opportunities.
I’m currently watching two new buy zones at $200 and $185 for potential long-term positions.
As always, this is not financial advice. Please conduct your own research (DYOR) before making any investment decisions.
Connect with me here on TradingView. Please, like, follow me and connect.
Previous forecast
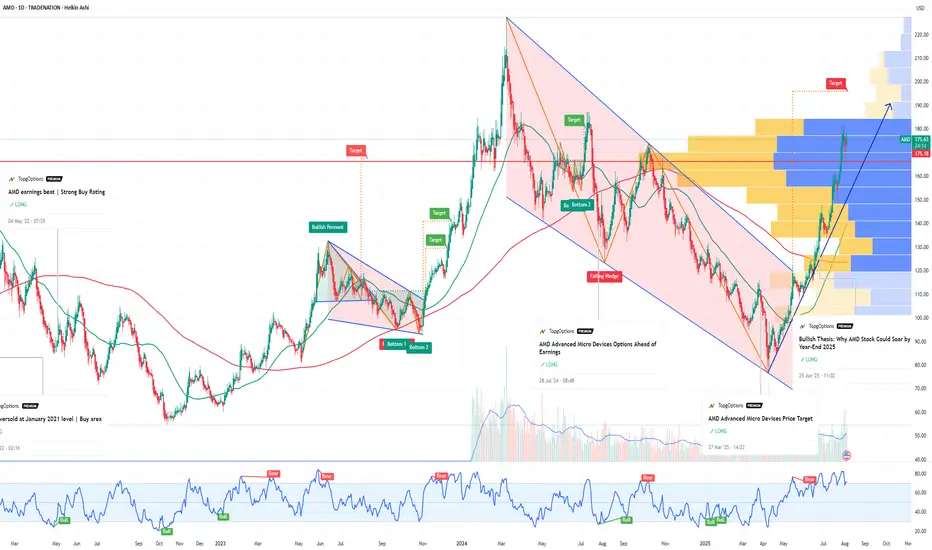
Bullish Thesis: Why AMD Stock Could Soar by Year-End 2025If you haven`t bought AMD before the previous rally:
What to consider now:
1. AI Tailwinds Are Accelerating
AMD is finally gaining serious traction in the AI GPU race. Its MI300X accelerator chips are being adopted by big names like Microsoft, Meta, and Oracle for data center AI workloads. While NVIDIA is still dominant, AMD is expected to grab 10–20% of the AI GPU market share by 2025, according to industry estimates. That’s a multibillion-dollar opportunity.
The MI300X already passed $1B in revenue within its first quarters.
AI server TAM (total addressable market) is expected to grow to $400B by 2027 — AMD is positioning itself aggressively to carve out its slice.
2. Valuation Looks Reasonable vs Peers
AMD trades at a forward P/E around 40, significantly below Nvidia (which trades over 60x) despite similar growth projections for the next 2 years.
Revenue expected to grow over 15–20% YoY in 2025.
Gross margins expanding as high-performance chips dominate the mix.
3. Diversified Growth: Beyond AI
Gaming segment (PlayStation 5 and Xbox Series X chips) remains strong.
Embedded segment from Xilinx acquisition continues to generate solid cash flow.
Client CPU business is rebounding as the PC market stabilizes.
4. Strong Management and Execution
CEO Lisa Su is widely respected for turning AMD around and guiding the company through major innovations and acquisitions (Xilinx, Pensando). Execution has remained consistent, especially in delivering cutting-edge performance-per-watt chips.
Disclosure: I am part of Trade Nation's Influencer program and receive a monthly fee for using their TradingView charts in my analysis.

Amd - The path is too clear!🪓Amd ( NASDAQ:AMD ) will rally another +75%:
🔎Analysis summary:
For the past five years, Amd has been trading in a simple rising channel formation. With the recent retest of a major confluence of support, Amd once again confirmed the bullish trend. Following those previous cycles, Amd will now break the all time high and rally another +75% from here.
📝Levels to watch:
$200
SwingTraderPhil
SwingTrading.Simplified. | Investing.Simplified. | #LONGTERMVISION

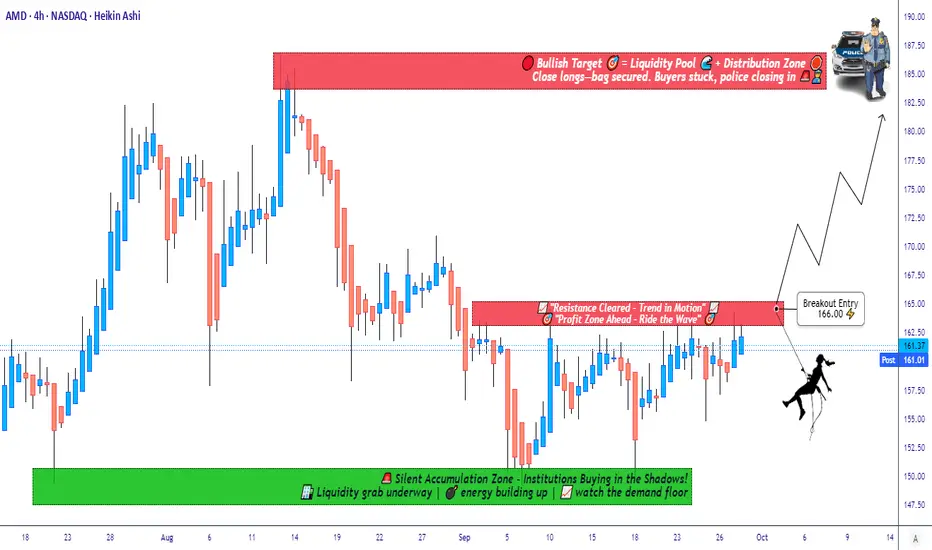
Breakout or Fakeout? Watching AMD Resistance for Next Big Move📈 AMD “Advanced Micro Devices, Inc” – Wealth Strategy Map (Swing/Day Trade)
🗺️ Plan:
I’m tracking AMD with a bullish strategy — waiting for a resistance level breakout to confirm momentum. Once price breaks the key barrier, entry opportunities open up.
🎯 Entry Setup (Thief Strategy Layering Method):
Instead of one entry, I’m applying a layering strategy with multiple buy limit orders. This approach helps average entries across different levels.
Buy limit layers: 155.00, 158.00, 160.00, 162.00, 163.00. 164.00
(💡 You can increase layers based on your own risk & comfort.)
Breakout confirmation: Entry after breakout price level mentioned.
🛑 Stop Loss (Thief SL):
Suggested stop loss @150.00
⚠️ Note: Dear Ladies & Gentlemen (Thief OG’s), this is my SL level, but you are not required to follow it. Manage risk according to your own plan.
🎯 Profit Target (Police Barricade Zone 🚨):
Price faces a strong resistance around 186.00 — this area acts as a trap zone with overbought conditions.
Target @186.00 (escape with profits before police catch you 🚔).
⚠️ Note: Again, TP is personal. Take profit when satisfied — your money, your choice.
🔗 Related Assets to Watch (Correlation Insight):
AMD tends to move in line with broader tech sentiment and semiconductors:
NASDAQ:NVDA (NVIDIA) – Direct sector competitor, often mirrors momentum.
NASDAQ:SMH (VanEck Semiconductor ETF) – Strong correlation, broader chip market direction.
NASDAQ:QQQ (NASDAQ 100 ETF) – AMD is a major component; index momentum often drives AMD.
NASDAQ:INTC (Intel) – Rival stock; negative news on INTC can boost AMD sentiment.
Watching these pairs helps confirm breakouts & avoid false signals.
✨ “If you find value in my analysis, a 👍 and 🚀 boost is much appreciated — it helps me share more setups with the community!”
⚠️ Disclaimer:
This is a Thief Style Trading Strategy — shared for fun & educational purposes only.
Not financial advice. Trade at your own risk.
#AMD #SwingTrade #DayTrade #Stocks #Semiconductors #TradingStrategy #BreakoutSetup #StockMarket #NVDA #QQQ
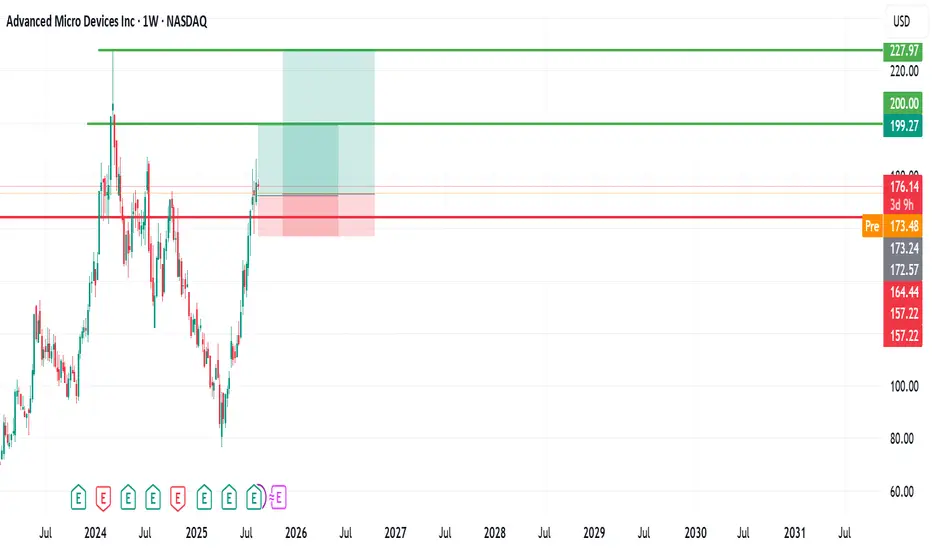
Advanced Micro Devices (AMD) Stock Analysis. My buyAdvanced Micro Devices (AMD) Stock Analysis
AMD, listed on NASDAQ, has generally been on an upward trend. However, the last 2 weeks, the stock experienced a brief flash downturn, dropping to around the $157 level and witnessed a good recovery last week, reaching $186 zone.
Since then, it has pulled back and is currently trading at approximately $176 share.
Outlook:
I remain bullish on AMD with entries from $176 - $172 and anticipate a potential move toward the $200 level, with a longer-term target around its all-time high near $226.
For my entry strategy, I am adding positions at different levels, with an initial entry around $176 and another if it drops further
Position (s) are for a mid- to long-term hold.
Let’s see how it unfolds! If you have any insights or thoughts, please share them in the comments. I’d love to connect with you. Don’t forget to follow, share, and subscribe. Thank you.
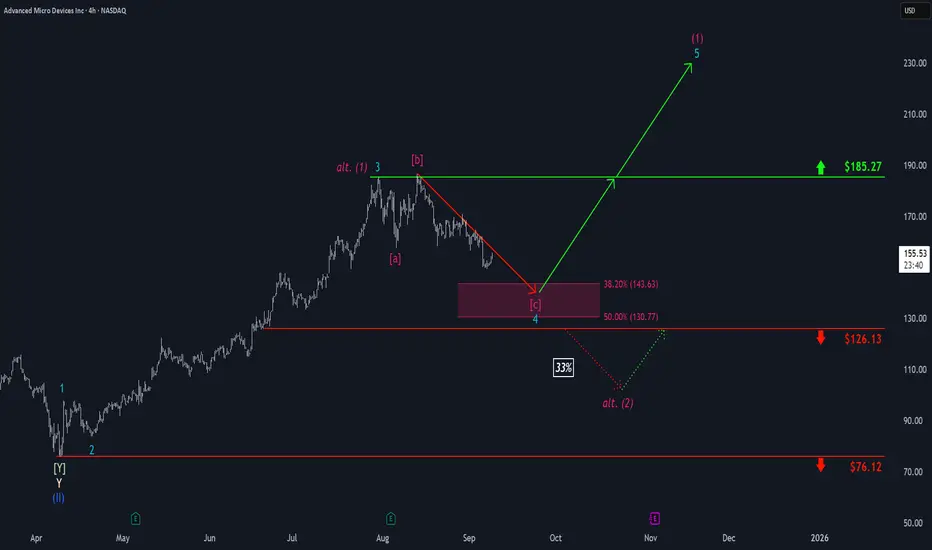
AMD: Drawing Closer...Step by step, AMD has been drawing closer to our magenta Target Zone between $143.63 and $130.77, which remains a favorable range for long entries. Prices should establish the low of turquoise wave 4 within this zone before reversing higher to resume the ongoing upward impulse—initially breaking above resistance at $185.27 and targeting the peak of magenta wave (1). However, we see a 33% chance that magenta wave alt. (1) has already completed, with a quicker low for wave alt. (2) likely to form below support at $126.13. Due to this alternative scenario, potential long trades within the magenta zone could be protected with a stop either 1% below the lower boundary of the zone or at the $126.13 level.