Bitcoin Back to Bullish Trend after October LiquitdationBitcoin is showing signs of bullish price trend and momentum for the first time since the mid-October crypto liquidation event.
Price has logged 2 green candles and working on the third which are the first green candles since October 9th, indicating a shift to bullish price trend. Price is also above the 8, 13, 21 and 50 moving averages with the shorter averages crossing above the 50ma, indicating a shift to bullish price trend. During the decline and consolidation over the past few months, price also held above the April 2025 low which means that the long-term bull market is intact. This bull market has been in play since April 2023 when price crossed back above the 200-day average and marked the end of the post-FTX collapse bear market. We've been in a bull market since then when price was at $28k and as of now it looks like this October liquidation decline has just been another bullish pullback in an overall structural bull market.
The PPO indicator shows the green PPO line rising above a rising purple signal line, with the green PPO line crossing above the 0 level. When the PPO line is trending above the 0 level it indicates bullish momentum behind price.
The ADX indicator shows a rising green +DI line and it is above a declining purple -DI line which is another indication of a bullish price trend. The background histogram is green and rising which indicates increasing bullish price trend.
The TDI indicator shows a rising green RSI line, which is also trading above the upper Bollinger Band and crossing above the 60 level. Price is considered to have bullish momentum when the RSI is above 60, and in general you don't want to be short when the RSI is above it's upper Bollinger Band.
Overall, Bitcoin is looking the most bullish here since the October 2025 liquidation event.
Stay humble and stack Sats.
ADX

BTC market regime change
BTC daily market regime changed.
Market environment looks different from last week.
I track market environment using:
- Trend vs Range
- High vs Low Volatility
Trend + High Vol -> Range + High Vol

2POINTZERO (ADX) | Bullish Continuation Setup After Healthy PullGreetings Traders,
Price has completed a corrective move and is showing early signs of bullish continuation.
🔹 Technical View:
• Strong support formed near 2.55–2.60, aligned with the 200-day MA
• Higher low structure suggests buyers stepping in
• RSI recovering from lower levels, indicating improving momentum
🔹 Trade Plan:
• Buy: Above 2.85 with volume confirmation
• Take Profit 1: 3.15
• Take Profit 2: 3.40 (strong resistance zone)
• Stop Loss: Below 2.54
🔹 Outlook:
A confirmed breakout above 2.85 may open the door for a move toward the upper resistance zone. Manage risk carefully near key resistance levels.
This is a technical setup, not financial advice.
📈 Happy Trading & Stay Disciplined!

BTC vs. The Fed: The "Neutral Coil" Before the ExplosionDescription: Today represents the collision of a massive macro catalyst (FOMC) and a technically "coiling" market. As professional traders, we do not gamble on the outcome of the speech; we identify the breakout levels that the speech will trigger.
1. The Macro Setup: Priced to Perfection According to the CME FedWatch Tool, the market has priced in an 89.6% probability of a rate cut.
The Trap: When certainty is this high, the "upside" of the news is often limited (priced in), while the downside risk of a "hawkish surprise" is violent. The market is leaning one way, which makes the reaction unpredictable.
2. The Technical Reality: Dead Neutral Replacing complex algorithms with standard, time-tested indicators reveals a market that is holding its breath.
RSI (14): Currently sitting at 48.45. This is effectively 50—dead neutral. Bulls and bears are in perfect equilibrium waiting for a trigger.
Bollinger Bands: Price is chopping directly on the 20 SMA (Middle Band). We are neither overbought nor oversold. We are in "fair value" territory, which is typically where trends go to pause before a volatility expansion.
ADX (Trend Strength): The ADX has dropped to 25, signaling that the previous directional trend has exhausted itself.
3. The Levels to Watch (The Trade) Because the technicals are neutral, we must wait for price to leave this "value zone" to confirm the winner.
Bullish Confirmation: We need a decisive Daily Close above the 0.382 Fib level ($97,600) and the upper resistance knot. Reclaiming this level opens the door to test the $100k psychological barrier.
Bearish Invalidation: If the Fed disappoints, watch the recent swing lows around $84,800. A loss of this support invalidates the recovery and exposes the lower Bollinger Band.
Summary: Do not front-run the Fed. The indicators (RSI 48, ADX 25) are telling us there is no trend right now. Wait for the volatility to break the range, then follow the momentum.
DISCLAIMER: Trading involves significant risk. This analysis is for educational purposes only and is not financial advice. Do your own due diligence.

ADNOC Drilling (ADX) – Head & Shoulder Pattern Forming!Greetings Traders,
The ADNOC Drilling (ADX) chart is showing signs of a potential Head & Shoulder formation, which could signal a short-term correction before the next reversal phase.
Key Observations:
The price action is shaping up for a Head & Shoulder pattern; confirmation of the right shoulder will complete the setup.
If the price drops near AED 5.62, it will validate the pattern and may trigger a move down toward the Reversal Zone (around AED 4.80 – 5.00).
Volume and RSI divergence support the possibility of this correction phase.
The 200-day moving average is nearby, adding importance to the neckline region.
After reaching the reversal zone, a bullish rebound is likely if buying volume returns.
Strategy:
Monitor the neckline closely. If the pattern confirms, expect a short-term pullback before a potential recovery from the reversal zone. Wait for confirmation before taking new long positions.
Happy Trading & Stay Disciplined!

#ADX/USDT#ADX
The price is moving within a descending channel on the 1-hour frame, adhering well to it, and is heading for a strong breakout and retest.
We are seeing a bounce from the lower boundary of the descending channel, which is support at 0.0914.
We have a downtrend on the RSI indicator that is about to break and retest, supporting the upward trend.
We are looking for stability above the 100 moving average.
Entry price: 0.0935
First target: 0.0951
Second target: 0.0966
Third target: 0.0986

Multiply Group (ADX) – Bearish Divergence Ahead, Stay Cautious!Greetings Traders,
A bearish divergence has appeared on the Multiply (ADX) daily chart — time to stay alert!
Key Observations:
RSI shows a bearish divergence, signaling possible short-term weakness.
High volumes recently indicate strong participation — a good sign for future momentum.
Price action may move sideways, consolidate, or even push slightly higher before a decisive move.
The buy zone is above the last higher-high (≈ AED 3.45) with confirmation from strong volume.
Stop Loss: around AED 2.75 (below last low).
Take Profit: near AED 4.15, aligning with the upper target projection.
💡 Strategy: Wait and observe the divergence play out. Enter only on confirmed breakout with volume confirmation. Manage risk with tight stop-loss levels.
Happy Trading & Stay Disciplined!

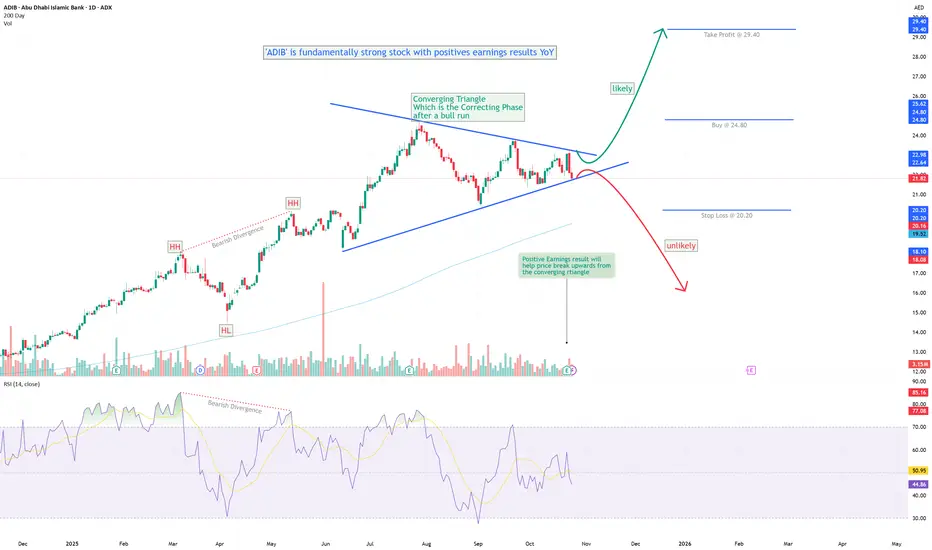
ADIB Stock Analysis – Converging Triangle in Focus!Greetings Traders,
Today, we’re taking a closer look at ADIB (Abu Dhabi Islamic Bank) — an interesting setup forming on the chart!
Key Highlights:
Fundamentally strong: ADIB continues to deliver solid YoY earnings growth.
Bearish divergence was observed earlier, leading to strong selling pressure, followed by the formation of a converging triangle pattern.
This triangle appears to represent a corrective phase after a prolonged bullish rally.
The stock recently announced positive earnings results, reinforcing the underlying strength.
Considering the technical and fundamental setup, a bullish breakout from the triangle looks probable.
Trading Plan: Wait for a confirmed breakout above the upper trendline before entering a cautious long position. Traders can take a risky position after break-out of triangle. And for Cautious traders wait for the breakout from the upper tip of the triangle.
Stop Loss: Below the recent swing low.
Keep an eye on volume during the breakout — confirmation is key.
Happy Trading & Stay Disciplined!
Following PIVX, we take the X's on the HOOKAs I have already written, you should not try to jump on the departed train on pivx, which I recommended for purchase for more than a month, it is better to consider the options where the X's are just being prepared. First of all, they include CHESS HOOK BMT MITO VIC.
Consider the position of the HOOK. After listing on binance, the token left several strong technical signals for a retest up to 0-50-75, which is highly likely to lead to a major growth wave. The growth momentum last week was only the first investment in the upcoming trend. An uptrend line has been formed and there is a high probability of an attempt to consolidate above it before the end of this month. The quarter opened in a mixed zone, an opening above 0.09 gives a signal for growth up to 0.15, however, an opening below 0.1 is likely to give pullbacks in the event of a sharp increase. The main long-term support for the current issue is the 0.0750-850 range, from which there was a rebound after a long-term rebidding. A hike below this range is likely only with an additional significant drawdown of ETH. The most likely target is an attempt to close the current monthly candle above 0.21-21 in order to continue the trend in the new month. With negative overall market dynamics, there is a possibility of a pullback from 0.21-25. In this case, in the new month, we can expect a new attempt to return to the trend line from 0.110-125, which will provide an additional opportunity for scalping.

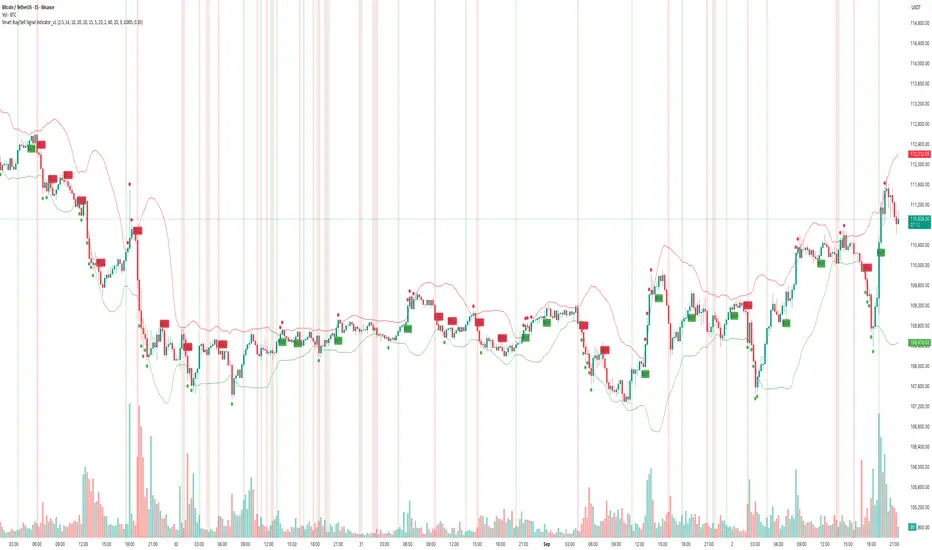
How to Use - Smart Buy/Sell Indicator — Real-Time & ReversalDescription
The chart above demonstrates how the Smart Buy/Sell Signal Indicator combines multiple conditions — Supertrend, RSI, ADX, Confirmation MA, and Bollinger Bands — to highlight potential trade opportunities in real time.
🔹 Core Signals
• Buy / Sell Triggers: Generated when trend, momentum, and volatility filters align.
• Reversal Clouds: Appear when RSI, ADX, and Bollinger extremes suggest potential exhaustion or traps.
🔹 Unique Aspect — Real-Time & Leading
Unlike many lagging tools, this indicator evaluates conditions during the live candle formation.
• If all rules align → signal appears immediately.
• If conditions fail before the candle closes → the signal disappears.
This design allows it to act as a leading signal generator, giving traders early heads-up rather than waiting for full candle confirmation. It emphasizes signal accuracy over repainting, by ensuring only valid conditions remain visible at close.
🔹 What Makes It Different
• Multi-factor confirmation (trend + momentum + volatility)
• Cooldown logic to avoid clustered signals
• Both continuation & reversal insights in one tool
• Adaptive to trending and sideways phases
📊 In the example above (BTCUSDT, 15m), you can see how signals align with both momentum-driven moves and intraday reversals.
⚠️ Note: This is an analytical tool, not financial advice. Performance varies across assets and timeframes. Always backtest and combine with risk management.
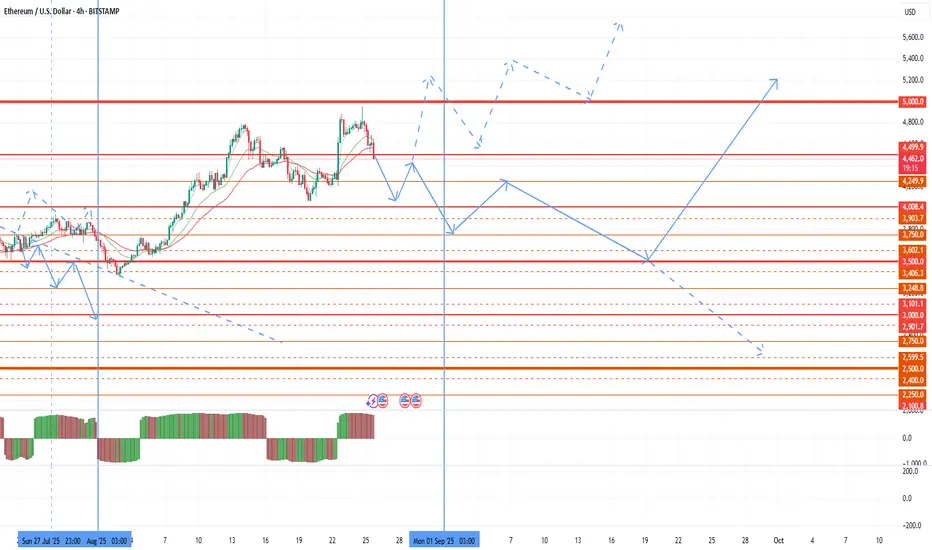
Attention, seasonal sales!Today we have moved on to the seasonal sales period, and I want to review the market situation once again. As I wrote in my last review, in order to continue active trading, I am waiting for another delisting and assignment of the monitoring tag, after which we can identify more reliable and attractive tools for speculators. However, this year binance continues to make the footsteps. After ether's growth was too fast to form a trend, a significant pullback was prevented in July. This prevents further purchases and consolidation above 5k. At the same time, there was no delisting and assignment of the monitoring tag, which preserves the threat of drawdown for altcoins and reduces the activity of buyers. As a result, the seasonal August purchases were repaid.
The next seasonal wave of market growth is from the end of September to the beginning of November. In the next three weeks, it is worth preparing for a bear attack and, hopefully, another assignment of the monitoring tag, after which it will be possible to identify altcoins that are safe for operation.
Before the closing of the current monthly candle, there is still a possibility of the last bull attack in the second half of the week with a possible 5k takeover, however, only with a clear signal, which may be negative data on US GDP or a sharp rise in brent oil above $ 70 followed by a breakout of the last monthly candle for EUR/USD. But for now, for 3-4 weeks, the probability of a retest of 3500 on ether prevails at least, followed by a resumption of growth from the end of September if the bulls hold 3500.
As expected, fan tokens have shown themselves to be the most interesting and confident in such a market picture due to strong oversold conditions, but today I have also finished work with them before the likely seasonal decline.
Gold Futures – Waiting for the Flush Before the Long (Asian KillMarket Context:
Gold is sitting right inside a confluence zone — overlapping Daily + H4 Fair Value Gaps at 3,375–3,380. This zone also aligns with the lower boundary of last week’s range (W-L at 3,397).
What I’m Watching:
Going into the Asian Killzone, I’m looking for an impulsive spike down into this FVG.
This move would ideally push below 3,375, tag liquidity, and create DOM excess — the kind of aggressive selling that often marks exhaustion before reversal.
ADX is above 25 and rising, signaling momentum is strong — but we’re at a potential pivot level.
Bullish Setup Criteria:
Flush down into 3,375 or slightly below.
DOM excess showing absorption (stuck sellers).
Strong rejection candle (M1/M5) followed by bullish follow-through.
Targets if Triggered:
T1: 3,397 (Weekly Low)
T2: 3,423 (Daily High)
Stretch: 3,451 (Monthly High)
Invalidation:
1H close below 3,375 without immediate reclaim.
Summary:
Patience is key. I want to see sellers press in during Asia, fail to break down with continuation, and then get run over on a squeeze higher. If we get the right reaction, this could be the start of a strong move into Weekend.

ADCB – Quick 6% ScalpAbu Dhabi Commercial Bank (ADCB) is showing strong momentum after reclaiming 12.52 AED. Price is currently trading at 13.48 AED, pushing aggressively toward the next key level at 14.32 AED, which stands as a major resistance zone.
📌 Target : 14.32 AED (Major Resistance)
📌 Scalp Gain: +6%

EAND – Gaining Momentum for the Next MoveEtisalat Group appears to have bottomed, establishing a key accumulation range between 15.74–18.58 AED. Price is currently playing within this range, building a solid base after a prolonged downtrend.
If Etisalat breaks above the 18.58 AED resistance with strong volume and follow-through, it opens the door to a clean upside move toward the next key levels:
T1: 20.14 AED
T2: 22.24 AED
T3: 25.88 AED
T4: 28.70 AED
The structure is tight and range-bound, but the market sentiment shows early signs of strength. A breakout from this base would confirm a shift in trend and could trigger a mid- to long-term bullish leg.
📌 Risk management: The 15.74 AED level serves as the invalidation zone. As long as price holds above it, bulls remain in control of the setup.

uptrend for #burjeelBURJEEL holding in #ADX market after reach to demand area 1.20~1.30 AED per share now start a Uptrend.
long position is recomanded with the SL 1.20 AED
if the downtrend line break price can reach 1.48~1.50 AED very soon.

Long position for 1INCHUSDT in 4H 2.74 RRLong Position for 1INCHUSDT in 4H with a 2.74 RR
Long 0.1748
TP 0.1904
SL 0.1691

Monthly Candle volatility growthThe market remains extremely sluggish in the seasonal flat, but there is a possibility of increased volatility this week and next. In this regard, I would like to consider the market situation and the likely prospects. First of all, in the medium term, the probability of a flat of about 100k for bitcoin and 2500 for ether prevails until the opening of the new half-year. There are no sufficient arguments for a significant break and trend towards 210k for bitcoin and 5k for ether. In addition, strong statistics for the United States began to be released, which increases the likelihood of a retest of 1900-2100 on ether and 85-90k on bitcoin. That is, until August, I am still more likely to expect a flat of 95-110k and 2250-2750 under an optimistic scenario. With a more negative picture, there remains the possibility of a major drawdown of the market until the retest of the loyalties of the first quarter on the tops.
A significant spike and bullish trend may be facilitated by the cancellation of Trump's duties voluntarily or in court, a truce in Ukraine, or the consolidation of brent above $ 69-70 while maintaining growth. In the event of a resumption of duties or a collapse of oil below $ 60, the probability of a fall in the crypt will become extremely high.
Against the background of the closing of the last bullish monthly candle and above 2500 on ether, we have technical signals for continued purchases. This week, there is a possibility of a major wave of purchases in the first half of the month with an attempt to move. However, strong US statistics are likely to continue to dampen growth attempts. Starting next week, it is worthwhile to carefully consider the volume of positions in the work due to the high probability of a market drawdown in the second half of the month. At the end of the week, I will assess the probability of maintaining purchases in the second half of the month, depending on the statistics released this week and the dynamics of oil.
To date, I am still considering the most oversold coins for scalping that have not been assigned the chess fio adx monitoring tag with possible growth waves of up to 70-100% from current levels. Fan tokens with a growth potential of up to 100-200% remain in a highly undervalued position, among which I work with atm acm city porto Lazio alpine juv. For storing funds in the medium term, quick looks interesting with the main long-term support at 0.020-21. The cos slf data pivx token can also show growth waves of up to 30-40%.
As I wrote earlier, large-cap coins, against the background of a seasonal flat and likely sales, may continue to fall slowly until August, in the absence of major growth in the tops or the index of dominance of altcoins.

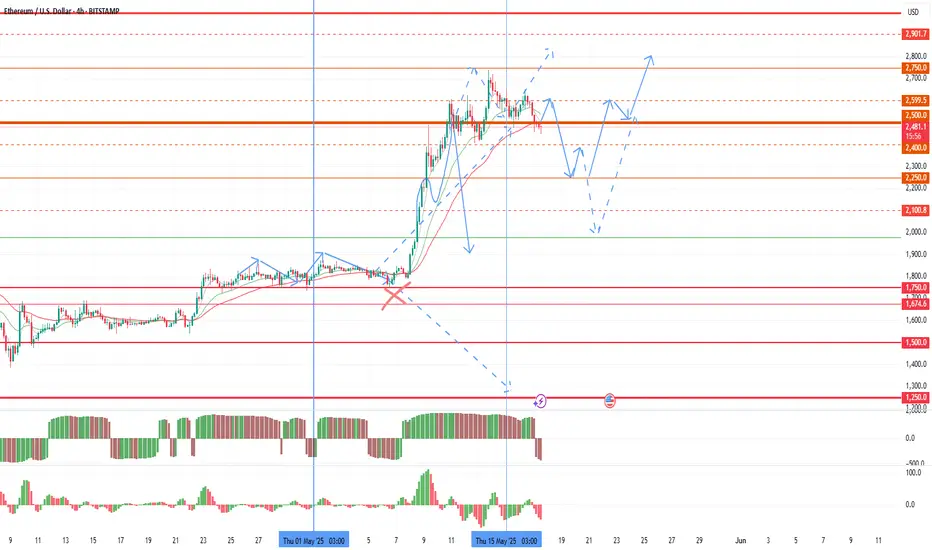
Continuation of the flat under the pressure of seasonal salesAnd so a difficult week is behind us, with overcoming the middle of the quarter. Against the background of positive factors, the week and the second half of the quarter opened above 2500, which provides market support and reduces the potential for decline. However, we have only come to a temporary consolidation of the market and it is too early to talk about a trend change to bullish. The final consolidation of the direction will take place in June. So far, the market has switched to seasonal sales from the 11th, as I warned about, and the bulls' task is to compensate for them. Technically, there is still a lot of potential for retest 2100-2150, which may happen in the coming week.
In an optimistic scenario, the new week will open above 2500. In this case, on Monday and Tuesday we will see insignificant sales again and the ether will not go below 2250 with a return to the hay in the second half of the week. In a more negative scenario, the week will open below 2500, in which case sales up to 2100-2150 are likely in the first half of the week, but with further purchases to 2500 due to the opening of the second half of the quarter above the level.
Today and tomorrow, there is a possibility of a wave of purchases, but I do not recommend keeping large-cap coins in operation, since seasonal sales in a negative scenario may last from mid-May to August, which will lead to their steady decline. Small-cap coins may show more significant growth impulses during this period.
We are also approaching the next assignment of the monitoring tag and delisting, which will have an additional impact on altcoins. So far, fantokens are in a good position, which successfully compensate for the drawdown of the altcoin index and are trying to grow, as they remain undervalued. I think they will remain interesting for speculators in the near future due to the drawdown of the rest of the altcoin market. ATM and city look the most interesting so far, which can continue to grow from their current positions, due to the lack of futures with active sales and the most oversold position. Under an optimistic scenario today and tomorrow, growth waves similar to acm are likely for them. Acm also has a high growth potential, but it may take time to accumulate with a retest probability of 0.75-90 before a new wave of purchases. Second of all, I am considering the alpine juv porto lazio. There is a possibility that binance will continue to add futures to fantokens every week, which will give new growth impulses.
In addition to fantokens, fio chess pivx adx quick, which remain in an undervalued position, can show a new wave of growth. I will be looking at them closer to the middle of the week.
A new probability for a bullrun over the weekendSince in the second half of the week there was an opportunity for the ether to take higher levels, I want to consider the events for the coming days in more detail. At the moment, the growth target is the test test of 2100-2150, then either the range will be broken, in which case a stable trend towards the test of 2250 can be expected on Saturday. If it fails to gain a foothold above 2100, then tomorrow a pullback to the opening of today's daily candle and a second test attempt of 2100-2150 on the weekend are likely.
With all the positivity, I would like to remind you that I mentioned purchases only in the first half of the month, in continuation of the April trend. From Sunday to Monday, there is a possibility of a major market drop if ether does not open the second half above 2250 and bitcoin above 100k. It is difficult to say what could serve as a signal, but positive statistics for the United States have already been released, as the first signal, there may be a collapse in oil at the beginning of the week to stimulate sales. It will be possible to judge further dynamics at the end of the week, but starting from Sunday afternoon, I recommend reducing work positions.
To date, following the tops, large-cap coins show a slight increase, and secondly, we can expect the start of a rampage through the rest of the coin market closer to Saturday. For large-cap coins, you should not expect large growth, since the growth period is still quite small, the probability of gaining large investments during such a period is small. In this regard, the growth waves can be up to 15-20%. Small-cap coins are likely to have a stormy weekend with breakouts of up to 70-100%.
I am primarily considering chess and fio for work, and koma adx pivx quick with slightly less potential for the latter. A bullrun is also likely for fantokens with speeds up to 3x, among which I primarily consider atm city acm.

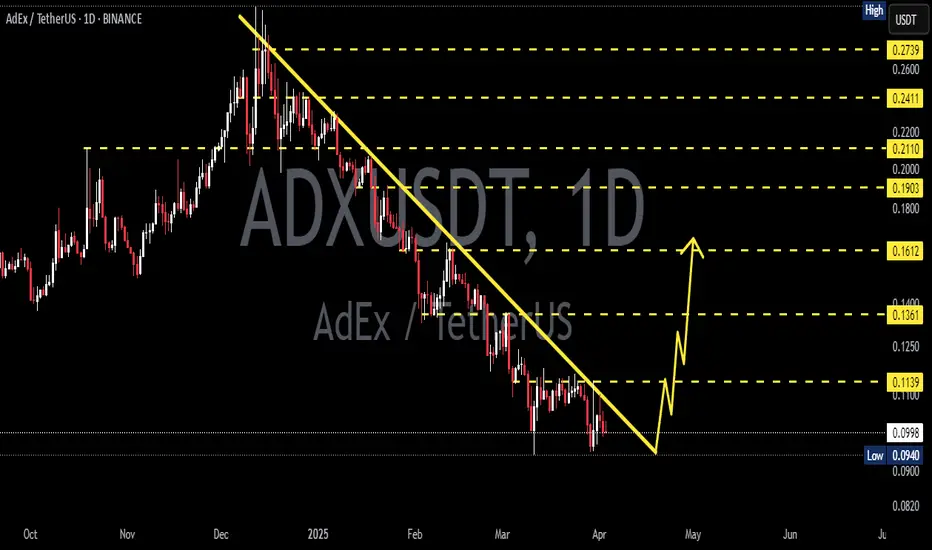
ADXUSDT 1D ADX ~ 1D Analysis
#ADX Buy after successfully penetrating this resistant line with a short -term target of at least 15%+.
ADX:ADNOCLS a bearish chart patternA double top bearish pattern is formed for ADNOCLS, the price may drop to 4.15.

SIB (Sharjah Islamic Bank) ADXSIB have been in uptrend from November till now with outstanding financial performance ~26%, RSI is now below 50 so it is a good time to jump and hold the stock looking for further growth.

Alpha Dhabi ADX - Bullish RSI DivergenceAlpha Dhabi is signaling a strong bullish continuation backed by RSI divergence and Elliott Wave structure. Enter near the 12.30–12.36 zone, manage risks with stops below 11.70, and take partial profits at each TP level.
The RSI formed higher lows, while the price made lower lows, indicating momentum is shifting to the upside.
Trade Setup:
Entry: 12.36 (Bullish RSI divergence confirmation above demand zone)
Stop Loss: 11.70 (Below key demand zone, invalidates Wave 2 structure)
Take Profit Levels:
TP1: 13.00 (RRR ~1.5:1, first supply zone)
TP2: 13.50 (RRR ~2:1, strong resistance near Wave 3 target)
Stretch Target: 14.56 (RRR ~3:1, possible Wave 5 completion)
"Be fearful when others are greedy and greedy when others are fearful." — Warren Buffett
"Stick to your risk management plan and trust the structure as long as the pattern holds."
Disclaimer: This analysis is for educational purposes only and not financial advice. Always perform your own due diligence and trade responsibly. Past performance is not indicative of future results.
