Analysis techniques – Soybean Meal Futures (Dec 2025)Analysis techniques – Soybean Meal Futures (Dec 2025)
Date: Oct 06, 2025 | Timeframe: D1 | Contract Code: ZMZ25
1. Trend Overview and Price Structure
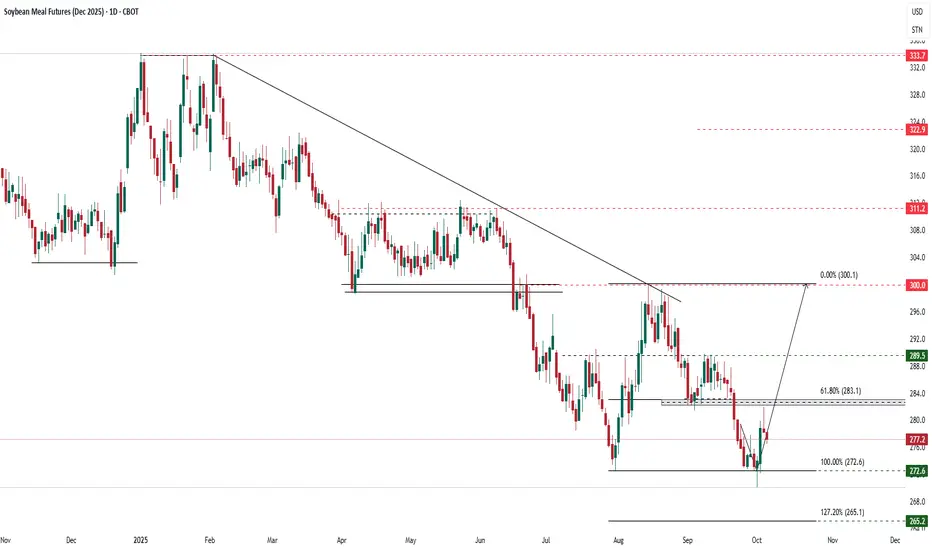
December soybean meal futures edged down by 0.8 USD to 277.4 USD/ton (-0.29%) after rebounding from strong support at 272.6 — the 100% Fibonacci extension of the August–September decline.
The structure suggests a potential short-term corrective rebound, targeting 283.1 (Fib 61.8%) and possibly 300 USD if momentum builds.
Medium-term trend remains bearish, though the narrowing downside range hints at a short-term technical bottom formation.
2. Key Technical Levels
Resistance: 289.5 – 300.0 – 311.2
Support: 277.0 – 272.6 – 265.1
3. Detailed Technical Analysis
(1) Short-term Trend:
Rebound signals from 272.6 suggest potential upside toward 283 – 289.5, with a breakout above 283 confirming recovery momentum.
(2) Volume:
Slight uptick in volume during the rebound indicates renewed bottom-fishing activity.
(3) Wave Structure:
Likely completion of corrective wave C and start of a technical recovery phase (wave 1–2–3) targeting around 300.
(4) Confirmation Signals:
Close above 283 confirms recovery; drop below 272.6 invalidates the bullish setup and opens downside risk toward 265.1.
4. VNC View
Short Term: Technical rebound expected as meal prices are heavily discounted relative to soybeans and soyoil.
Medium Term: Supply-demand balance remains fragile — weaker crush margins and sluggish feed demand cap the upside.
Risks: Stronger USD and Argentine export competition may pressure U.S. meal prices.
5. Suggested Technical Strategies
Preferred Long Setup:
Entry: 276 – 278
TP: 289.5 – 300
SL: 272
Probability: 65%
Short Setup (resistance test):
Entry: 298 – 300
TP: 283 – 276
SL: 305
Probability: 40%
6. Corporate Hedging Guidance
Feed importers: Consider locking in purchases around 275–280 if prices hold above 272.
Oilseed crushers: Delay forward sales until prices approach 300 to secure better processing margins.
Agricultural Commodities
Analysis techniques – Soybean Oil Futures (Dec 2025)Analysis techniques – Soybean Oil Futures (Dec 2025)
Date: 03/10/2025 | Timeframe: D1 | Contract Code: ZLZ25
1. Trend Overview and Price Structure
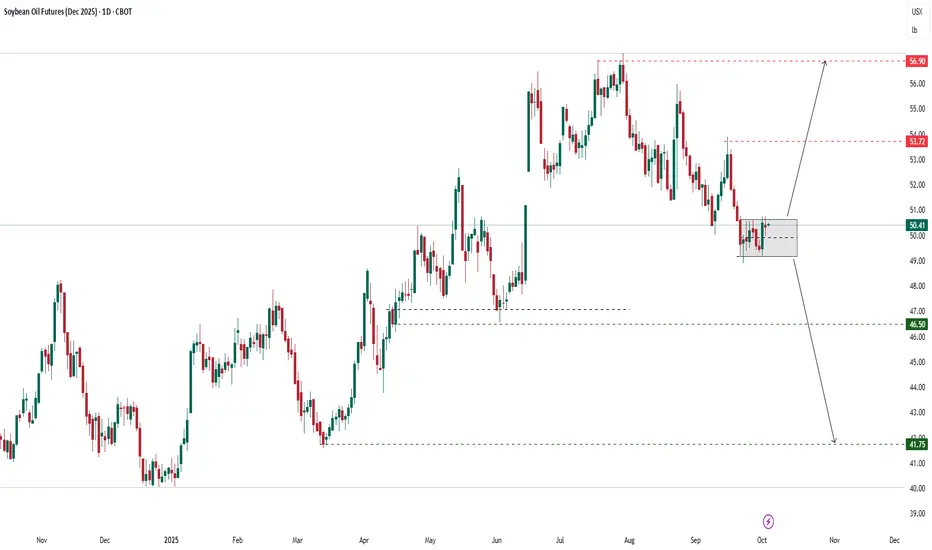
Soybean oil (Dec 2025) closed at 50.41 cents/pound (+0.16%), consolidating within a tight range of 49.5 – 50.5. After a prolonged decline since July, the market is forming a temporary base but remains under bearish pressure. Current structure suggests indecision, awaiting a breakout from the consolidation box.
2. Key Technical Levels
Resistance: 50.5 – 53.7 – 56.9
Support: 49.0 – 46.5 – 41.8
3. Detailed Technical Analysis
Short-term trend: Sideways consolidation in 49.5 – 50.5; breakout will set next direction.
Volume: Average trading volume, limited new flows.
Wave structure: The prior bearish wave is stalling; a corrective rebound could emerge if 50.5 is breached.
Confirmation signals: A close above 50.5 opens upside toward 53.7 – 56.9; a break below 49 targets 46.5 – 41.8.
4. VNC View
Short term, soybean oil is in a fragile balance. A breakout from 49.5 – 50.5 range will provide a clear trading signal. Medium term, global vegetable oil supply (palm, sunflower) exerts strong competition, limiting sustainable rallies unless supported by crude oil or biodiesel demand.
5. Suggested Technical Strategies
Long Setup (on breakout):
Entry: 50.6 – 51.0
TP: 53.7 – 56.9
SL: 49.5
Probability: 60%
Short Setup (on breakdown):
Entry: 48.8 – 49.0
TP: 46.5 – 41.8
SL: 50.5
Probability: 55%
6. Corporate Hedging Guidance
Edible oil producers: May hedge raw material costs near 49 – 50.
Biodiesel industry: Watch 50.5 breakout; increase hedging if confirmed.
Exporters: Favor partial selling near 53.7 – 56.9 during rallies to avoid downside risks toward 46 – 42.
Analysis techniques – Soybean Meal Futures (Dec 2025)Analysis techniques – Soybean Meal Futures (Dec 2025)
Date: 03/10/2025 | Timeframe: D1 | Contract Code: ZMZ25
1. Trend Overview and Price Structure
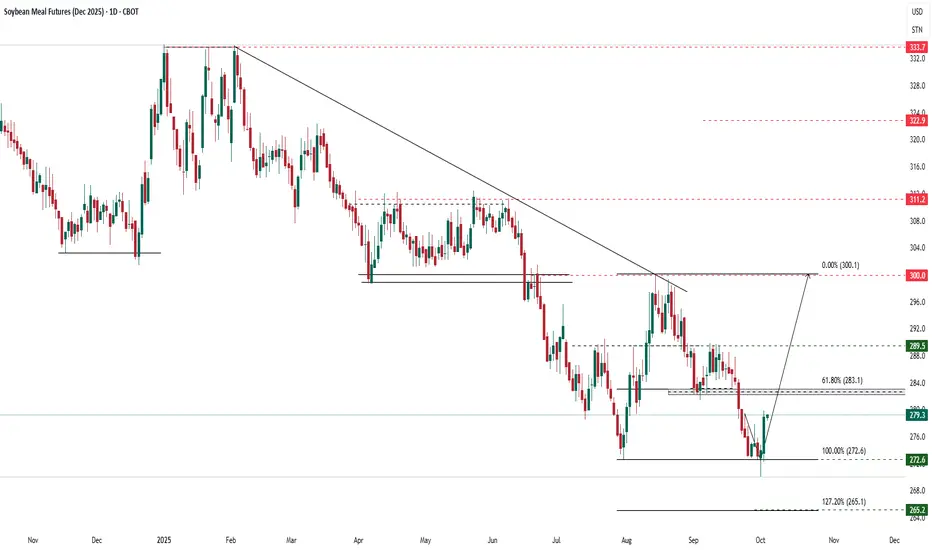
Soybean meal (Dec 2025) closed at USD 279.3/ton (+0.14%) on Oct 3. After testing the 272.6 support (Fib 100%) successfully, prices rebounded. The structure suggests a recovery wave is forming, with near-term targets at 283.1 and 300.
The descending trendline from April remains intact, but a short-term rebound could extend if resistance at 283.1 – 289.5 is broken.
2. Key Technical Levels
Resistance: 283.1 – 289.5 – 300.0
Support: 272.6 – 265.0 – 260.0
3. Detailed Technical Analysis
Short-term trend: The bounce from 272.6 signals a recovery setup.
Trading volume: Bottom-fishing flows have returned, confirming strong reaction to support.
Wave structure: The bearish wave since July may have ended at Fib 100%, opening room for a corrective rally toward 289.5 – 300.
Confirmation signals: A close above 283.1 validates the rebound; failure below 272.6 risks further downside toward 265.0.
4. VNC View
In the short term, soybean meal is in a technical recovery after a deep sell-off. Medium term, abundant U.S. supply and South American crop outlook remain bearish drivers. The 300 level is critical: a breakout confirms a trend reversal, while failure keeps prices range-bound at 265 – 280.
5. Suggested Technical Strategies
Preferred Long Setup (short-term):
Entry: 276 – 278
TP: 289.5 – 300
SL: 272
Probability: 65%
Short Setup (failed rebound):
Entry: 289 – 290
TP: 272.6
SL: 296
Probability: 50%
6. Corporate Hedging Guidance
Livestock sector: May hedge feed costs around 276 – 278.
Exporters: Should sell partially at 289 – 300 to secure margins.
Processors: Stay neutral, add coverage only if prices sustain above 300.
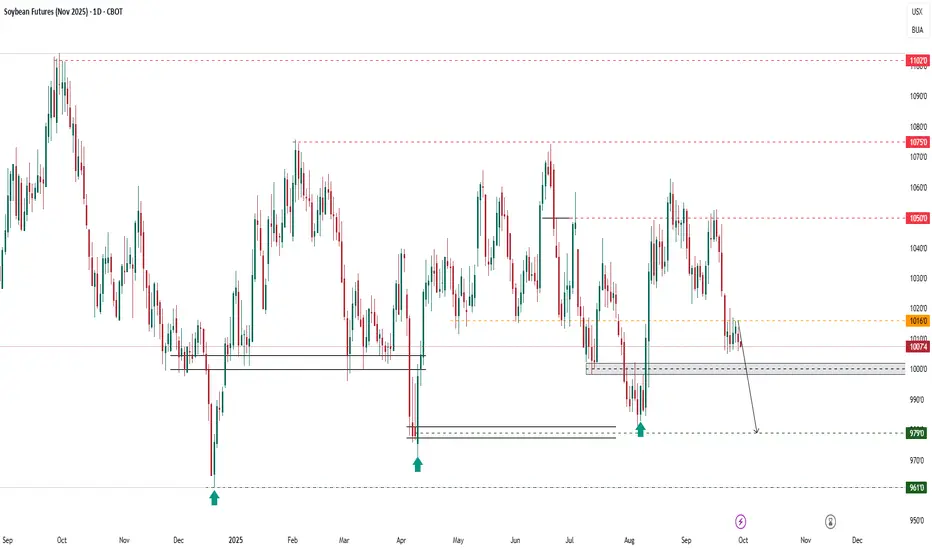
Analysis techniques – Soybean Futures (Nov 2025)Date: 30/09/2025 | Timeframe: D1 | Contract Code: ZSX25
1. Trend Overview and Price Structure
Soybean futures (Nov 2025) remain under pressure after failing to hold the 10,500 resistance. Prices are trading below 10,200 and are testing the psychological 10,000 level, with risks of retesting the 9,790 support. The dominant trend remains bearish.
2. Key Technical Levels
Resistance: 10,160 – 10,500 – 10,750
Support: 10,000 – 9,790 – 9,610
3. Detailed Technical Analysis
Short-term trend: The bearish momentum persists, with consecutive red candles confirming seller dominance.
Trading volume: No major spikes, but sellers remain in control.
Wave structure: A new bearish wave is unfolding, with 9,790 as the immediate target.
Confirmation signals: A recovery above 10,160 is needed to invalidate the bearish outlook.
4. VNC Intelligence Strategic View
With the U.S. 2025 harvest nearing completion and expectations for strong yields, supply pressure remains elevated. Meanwhile, slower Chinese demand adds to the bearish tone. Only unexpected weather disruptions or acreage cuts in 2026 planting could shift sentiment back to bullish.
5. Suggested Technical Strategies
Primary Short Setup:
Entry: 10,050 – 10,100
TP: 9,790
SL: 10,220
Probability: 65%
Counter-trend Long Setup:
Entry: 9,790 – 9,810
TP: 10,050
SL: 9,610
Probability: 50%
6. Corporate Hedging Guidance
Importers may consider gradual buying around 9,800 – 9,790 to secure costs, while U.S. farmers are advised to lock in partial sales near 10,100 – 10,200 to protect margins amid a prevailing bearish environment.
Short Arabica Coffee🔍 Setup
Price is approaching a well‐defined supply/resistance zone (red area on chart). Historically this zone has acted as overhead resistance.
Below, there is a green demand/support zone which should act as target support area.
My target on the short is around 7.8% downside from entry, with stop loss placed just above the resistance zone / recent swing high to limit risk.
📊 Fundamental & Sentiment Background (COT & Others)
According to the latest COT report (as of 9 Sep 2025), commercial hedgers are significantly net short in Coffee C.
tradingster.com
However, speculators / non-commercials are heavily net long. This suggests that bullish momentum is still in force.
tradingster.com
Open interest is rising, showing participation in current levels. This makes the risk of a breakout (to the upside) real, if bulls hold control.
⚠️ Risks to this trade
Momentum from speculators could drive price through resistance, triggering stop losses and a strong short squeeze.
Any unexpected fundamental shock (weather, export disruption, currency devaluation, etc.) could reduce supply or boost demand, pushing prices higher.
If volume doesn’t drop on advance into resistance, the upward move may be stronger than anticipated.
✅ Conditions / Trigger For Entry
I will consider entering the short position once:
Price touches or re-tests the red supply zone.
There's a clear rejection (candlestick reversal pattern + bearish confirmation).
Momentum or RSI / MACD divergence is visible.
Speculator net longs show signs of plateauing or declining in the COT (next report).
🎯 Targets & Risk/Reward
Entry: around current price near supply, or after confirmed rejection.
Stop Loss: just above resistance / recent high.
Target: green demand/support zone (approx. 7-8% downside).
Risk-Reward Estimate: aiming for at least 1.5-2x potential reward vs. risk, ideally better.
🧐 My Edge vs What Could Go Wrong
My trading strategy gives me an average short profit of 7.8%, so this is in line with my risk appetite. The probability for a profitable trade for a short position is 75%. However, on average I will lose 12% on a losing short trade.
But I’m aware shorting commodities is riskier when there's strong bullish positioning (as is the case with speculators now).
I will monitor upcoming COT reports and fundamentals closely — if speculators increase longs again, I might bail earlier or tighten stops.
Conclusion: The COT data does not overwhelmingly confirm a short at this moment. It offers partial support via hedger short positions, but speculator long bias remains strong. If price shows a credible technical rejection in the supply zone and sentiment shows cracks, I believe this short has good risk/reward.
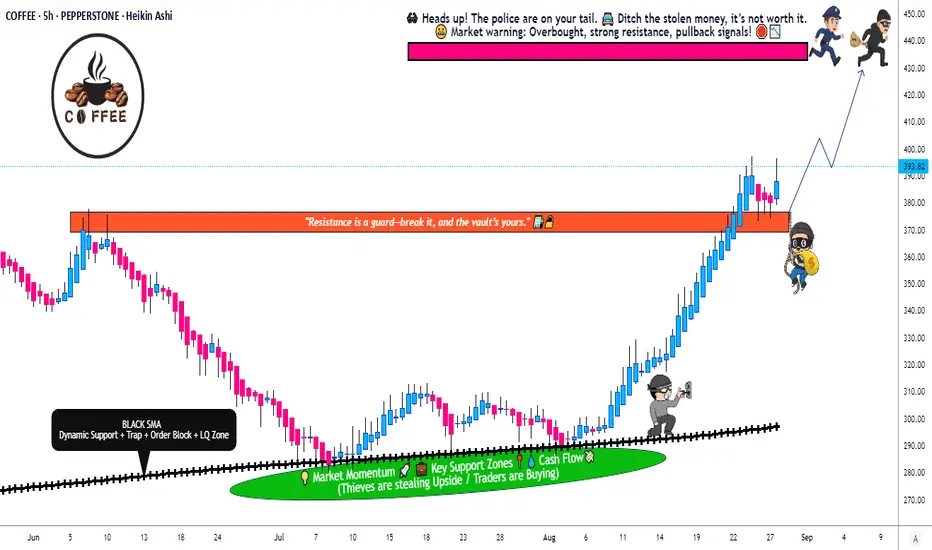
Coffee Heist: Are You Ready for the Bullish Layup?🚨☕ "COFFEE" Heist Plan – Swing/Day Robbery 🚨
🌟 Hola! Ola! Bonjour! Hallo! Marhaba! 🌟
Dear Robbers & Money Makers 🤑💰💸✈️
Based on 🔥 Thief Trading Style Analysis 🔥 here’s our master heist plan to rob the "COFFEE" Commodities CFD Market.
🎯 Plan: Bullish Robbery
Entry 📥: Any price level – Thief always sneaks in at any vault door.
👉 But remember: Thief Strategy = LAYERED ENTRY ⚡
Multiple Buy-Limit Layers:
(390.00) 🏦
(380.00) 💎
(370.00) 🎭
(360.00) 🔑
(Add more layers based on your own robbery plan)
Stop Loss 🛑:
This is Thief SL @ 340.00 ⚔️
Dear Ladies & Gentlemen (Thief OG’s) – Adjust your SL based on your personal robbery strategy & risk appetite.
Target 🎯:
⚠️ Police barricade spotted @ 440.00 🚔
So escape early with the loot @ 430.00 💸 before getting caught!
🏴☠️ Thief Notes:
Our heist is in the bullish zone 🚀
Layer in carefully, don’t rush 💎
Always manage risk – the cops (market makers) are watching 👮♂️
Use alerts, trailing SL & risk management to protect your stolen bags 💰
💥 If you’re riding with the Thief crew – Hit Boost 🚀 & Share Love ❤️ – that fuels our robbery strength!
We rob, we trade, we escape – That’s the Thief Way! 🏆🐱👤
#ThiefTrader #CoffeeHeist #CommoditiesCFD #SwingTrade #DayTrade #LayerStrategy #BuyTheDip #TradingPlan #ForexRobbers #MarketHeist
Swing/Posistiong Idea On Coffee(KC1!)Based on :
- Supply zone and VP Key levels
- Seasonality
- overbought conditions
- AVWAP and VP as potential targets

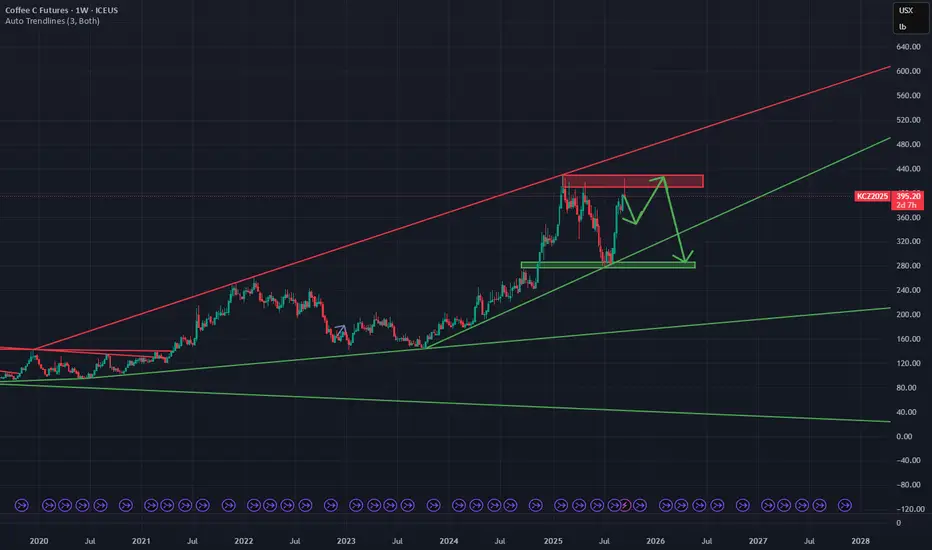
COFFEE At Crossroads: Up or down?COFFEE has seen a strong impulse to the upside. But guess what? Now price is being coiling into a tight triangle. In this case, there are two scenarios possible, and taking into account that the market conditions are bullish, I am more inclined to say that the price will break to the upside of the triangle formation.
Do you agree? Drop a comment below. Engaging with the TradingView community is always helpful to improve and grow as traders.
Not financial advice, just sharing my thoughts on the charts. Trade safely 😊

Farmers Have Been Losing Money for Years Grain is planted in the Spring and harvested in Autumn.
As shown farmers have been losing money for the past several years, buying grain in the spring and selling at a loss.
The entire ag industry is (was) propped up by land inflation, driven by the fantasy of "Yellowstone" cosplay.
Well, this sort of thing can only go on for so long before we run out of buyers.
Best of luck to all the John Duttons out there. "Soft Commodities" showing you are underwater.

COFFEE Price Rising – Is a Correction Ahead?Hello everyone, what do you think about PEPPERSTONE:COFFEE ?
The price of COFFEE is quite interesting at the moment. It has been steadily rising and seems to be forming a familiar triangle pattern. If this pattern continues to develop, there’s a strong chance the price will continue to move upwards. However, I will wait for a strong candle to confirm the signal before making a decision.
My target is 427 , but if the price drops below the triangle, we might see a short-term correction, and we’ll need to reassess.
👉 Do you think the price will continue to rise or is a correction ahead? Share your thoughts in the comments!
Note: This is not financial advice, just a personal view on the chart. Wishing everyone safe and successful trading! 😊

Sugar Futures Long SetupThis is my play — based on seasonality, COT index, and supply/demand.
Seasonality into Q4 historically supports sugar strength.
COT Index: commercials/hedgers are now heavily long, which typically signals a turning point — these players are often positioned opposite speculators at major inflection zones.
Managed money has been trimming shorts, opening the door for a short-cover rally.
Price is pressing into a long-term base zone, with RSI washed out and downside momentum stalling.
Trade Plan
✅ Entry: initiating longs around current levels (~15.8c/lb).
🎯 Target (TP): 17.50c/lb — confluence of prior resistance and seasonal tendency.
🔒 Stop: under recent structure lows (~14.8c/lb) for clean invalidation.
Bias
Positioning, seasonals, and supply/demand all line up for a long setup.
With commercials positioned aggressively long, I see this as a potential turning point with asymmetric upside into 17.5c.
⚠️ Not financial advice — just my read on sugar positioning and seasonals.

Cocoa, Sugar, Coffee & Cotton Rotation📌 The Soft Commodities Super Guide: Cocoa, Sugar, Coffee & Cotton
Soft commodities — crops grown rather than mined — are among the oldest traded goods in human history. From cocoa beans once used as currency in Central America, to cotton powering textile revolutions, to sugar driving global trade and colonization, and coffee fueling productivity worldwide, these markets remain essential and volatile today.
On exchanges like ICE, CME, and NYMEX, traders can access futures and ETFs to speculate, hedge, or diversify portfolios. Soft commodities are especially attractive because of their strong seasonal patterns, geographic concentration of supply, and sensitivity to weather, politics, and demand shifts.
This guide will cover:
Seasonality of Cocoa, Sugar, Coffee & Cotton
Major Price Drivers
Trading Strategies & ETFs/Stocks
Yearly Rotation Playbook
🔹 1. Seasonality of Major Soft Commodities
Seasonality refers to recurring, predictable patterns of price strength or weakness tied to planting, harvest, and demand cycles.
📈 Cocoa (ICE: CC Futures)
Strongest: Summer (Jun–Sep) → Demand builds, weather risk in West Africa.
Weakest: Winter (Dec–Feb) → Fresh harvest supply hits markets.
📌 Example: June–Sep 2020 rally (+20%) from droughts + demand recovery.
📈 Sugar (ICE: SB Futures)
Best Months: Feb, Jun, Jul, Nov, Dec.
Strong seasonal window: May–Jan (fuel demand + holiday consumption).
Weakest: Mar–Apr (harvest pressure).
📌 Example: Nov–Dec 2020 sugar rally (+15%) as Brazil shifted cane to ethanol.
📈 Coffee (ICE: KC Futures)
Strongest: Late Winter to Summer (Feb–Jul).
Weakest: Fall harvest months (Sep–Oct) → new supply weighs on prices.
📌 Example: Frost in Brazil (Jul 2021) cut supply → Coffee futures spiked +60%.
📈 Cotton (ICE: CT Futures)
Strongest: Winter & Spring (Nov–May) → Textile demand, planting risk.
Weakest: Summer & Fall (Jun–Oct) → Harvest & oversupply pressures.
📌 Example: Nov 2020–May 2021 rally (+25%) from China demand + U.S. weather risks.
🔹 2. What Moves These Markets Most?
~ Cocoa
Weather in Ivory Coast & Ghana (70% of supply).
Labor disputes, political unrest, crop diseases.
Global chocolate consumption, health trends.
~ Sugar
Ethanol demand (linked to oil prices, Brazil cane allocation).
Government subsidies & tariffs (India, EU).
Brazil’s currency (BRL) & weather.
~ Coffee
Brazil & Vietnam crops (60% of global production).
Frosts, droughts, El Niño.
Consumer demand trends (premium coffee, emerging markets).
~ Cotton
U.S., India, China output (~65% global supply).
China’s stockpiling/import policy.
Substitute fabrics (polyester), energy prices.
Apparel demand cycles.
🔹 3. Trading Strategies & Investment Vehicles
Futures
Cocoa (CC), Sugar (SB), Coffee (KC), Cotton (CT) traded on ICE.
Provide direct, leveraged exposure.
ETFs & ETNs
Cocoa: NIB (iPath Cocoa ETN).
Sugar: CANE (Teucrium Sugar Fund), SGG (iPath Sugar).
Coffee: JO (iPath Coffee ETN).
Cotton: BAL (iPath Cotton ETF).
Stocks with Exposure
Cocoa: Hershey (HSY), Mondelez (MDLZ).
Sugar: Cosan (CZZ), ADM, Bunge (BG).
Coffee: Starbucks (SBUX), Nestlé, JM Smucker (SJM – owns Folgers).
Cotton: Levi’s (LEVI), VF Corp (VFC), Ralph Lauren (RL), Hanesbrands (HBI), Gildan (GIL).
🔹 4. Soft Commodities Yearly Rotation Playbook
Here’s how traders can rotate positions through the year for maximum seasonal edge:
📌 Example Rotation:
Start year in Sugar & Cotton (Jan–Feb).
Shift into Cocoa & Coffee (Jun–Aug).
Rotate back into Sugar & Cotton (Nov–Dec).
📌 Conclusion: The Soft Commodities Super Strategy
Soft commodities offer traders multiple edges:
✅ Seasonality: Cocoa (summer), Sugar (winter), Coffee (spring/summer), Cotton (winter/spring).
✅ Macro Drivers: Weather, politics, energy, government policies.
✅ Cross-Market Links: Oil prices → ethanol (sugar); apparel cycles → cotton; consumer demand → cocoa/coffee.
✅ Portfolio Benefits: Diversification vs. equities & metals.
The best strategy is to rotate across the year:
Long Sugar & Cotton (winter/spring),
Long Cocoa & Coffee (summer),
Rotate out during weak harvest windows.
Softs may be volatile, but for disciplined traders, they provide predictable, repeatable seasonal opportunities with both futures and equities exposure.
Long Coffee📌 Coffee Futures: Seasonality, Market Drivers & Trading Insights
Coffee is one of the most important soft commodities in the world, consumed daily by billions of people. Traded for centuries, coffee originated in Ethiopia before spreading through Arabia and later into Europe, becoming a global staple.
Today, two main bean varieties dominate the market:
Arabica (≈70% of global supply): Higher quality, smoother flavor, and the most actively traded on futures exchanges.
Robusta (≈30% of supply): Stronger flavor, more caffeine, used in instant coffee and blends.
Coffee futures (KC contracts, traded on ICE) allow producers, roasters, exporters, and investors to hedge against price volatility or speculate on global demand and supply swings. These futures are physically settled, but most speculative traders roll or close positions before delivery.
🔹 1. Global Coffee Supply Concentration
Nearly 74% of the world’s coffee beans come from just five countries:
🇧🇷 Brazil → Largest producer, dominates Arabica and Robusta exports.
🇻🇳 Vietnam → Largest Robusta producer, key competitor to Brazil.
🇨🇴 Colombia → High-quality Arabica supplier.
🇮🇩 Indonesia → Mix of Arabica & Robusta, weather-sensitive.
🇪🇹 Ethiopia → Birthplace of coffee, major Arabica exporter.
Because of this concentration, traders monitor weather, politics, and economics in these countries closely. A frost in Brazil or political unrest in Vietnam can shake the entire global market.
🔹 2. What Moves Coffee Prices the Most?
Coffee is one of the most weather-sensitive and geopolitically exposed commodities.
1️⃣ Weather in Producing Countries
Frosts and droughts in Brazil (especially during flowering season) can cut supply drastically.
El Niño / La Niña events disrupt rainfall patterns across South America and Asia.
📌 Example: July 2021 frost in Brazil devastated crops → Coffee futures surged over 60% within months.
2️⃣ Political Instability
Strikes, protests, or export restrictions in Brazil, Vietnam, or Colombia can delay shipments.
Political risks in Latin America historically coincide with coffee supply disruptions.
3️⃣ Global Economic Growth
Rising incomes in Asia, Africa, and Latin America increase coffee consumption.
Coffee shifts from a luxury to a daily staple, driving long-term demand growth.
4️⃣ Health Reports & Consumer Trends
Positive studies about coffee’s health benefits (antioxidants, longevity, heart health) boost consumption.
Rising demand for premium Arabica beans (specialty coffee, single-origin) drives price premiums.
🔹 3. Seasonality of Coffee Futures
Like other soft commodities, coffee follows seasonal cycles tied to harvest and demand.
📈 Best Periods: Late winter to early summer (Feb–Jul). Traders often buy into supply fears before Brazil’s winter season (risk of frost).
📉 Weaker Periods: Harvest season in major producing regions (Sep–Oct) when fresh supply pressures prices.
📌 Example: Coffee futures tend to rally into June/July when frost concerns in Brazil peak, then weaken post-harvest in the fall.
🔹 4. How to Trade Coffee
Futures & ETFs
Coffee Futures (KC) → Traded on ICE, standard contract for institutional & speculative traders.
JO ETF (iPath Coffee ETN) → Retail-friendly option for coffee exposure.
Stocks with Coffee Exposure
Starbucks (SBUX): Global leader in coffee retail.
Nestlé (NESN.SW): Owns Nescafé & Nespresso, one of the largest global coffee buyers.
JM Smucker (SJM): Owns Folgers & Dunkin’ brands.
Luckin Coffee (LKNCY): Fast-growing Chinese coffee chain (emerging markets play).
📌 When coffee prices rise → Retailers like Starbucks may face margin compression unless they pass costs to consumers.
📌 When coffee prices fall → Profit margins improve for coffee sellers & roasters.
🔹 5. Coffee Trading Strategies
📈 Strategy #1: Buy and Hold
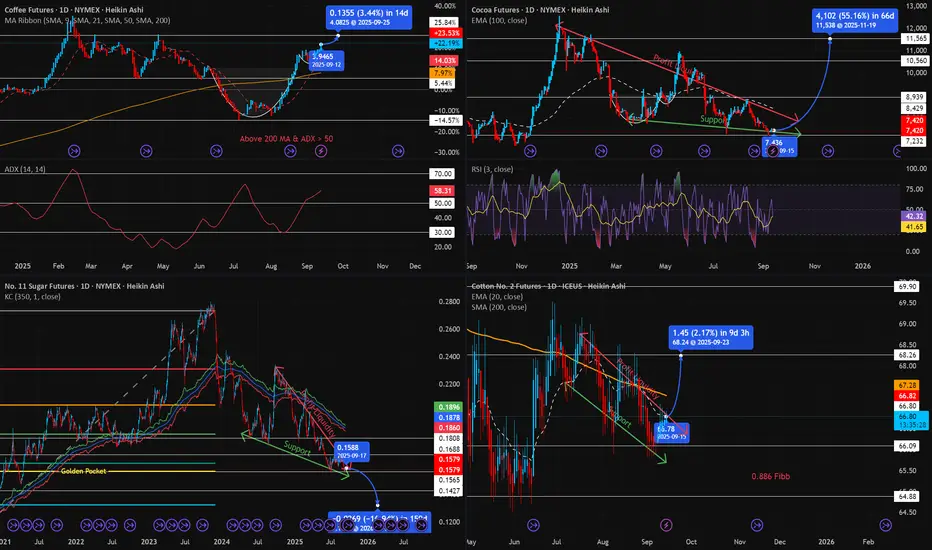
Buy and hold when the close price today is greater than the 200 Simple Moving Average, and the 14-14 ADX is lower than 50; and
Sell when neither of the above conditions are met.
Additional Notes:
In the 4-HR, a 200 SMA and 30 ADX Threshold can work.
Rallies typically last 120~180 days after the signal is generated.
Stop loss is either the 21 SMA, or the 2.5x Daily ATR.
📈 Strategy #2: Seasonal Long (Feb–Jul)
Go long coffee futures or JO ETF in late winter.
Exit before fall harvest (Sep–Oct).
📈 Strategy #3: Weather Hedge
Track Brazil’s weather models (frost, drought risk).
Enter futures or ETFs ahead of known risk windows.
📈 Strategy #4: Macro Demand Growth
Long-term investors may pair coffee exposure with emerging-market consumer stocks (Nestlé, Starbucks, Luckin Coffee).
📌 Conclusion: Coffee as a Soft Commodity Trade
Coffee is one of the most volatile and globally impactful soft commodities. With supply concentrated in a handful of nations and consumption spread worldwide, it offers both seasonal trading opportunities and long-term growth exposure.
✅ Seasonality Edge: Strongest in Feb–Jul, weakest in harvest season.
✅ Macro Edge: Track Brazil, Vietnam, Colombia → weather & politics drive 70%+ of supply.
✅ Consumer Edge: Health trends + premium coffee demand = long-term bullish.
✅ Diversification Edge: Coffee moves independently from equities & metals, making it an attractive portfolio diversifier.
Traders who align seasonality, weather, and demand cycles can use coffee futures or ETFs to capture repeatable opportunities in this globally essential commodity.

Short Sugar📌 When is Sugar in High Demand & How Does It Cycle?
Sugar, extracted from sugarcane and sugar beet, is one of the world’s oldest and most consumed commodities. Beyond sweetening food and beverages, sugar has also become a critical biofuel input through ethanol production, especially in Brazil. Because of its dual role in food and energy markets, sugar futures are actively traded on global exchanges like ICE, CME, and NYMEX, offering traders volatility and diversification.
Historically, sugar has been a boom-and-bust market, with periods of oversupply followed by sharp deficits. These cycles are amplified by government subsidies, tariffs, ethanol mandates, and weather shocks. For hedgers, sugar futures provide protection against price fluctuations, while for speculators, they offer seasonal and trend-based trading opportunities.
🔹 1. Core Sugar Futures Trading Strategies
📈 Strategy #1: Seasonal Hedge Play
The best period to hold long positions in sugar is from late May through late January.
This window aligns with harvest cycles in Brazil and India, along with ethanol blending seasons and holiday consumption peaks.
📌 Historical Note: Data shows sugar has outperformed significantly in these months, making it one of the more reliable soft commodity seasonal plays.
📈 Strategy #2: Keltner Channel Breakout Model
Buy Signal: When price closes above the 350-day moving average + 7-day ATR.
Sell Signal: When price closes below the 350-day moving average – 7-day ATR.
📌 Alternate setting: 111-day length has also proven effective. I prefer Heikin Ashi.
Why it works:
The 350-day average reflects the long-term trend, filtering out noise.
The ATR buffer prevents false breakouts, only triggering when volatility confirms the move.
Sugar tends to trend strongly during supply shocks, making breakout systems powerful.
🔹 2. Seasonality of Sugar Futures
Like most agricultural commodities, sugar exhibits clear seasonal tendencies tied to planting, harvest, and consumption cycles.
📈 Best Performing Months: February, June, July, November, December.
📉 Weaker Months: March–April (post-harvest supply pressure), late summer (demand softens).
📌 Example:
In Nov–Dec 2020, sugar futures rallied over 15% as Brazilian mills shifted more cane production toward ethanol due to higher oil prices, tightening global sugar supply.
🔹 3. What Moves the Sugar Market the Most?
Sugar is uniquely influenced by both food and energy markets:
1️⃣ Government Subsidies & Tariffs
India, Thailand, and the EU heavily subsidize sugar production.
Policy shifts on export quotas or subsidies can swing prices sharply.
2️⃣ Ethanol Demand & Oil Prices
Brazil diverts sugarcane to either sugar or ethanol depending on profitability.
📌 High oil prices → more ethanol demand → less sugar supply → sugar prices rise.
📌 Low oil prices → weaker ethanol demand → excess sugar supply → sugar prices fall.
3️⃣ Brazil’s Currency (Brazilian Real, BRL)
Brazil is the largest global producer/exporter of sugar.
A weaker BRL encourages exports, often putting downward pressure on prices.
4️⃣ Weather Conditions
Sugarcane requires consistent tropical rainfall.
Droughts in Brazil or monsoon failures in India can severely restrict global supply.
5️⃣ Global Consumption Trends
Rising sugar demand in emerging markets, coupled with global population growth, supports long-term demand.
However, health-driven sugar reduction campaigns in developed countries can act as a drag on demand.
🔹 4. Seasonal Sugar Trading Calendar
Month Seasonal Driver Typical Price Behavior Trading Implication
Jan–Feb Ethanol blending + holiday demand Bullish Strong long entries
Mar–Apr Post-harvest supply pressures Weak Potential short trades
May–Jun Brazil harvest + global demand pickup Bullish Begin seasonal longs
Jul–Aug Northern Hemisphere demand steady Bullish Hold longs
Sep–Oct Supply stabilization Neutral/volatile Range trading
Nov–Dec Holiday & ethanol demand Strong bullish Aggressive long entries
📌 Seasonal Summary: Best window to be long is May–January, weakest window is March–April.
🔹 5. Vehicles for Trading Sugar
Sugar Futures (ICE: SB): The most direct exposure, widely used by hedgers and speculators.
ETNs/ETFs:
CANE (Teucrium Sugar Fund) → tracks sugar futures.
SGG (iPath Bloomberg Sugar Subindex ETN).
Sugar Producers & Food Companies:
Cosan (CZZ) → Brazilian sugar & ethanol giant.
Archer Daniels Midland (ADM) → diversified commodity trader.
Nestlé, Coca-Cola, PepsiCo, Cheesecake → indirect sugar demand exposure.
📌 Conclusion: Best Sugar Trading Strategy
Sugar may seem like a simple sweetener, but as a traded commodity it is anything but simple. It sits at the intersection of agriculture and energy, making it one of the most interesting plays in the softs market.
✅ Seasonality Edge: Be long sugar from May–January; strongest months are Feb, Jun, Jul, Nov, Dec.
✅ Trend Edge: Use the 350-day MA + ATR breakout model to catch large moves.
✅ Macro Edge: Watch oil prices and Brazilian real (BRL) → they directly affect supply.
✅ Hedging Edge: Sugar futures are excellent for both producers and consumers to hedge against unpredictable price swings.
In short, sugar provides unique opportunities for traders who combine seasonality, macro awareness, and breakout systems. While volatile, its cyclical tendencies make it a commodity that rewards disciplined strategies.

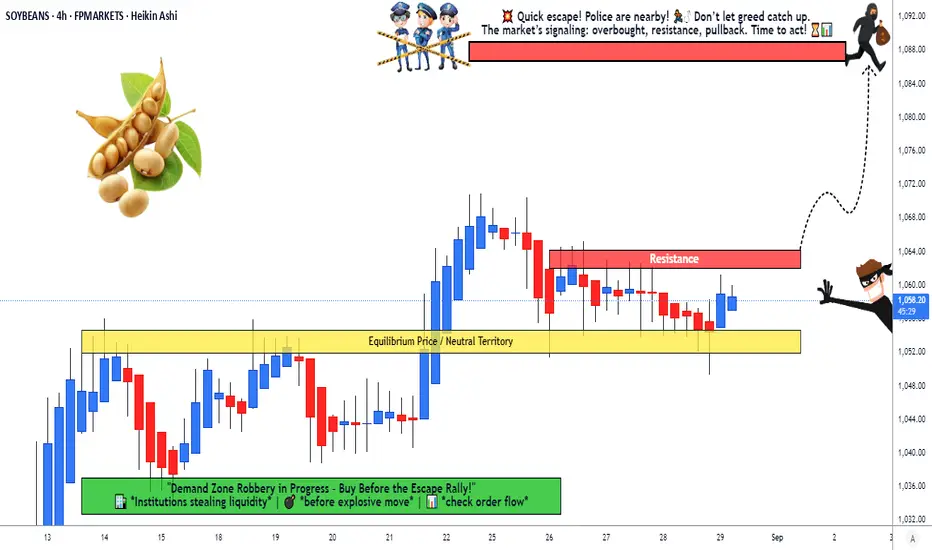
Soybeans vs USD: Breakout Robbery in Progress – Join the Escape!🚨💰🌱 Soybeans vs. US Dollar Commodities CFD Heist Plan (Swing/Day) 🕶️⚡
👋 Dear Ladies & Gentlemen… and my fellow Thief OG’s 🐱👤💵,
Tonight’s grand heist is in the Soybeans Vault 🌱💰 vs. the Mighty Dollar 💵.
We move Bullish 📈 – the loot is ripe, and the guards are weak!
🎯 The Master Heist Plan
Entry (Breakout Trigger): ⚡ 1065.00
👉 Once the vault door cracks open at 1065, we sneak in with Thief Layer Entries 🕶️🔪:
1063.00
1060.00
1055.00
1052.00
(Keep layering your entries, thief-style… the deeper the pullback, the fatter the loot 💎💸).
Stop Loss (Thief Escape Plan): 🏃♂️💨
📍 The secret tunnel is at 1040.00.
But hey thieves, adjust your SL 🔑 based on your strategy & risk appetite.
Target (Police Barricade 🚔):
👉 1088.00 – That’s where the cops set up the roadblock, so escape with the bag before they catch you 🏆💰✈️.
🕶️ Thief Trading Wisdom
Multiple buy limit layered orders = professional thief entry strategy.
Always confirm the breakout before layering in.
Police (market makers) will try to trap you – stay one step ahead 🐱👤⚡.
🔥 Boost our Robbery Plan if you’re part of the crew 💣💵!
The more likes & views, the bigger the gang grows 🚀.
#ThiefTrading 🕶️ #SoybeansHeist 🌱💰 #CommodityLoot 💸 #SwingTradePlan ⚡ #DayTradeRobbery 🐱👤 #USDvsSoybeans 💵 #BreakoutStrategy 📈 #LayerEntry 🔑 #TradingViewHeist 🚔 #MarketLootPlan
CORN - Want some POP? Here it comes...maybe.Corn regained the orange Centerline.
Unfortunately I missed the retest.
But if we are lucky we get it again and then we can pull the trigger to get some nice crunchy Corn.
The Risk-Reward looks nice around the white Centerline.
BRB… off to the kitchen… 🌽🔥

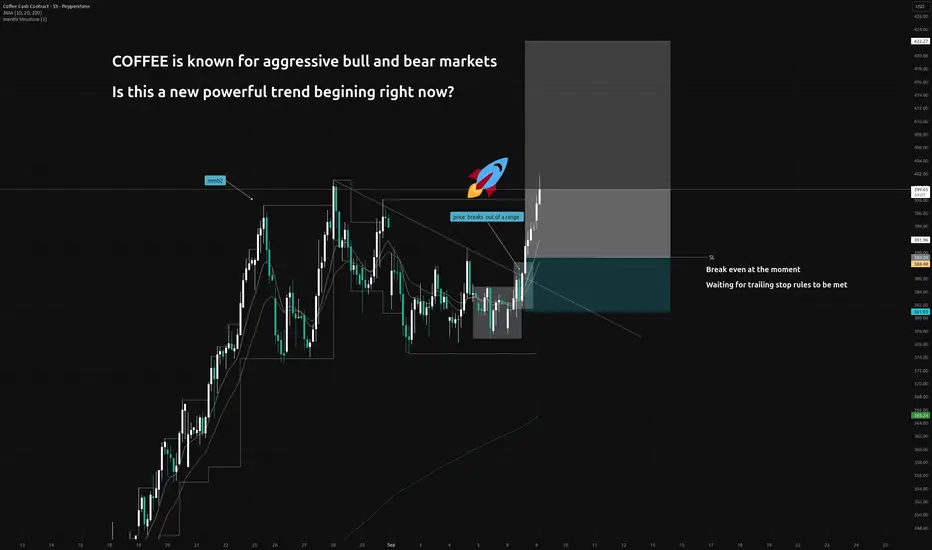
New CRAZY RALLY trying to unflod RIGHT HERE!Big momentum for coffee.
Commodity markets are known for aggresive bull and bear markets.
I never ever touched coffee in the last year and a half but now it looks promising enough to risk some money in a long trade.
Would you buy it?
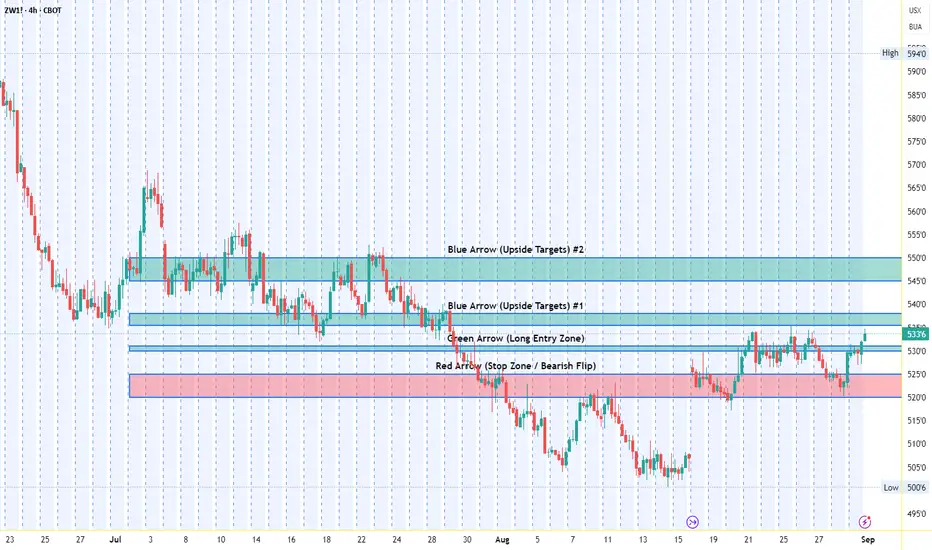
Wheat - ZW - Possible Bullish Momemtum Building
🔹 4-Hour Chart (Medium-Term Swing)
Price has been recovering from the August low (~5000) and is now testing 5336–5350 resistance.
The recent structure looks like a base-building range with higher lows since mid-August.
Outlook : A breakout above 5355 would confirm bullish continuation toward 5450–5500. Failure here likely brings consolidation back to 5250–5280.
🔹 1-Hour Chart (Short-Term Trend)
Strong bullish momentum the past two sessions, with a sharp rally from 5240 to 5336.
The move cleared prior resistance at 5300, now acting as support.
Outlook : Momentum remains bullish short term, but expect pullbacks toward 5295–5305 as a retest before another push to 5350–5380.
🔹 30-Minute Chart (Intraday Moves)
Price action is trending higher intraday, with impulsive green candles and shallow pullbacks.
Resistance sits at 5350–5355 (recent swing high).
Outlook : Expect choppy price action near 5335–5355. Intraday bulls can buy dips to 5310–5320 targeting 5360–5375, with stops under 5290.
🔹 Daily Chart (Broader Context)
Daily shows a bottoming structure around 5000–5050, followed by multiple higher lows.
The broader downtrend since June is weakening, suggesting a potential trend reversal if price sustains above 5400.
Outlook : Daily bias is shifting from bearish to neutral-bullish. Holding above 5300 sets up a push toward 5450–5500 in September.
Summary Outlook
Bias: Short-term bullish across 30M, 1H, and 4H.
Key Resistance: 5355 → 5380 → 5450.
Key Support: 5300 → 5250 → 5200.
Strategy :
Intraday: Buy dips above 5300.
Swing: Hold longs while above 5250, targeting 5450–5500.
Risk flips bearish only if 5200 is broken on the daily.
**This is just my trading thought process and does not constitute as financial advice.
**Please trade with proper risk management*
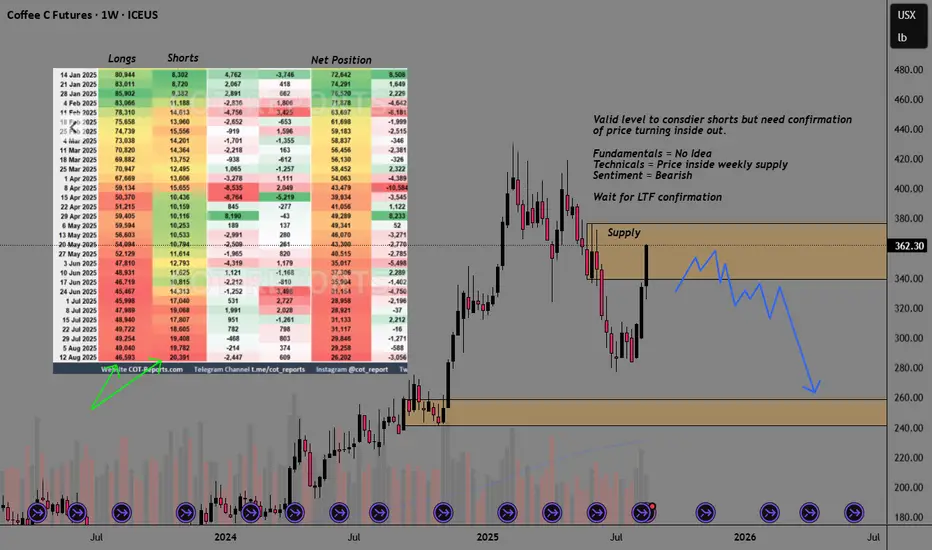
Coffee Futures Hit Weekly Supply Zone with RejectionThis week, Coffee futures have approached a significant weekly supply zone, where the Market
tested the area with a sharp spike, followed by a clear rejection. Currently, traders are watching for a potential re-entry into this same level, aiming for a swing trade targeting the monthly demand area. Additionally, seasonal patterns for coffee suggest a possible bearish trend, reinforcing the outlook for a potential downward move. This confluence of technical resistance and seasonal factors presents a strategic opportunity for traders to position for a downside continuation.
✅ Please share your thoughts about KC1! in the comments section below and HIT LIKE if you appreciate my analysis. Don't forget to FOLLOW ME; you will help us a lot with this small contribution.
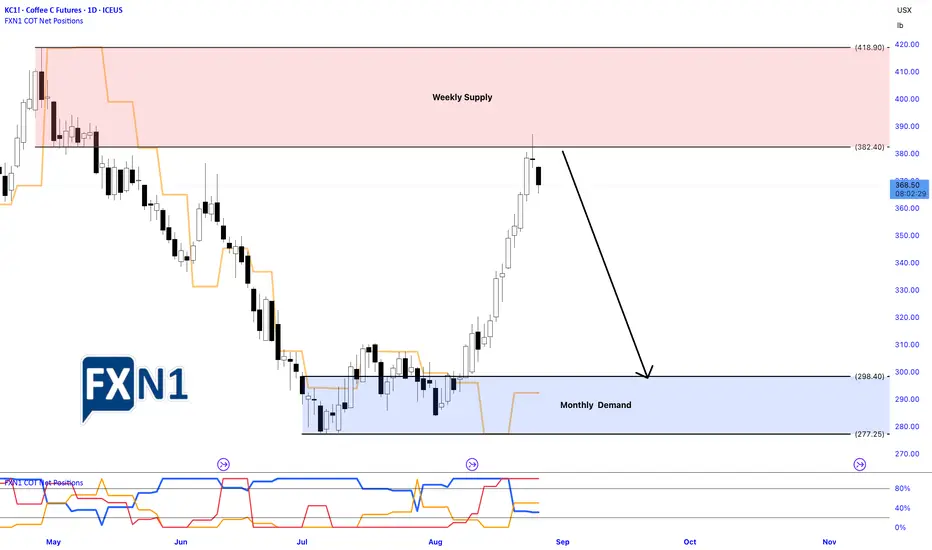
COFFEE Supply-Demand COT AnalysisSee chart for full analysis.
Overall I like looking for shorts with price inside levels of weekly supply
+ COT data suggests more selling is needed. Waiting for confirmation on LTF.
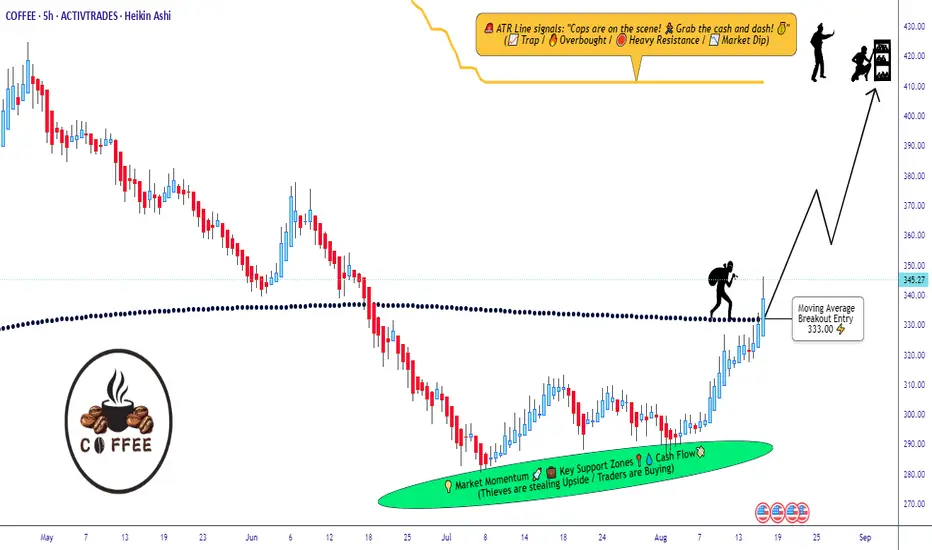
The Coffee Vault is Open! Time to Rob the Bulls’ Treasure!☕💰 COFFEE MARKET HEIST – Bullish Loot Run! 💰☕
🌟 Hola, Bonjour, Hallo, Marhaba, Money Makers & Legendary Robbers! 🌟
Today’s target? "COFFEE" Commodities CFD Market – and we’re going in BULLISH 🚀📈
📌 Plan – Moving Average Breakout Entry
💎 Entry Point: The vault door is open – any price level is fair game!
💡 Thief’s Layer Strategy: Stack those buy limits like gold bars –
(345.00) ➡ (340.00) ➡ (330.00) ➡ (320.00) ☑️
(Feel free to increase the layers if your pockets are deep enough 🤑)
🛑 Stop Loss – Thief’s Escape Hatch
This is my Thief SL @300.00 🔒
👑 OG Robbers: Adjust your SL to match your strategy & risk appetite.
Remember, the cops are always closer than you think 🚔💨
🎯 Target – Police Barricade Ahead
🏆 Loot Goal: 410.00
💥 Hit it, bag the profit, and vanish before the sirens get loud!
📢 Thief Trader Pro Tips
Scalpers: Only rob from the Long side 🏴☠️
Swing Traders: Ride the heist wave with patience 🌊
Always trail your SL to protect the loot 💼
⚠️ Market Alert: Big news drops = high volatility.
🚫 Avoid fresh entries during news blasts.
✅ Manage positions like a true market outlaw.
💖 Boost this plan if you want the robbery crew to stay strong & profitable!
Let’s drink the profits ☕, not the losses.
🏆🚀 Thief Trader – Turning Charts into Loot Since Day One! 🏆🚀
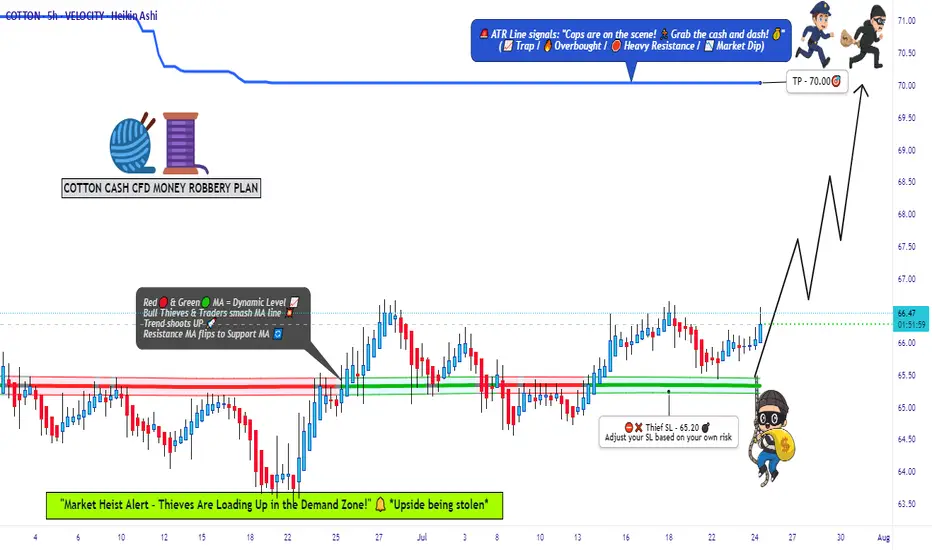
COTTON QUICK TRADE: Low Risk, High Reward Setup!🚨 COTTON HEIST ALERT: Bullish Bank Robbery in Progress! (CFD/Commodity Raid Plan) 🚨
Thief Trader’s Master Loot Strategy – Long Entry, Escape Before the Cops Arrive!
🌟 Greetings, Fellow Market Bandits! 🌟
Hola! Bonjour! Hallo! Marhaba! 🤑💸 Money Makers & Midnight Robbers, it’s time to execute the COTTON COMMODITY HEIST with precision. Based on 🔥Thief Trading Style Analysis🔥, this is your VIP invite to the biggest bullish swipe of the season.
🔓 THE VAULT IS OPEN – ENTRY PLAN (LONG RAID)
📈 "Break the Lock & Loot!"
Ideal Entry: Buy limit orders within 15-30min pullbacks (swing lows/highs).
Pro Thief Move: Layer your entries (DCA-style) for maximum stealth.
Aggressive Robbers: Charge in directly if liquidity is high.
🚨 STOP-LOSS (ESCAPE ROUTE)
🛑 "Hide Your Loot or Get Busted!"
Place SL below the nearest swing low (5H MA @ 65.20).
Adjust based on your risk tolerance & loot size (multiple orders = tighter escape).
🎯 TARGET: CASH OUT BEFORE THE COPS ARRIVE!
🏴☠️ Take Profit Zone: 70.00 (or escape earlier if the market turns shaky!)
Scalpers: Trailing SL = your best ally. Stick to LONG-ONLY quick hits!
Swing Bandits: Ride the wave but don’t get greedy—exit before the pullback trap!
🔥 WHY THIS HEIST WILL WORK (BULLISH CATALYSTS)
🧵 Cotton’s Price Surge Fueled By:
Supply Squeeze (Storage/Inventory Data 📉).
COT Report Shows Big Money Going Long 🏦.
Seasonal Trends + Macro Sentiment Shift ☀️📈.
Intermarket Signals Aligning (Commodity Supercycle?).
(Full analysis? Check the FUNDAMENTALS & KLICKK! 👉🔗)
⚠️ WARNING: NEWS TRAPS & VOLATILITY AHEAD
📰 "Cops (News Events) Can Crash the Party!"
Avoid new trades during high-impact news (liquidity dries up = slippage risk!).
Lock profits with trailing stops—don’t let the market reverse-steal your gains!
💥 BOOST THIS HEIST – STRONGER GANG = MORE LOOT!
💖 "Smash the 👍 LIKE button to support the crew!"
More boosts = more heist plans (next target: OIL? GOLD? STOCKS?).
Daily profit raids await—follow & stay tuned! 🤝
🚀 See you at the escape zone, bandits!💨
🎯 FINAL THIEF TRADER RULE:
"Steal Fast, Exit Faster—No Prison Trades!" 🏃♂️💨
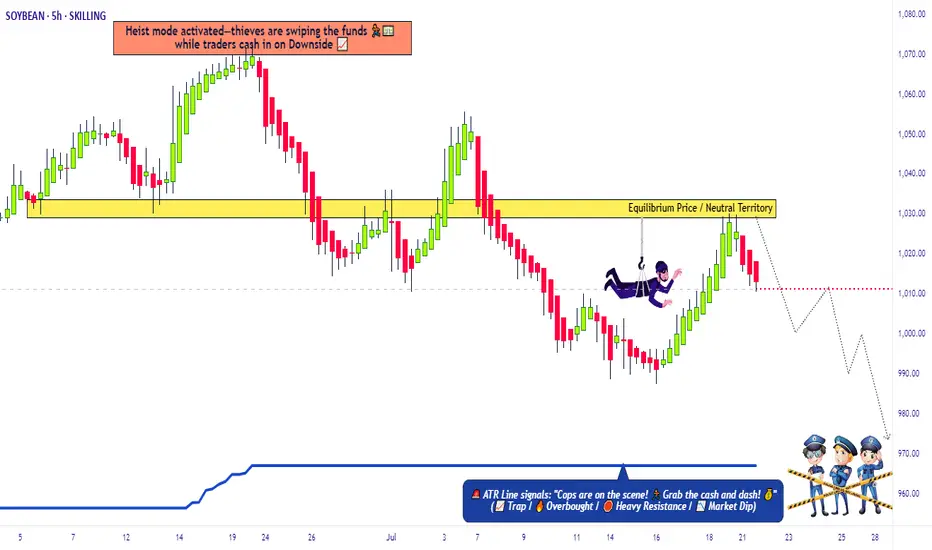
SoyBeans Price Reversal – Time to Swipe Bearish Profits🔓 Operation SoyBeans: Vault Breach Underway! 💼🌾
🌟Hi! Hola! Ola! Bonjour! Hallo! Marhaba!🌟
Calling All Market Bandits, Scalping Buccaneers & Swinging Looters 🕵️♂️💰💣
We've marked our next robbery target—the "SoyBeans" Commodities CFD Market.
This isn’t just a trade, it’s an orchestrated heist built off Thief Trading intelligence: a mix of technical traps, fundamental cues, and criminal market psychology. 🧠💸
🔎 🎯 Entry Point - Where the Safe Cracks Open:
The vault is wide open—grab bearish loot at any price!
But for maximum stealth, layer in buy limit orders on the pullback using the 15m or 30m timeframe near swing highs/lows.
(We thieves call this: DCA under the radar.) 🕳️📉
🛡️ 🚨Stop Loss - Our Escape Hatch:
Set SL at the nearest 4H candle wick swing high (1040.00).
Customize it based on your loot size (lot size), order count, & risk appetite.
A smart thief knows when to vanish! 🏃♂️💨
🏁 💰Target - The Vault Cash-Out Point:
Main Heist Target: 970.00
Or exit early if the cops (volatility) show up! 🚔🎯
💡 Scalper’s Note - Quick Grab & Dash:
If you’ve got a heavy bag 💼💸, scalp short aggressively.
If not, roll with the swing crew—use trailing SLs to lock the loot and flee clean. 💨📦
📉 Thief Insight – Why We're Robbing This Vault:
"SoyBeans" showing bearish breakdowns due to:
📰 COT Positioning
📦 Inventory & Storage Data
🕰️ Seasonal Weakness
💭 Sentiment Drift
🔗 Intermarket Signals
Get the full scoop—go dig deeper into your own thief intelligence sources. 📚🕵️♂️
⚠️ Stay Alert – Market Mayhem Incoming!
News drops = surveillance upgrades. Avoid new trades during major releases.
Protect running loot with tight trailing SLs—guard your stolen goods! 🛑🗞️📉
❤️🔥 Show Some Love to the Robbery Crew!
💥Smash that BOOST button💥 to fuel the Thief Army.
Together, we rob smarter. 💰🚀
🔔 Stay Tuned, Looters:
Another heist is being planned. Don't miss the next setup.
Money is out there… we just have to take it the thief way. 🧠💎
📜 Disclaimer:
This plan is for chart criminals in training 📉🕵️♂️ – not personalized financial advice.
Always assess your own risks before raiding any market vault.