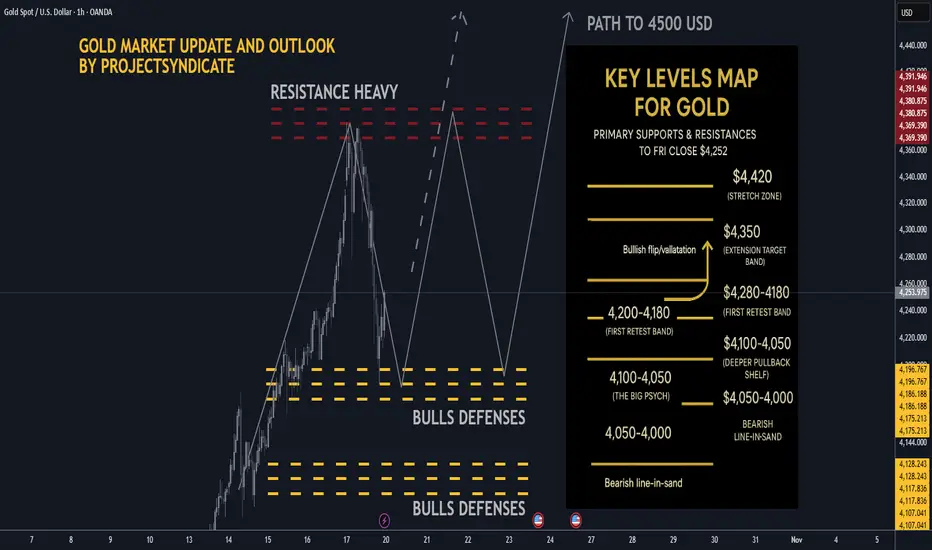
Gold next week: Key S/R Levels and Outlook for Traders🔥 GOLD WEEKLY SNAPSHOT — BY PROJECTSYNDICATE
🏆 High/Close: $4,379 → ~$4,252 — higher close vs. last week’s pullback finish.
📈 Trend: Uptrend intact > $4,000; dip buyers continue to control rhythm.
🛡 Supports: $4,180–$4,140 → $4,100–$4,050 → $4,000 must hold.
🚧 Resistances: $4,260 / $4,300 / $4,350 → stretch $4,380–$4,420.
🧭 Bias next week: Buy-the-dip > $4,140–$4,200; momentum regain targets $4,300–$4,380+. Invalidation < $4,050 → risk $4,000/3,980.
🌍 Macro tailwinds:
• Fed: Markets lean to another cut into Oct 28–29; softer real yields buoy gold.
• FX: DXY under pressure = constructive backdrop.
• Flows: ETF interest & CB buying remain supportive on dips.
• Geopolitics: Tariff/trade and regional risks keep safe-haven bids live.
🎯 Street view: Several houses float $5,000/oz by 2026 scenarios on easing policy & reserve diversification narratives
________________________________________
🔝 Key Resistance Zones
• $4,260–$4,280 near-ATH supply / immediate ceiling from close
• $4,300–$4,350 extension target band
• $4,380–$4,420 stretch zone toward prior spike high and measured extensions
🛡 Support Zones
• $4,220–$4,200 first retest band just below close
• $4,180–$4,140
• $4,100–$4,050 deeper pullback shelf; $4,000 remains the big psych
________________________________________
⚖️ Base Case Scenario
Expect shallow pullbacks into $4,220–$4,140 to be bought, followed by rotation back into the $4,260–$4,300 resistance stack for an ATH retest.
🚀 Breakout Trigger
A sustained push/acceptance > ~$4,280 unlocks $4,300 → $4,350, with room toward $4,380–$4,420 if momentum persists.
💡 Market Drivers
• Fed cut expectations into late Oct(lower real yields = gold tailwind
• USD softness / DXY sub-100 tone supports metals
• Ongoing central-bank bullion demand; ETF inflows stabilizing
• Geopolitics & trade/tariff headlines keeping safety bids active
🔓 Bull / Bear Trigger Lines
• Bullish above: $4,140–$4,200
• Bearish below: $4,100–$4,050 risk expands under $4,000
🧭 Strategy
Accumulate dips above $4,140–$4,200.
On breakout > $4,280, target $4,300–$4,350+. Maintain tight risk under stepped supports; invalidate momentum below $4,050–$4,000.
________________________________________
AI
another incredible read of the market here from the MTOPS AIYet another incredible read of the market here from the MTOPS AI, demonstrating pinpoint accuracy in its latest Bitcoin forecast.
The AI's analysis continues to outperform, capturing crucial shifts and ensuring top-tier results for traders.

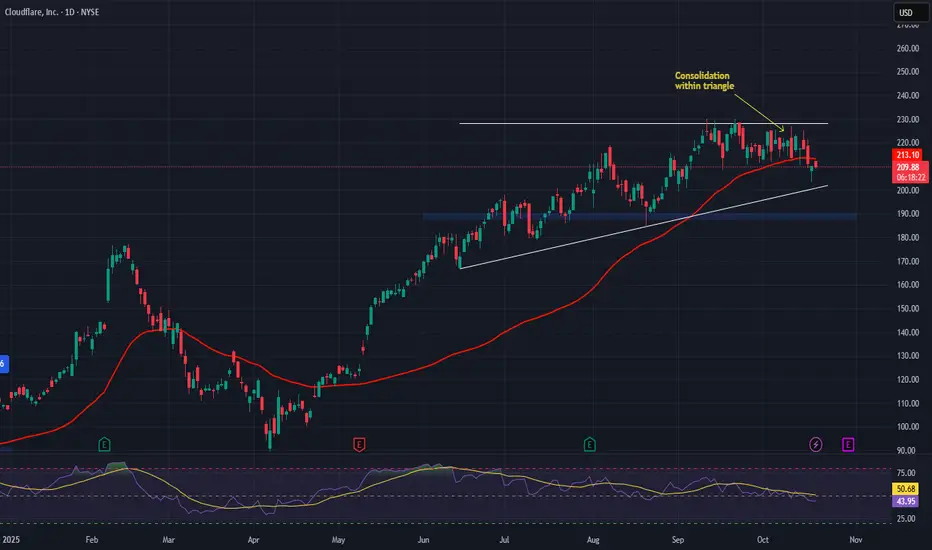
NET — AI Infrastructure Leader Launches Stablecoin InnovationCompany Overview:
Cloudflare, Inc. NYSE:NET is a global leader in cloud connectivity and cybersecurity, delivering secure, scalable, and high-performance infrastructure for the modern internet. The company is evolving into a key enabler of AI-driven applications, with its Workers platform gaining strong enterprise traction to power large-scale intelligent workloads.
Key Catalysts:
Fintech breakthrough: The launch of the NET Dollar stablecoin bridges AI, cloud, and financial infrastructure, enabling automated machine-to-machine (M2M) payments and introducing new recurring revenue models.
Enterprise growth: Added 219 new large customers in Q2 2025, highlighting accelerating adoption and market leadership.
AI ecosystem expansion: Increasing integration of Cloudflare’s edge computing network within enterprise AI frameworks positions it at the core of the next-generation digital economy.
Investment Outlook:
Bullish above: $188–$190
Upside target: $380–$390, supported by AI infrastructure dominance, fintech innovation, and accelerating enterprise demand.
#Cloudflare #AI #Stablecoin #Cybersecurity #Fintech #DigitalInfrastructure #EdgeComputing #Investing #NET
FET Macro flipped long term bearish! Done and dusted?NYSE:FET has disappointed many and continues to be dumped hard. We can see 3 waves up from the very bottom as an ABC followed by a 5 wave structure down that's nearly complete, as weekly RSI hits oversold. No bullish divergence.
The wave 5 structure down resembles a motif wave which means any bullish moves are now corrective and we won't likely see all time highs again but we can still make decent profit.
Once a bottom is found, price should return to $0.6, at least, as counter trend rally / reversion to mean where it may find heavy selling.
Price needs to break $0.84 and find a higher low to flip the structure bullish again, a tough challenge.
Downside 'alt-coin golden pocket' Fibonacci, 0.786 has not been reached yet and is the highest probability area for alts to bottom, $0.13.
Safe trading

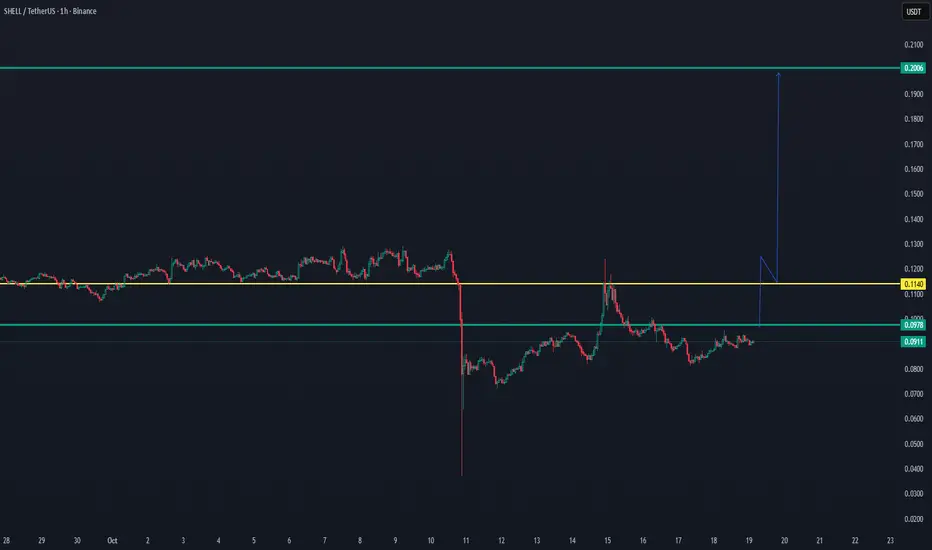
SHELL/USDT — Reclaiming Key Zone, Potential BreakoutThe best DCA coin of the moment for the low cap
SHELL/USDT — Reclaiming Key Zone, Potential Breakout Toward $0.20 🚀
SHELL is currently building momentum near the $0.097–$0.100 zone, after reclaiming short-term structure from its recent drop. This consolidation indicates accumulation, setting the stage for a potential breakout move.
The $0.114 zone remains the key breakout level — a 1H close above it could confirm continuation toward the $0.20 target, aligning with the next major resistance area.
📊 Technical Overview:
Support: $0.090
Breakout Level: $0.114
Main Target: $0.200
Momentum: Recovering with early bullish signals
Once the price confirms above $0.114 with strength, the chart opens a wide “open space” toward the next resistance at $0.20, creating strong potential for a trend expansion.
📈 Bias: Bullish setup forming
🎯 Targets: $0.114 → $0.200
GoDaddy | GDDY | Long at $128.90GoDaddy NYSE:GDDY is the world's largest domain registrar, managing over 84 million domains for over 21 million customers. AI, particularly through GoDaddy's Airo platform and related GenAI tools, is poised to drive outsized growth by supercharging product innovation, customer value, and operational efficiency.
Technical Analysis
The stock has dropped 35% so far in 2025, but this was after a meteoric 208.5% rise from October 2023 to December 2024. The price has now regressed to my selected historical mean - a typical share-accumulation region for algorithmic trading when it comes to high-growth stocks. While this is often a solid area of support, it may dip down to $115 to shakeout retail traders. Obviously, further declines would occur if fundamentals change, but the forward growth is highly attractive, and I doubt it will "crash" from here if the outlook remains positive.
Earnings and Revenue Growth into 2028
Projected earnings-per share growth between 2025 ($5.98) and 2028 ($11.12): 86.0% (AI effect...)
Projected revenue growth between 2025 ($4.92 billion) and 2028 ($6.19 billion): 25.8%
Current P/E: 22x (remaining tech sector: 45.7x)
www.tradingview.com
Insiders
Warning: Lots of insider selling and no recent buying.
openinsider.com
Health
Debt-to-equity: 9x (very high, but due to aggressive share repurchases rather than distress)
Cash flow remains a bull case cornerstone, with accelerating free cash flow conversion (>100% of EBITDA) underscoring operational leverage from AI efficiencies and premium customer shifts.
Action
GoDaddy NYSE:GDDY is a prominent name and leader in domain registration. As AI enhancements lead to improvements in operational margins, earnings are likely to grow tremendously into 2028. Once agentic AI search enters the scene, it will be very interesting to better understand the importance of such a domain registration company for its successful implementation. While the price may dip beyond the historical mean to shakeout some retail traders, I think the future of this currently undervalued, high-growth company into 2028 is very bullish. Thus, at $128.90, NYSE:GDDY is in a buy-zone with potential near-term risk between $100 and $115.
Targets into 2028
$160.00 (+24.1%)
$200.00 (+55.2%)

DOWNTREND CONTINUES - Sorry Twitter, I was rightDowntrend continues as forecasted 5 days ago
MTOPS calls the markets well ahead of time with highest levels of accuracy

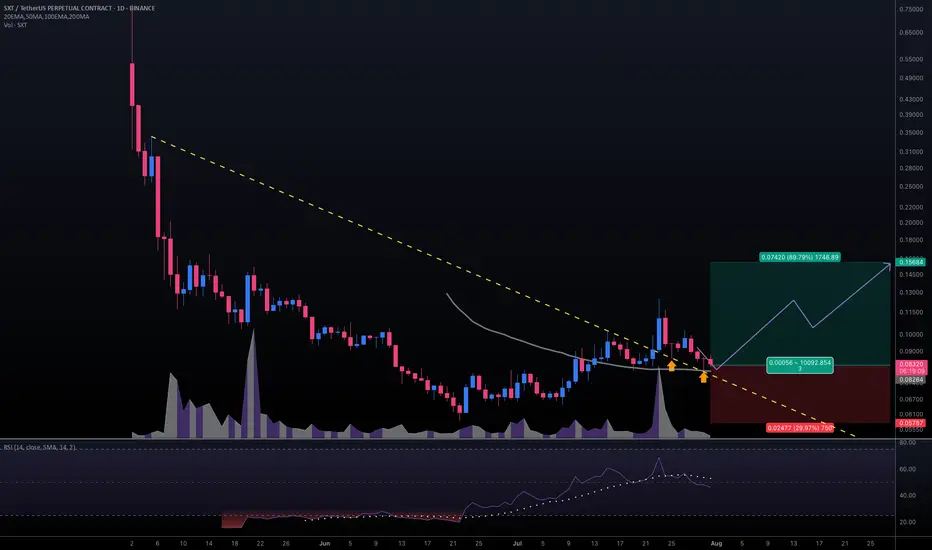
#SXTUSDT #1D (Binance Futures) Descending trendline break retestSpace and Time (SXT) pulled back to 50MA daily support, looks ready for mid-term recovery after those two dragonfly dojis in a row.
⚡️⚡️ #SXT/USDT ⚡️⚡️
Exchanges: Binance Futures
Signal Type: Regular (Long)
Leverage: Isolated (2.0X)
Amount: 5.0%
Entry Targets:
1) 0.08264
Take-Profit Targets:
1) 0.15684
Stop Targets:
1) 0.05787
Published By: @Zblaba
NYSE:SXT BINANCE:SXTUSDT.P #1D #SpaceAndTime #ZK #AI #DPoS spaceandtime.io
Risk/Reward= 1:3.0
Expected Profit= +179.6%
Possible Loss= -59.9%
Estimated Gaintime= 1 month
Ah ha! I found the right one. Changing good into great!!I have coded many AI models from scratch to ensure we have the best tech available
Although my favorite model did really well, the tail end of the forecast could have been better
So I went to the 'Mixture of Experts' model and saw it had the correct forecast. PHEW!!
GREATNESS REMAINS!

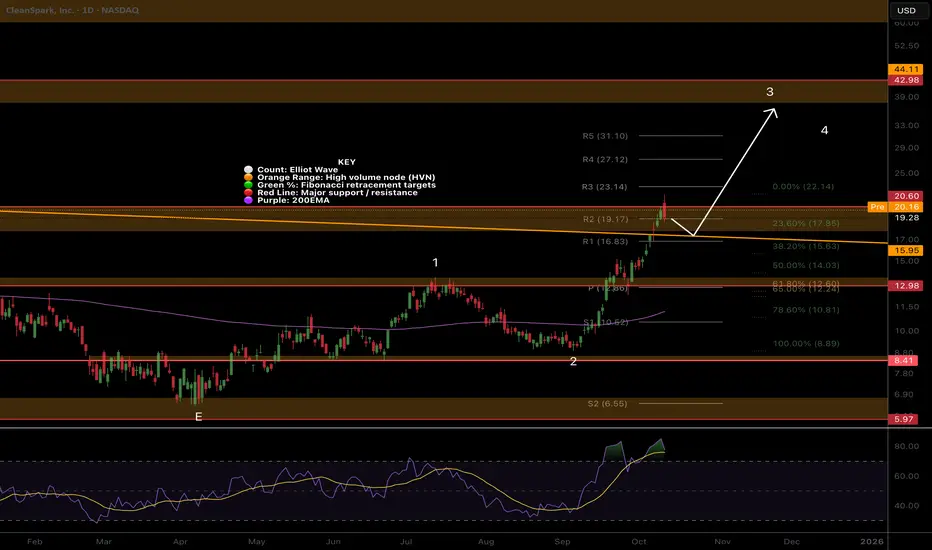
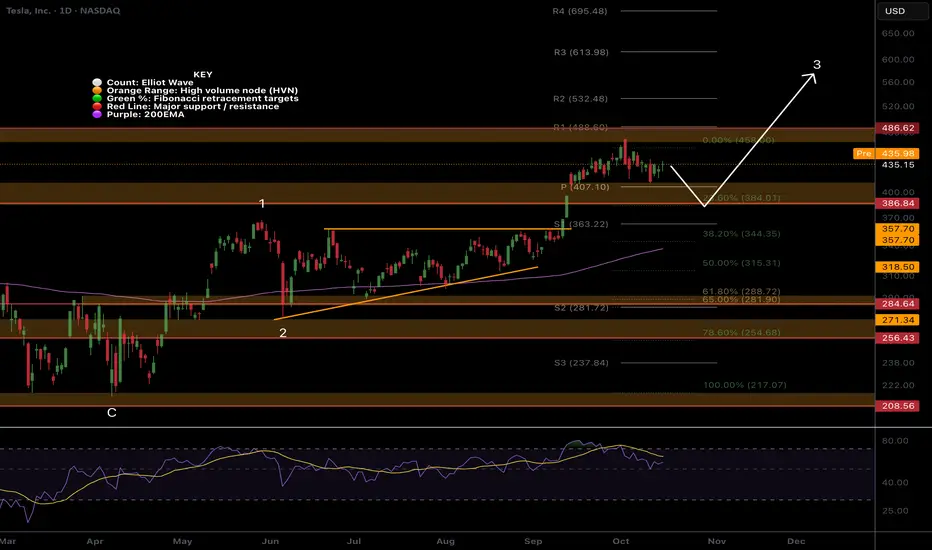
TSLA looks ready for higher in wave 3NASDAQ:TSLA found resistance at the all time High Volume Node and is trapped between that and the high volume support node.
The trend is up and strong. above the daily pivot and daily 200EMA with width.
I expect price to find support and continue into price discovery.
Safe trading
RIOT wave 3 continues, $57 min targetWave 3 continues in NASDAQ:RIOT per previous posts with a minimum target of the $57 High Volume Node

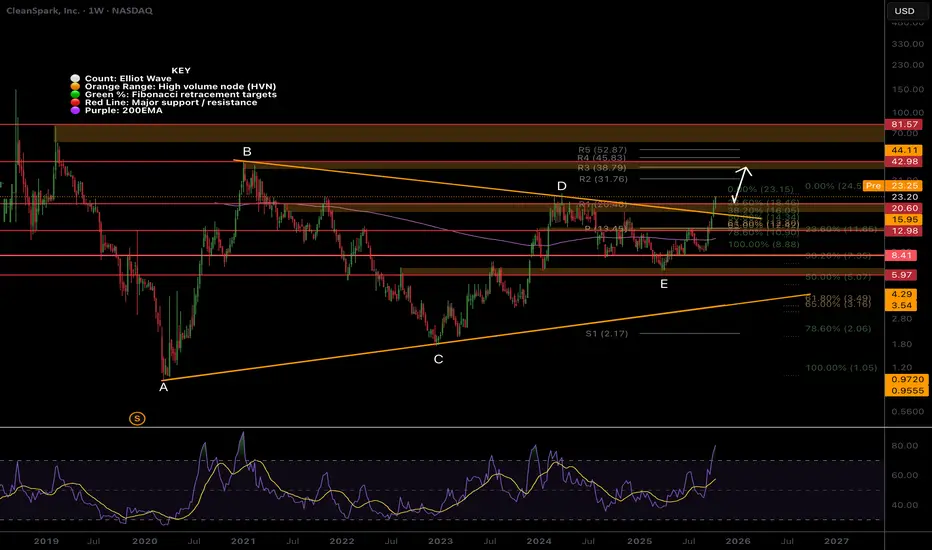
CLSK Almost confirmed huge macro triangle breakout signal!NASDAQ:CLSK Should hit the wave D high today signalling the macro triangle breakout is ready to really move!
Nothing more to add.. send it!
Safe trading
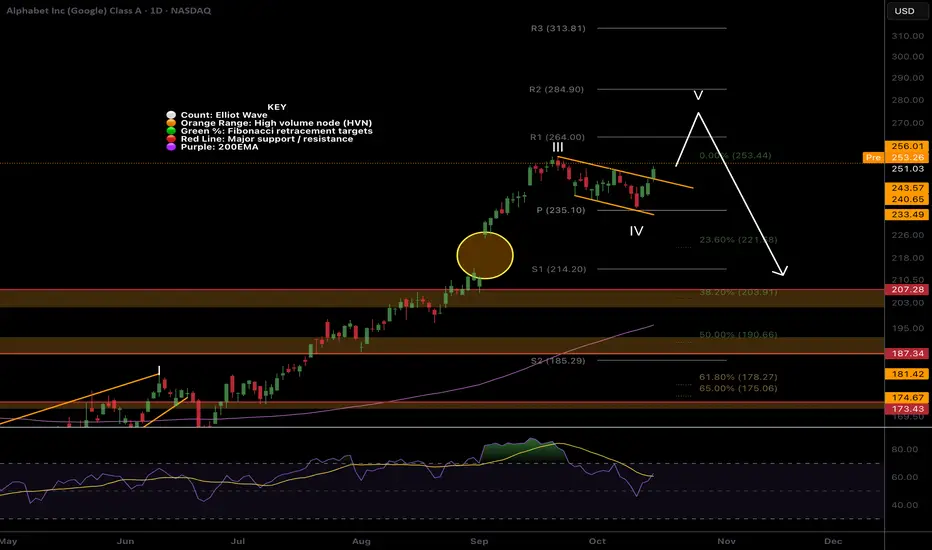
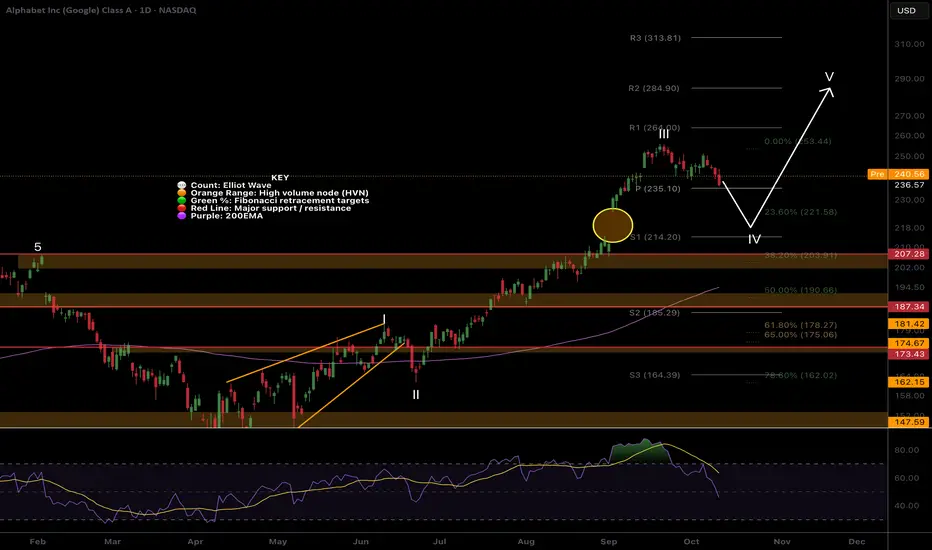
Google ready for higher!I am liking the look of NASDAQ:GOOG for another push to all time high before lower to complete macro elliot wave 3.
Wave 4 has typical target of the 0.382 Fibonacci retracement which sits at the previous all time high and also fils the gap left and meets the daily 200EMA! Lots of confluence and ill be buying here if we get it.
Daily Rsi has crossed bullishly from below the EQ.
Safe trading
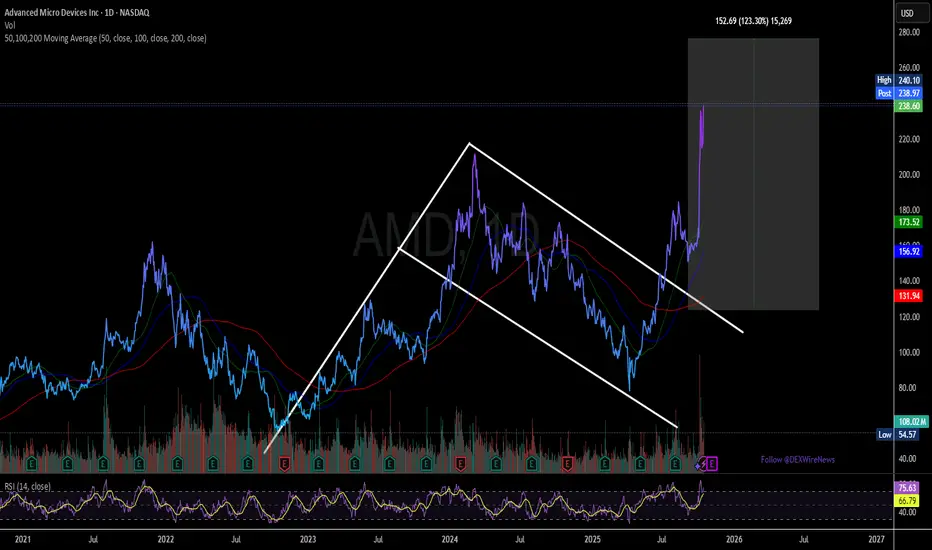
Advanced Micro Devices Stock Broke Out of a Bullish Flag TodayThe price of Advanced Micro Devices, Inc. (NASDAQ: NASDAQ:AMD ) has broken out of a falling wedge pattern gaining roughly 9% today. With the daily price chart showing a golden cross pattern the stock is poised to reach the $270 pivot and beyond amidst growing interest.
The surge reflects recent optimism about AMD’s expanding role in the AI chip market, fueled by new partnerships, including a significant deal to supply chips to Oracle’s cloud infrastructure and collaborations with AI leaders like OpenAI.
Moreover, the investors’ confidence is also boosted by recent positive commentary by analysts, who also raised their price targets on AMD stock.
About Advanced Micro Devices, Inc.
It operates in three segments: Data Center, Client and Gaming, and Embedded. The company offers artificial intelligence (AI) accelerators, x86 microprocessors, and graphics processing units (GPUs) as standalone devices or as incorporated into accelerated processing units, chipsets, and data center and professional GPUs; and embedded processors and semi-custom system-on-chip (SoC) products, microprocessor and SoC development services and technology, data processing units, field programmable gate arrays (FPGA), system on modules, smart network interface cards, and adaptive SoC products.
$FET bullish momentumHey traders!
It’s been a while since we last talked. This time I bring you my thoughts about FETCH.AI ( NYSE:FET ). Since all the tariff and deepseek staff its mcap valuation decreased significantly.
In my opinion, as it shown us some strenght "jumping" from 0,3$ and consolidating for almost 4 months on 0,6 - 0,9 (50% retracement from its local high) range I think it's a good opportunity to see an expansion movement.
In addition, chartism shows a clear ABC correction movement that has already finished. In my opinion ( ONLY MY OPINION NOT A FINANCIAL ADVICE) we could see a potential impulsive movement on Sept - October.
My targets -> 1,5 - 2,5 - ATH.
Stay safe!

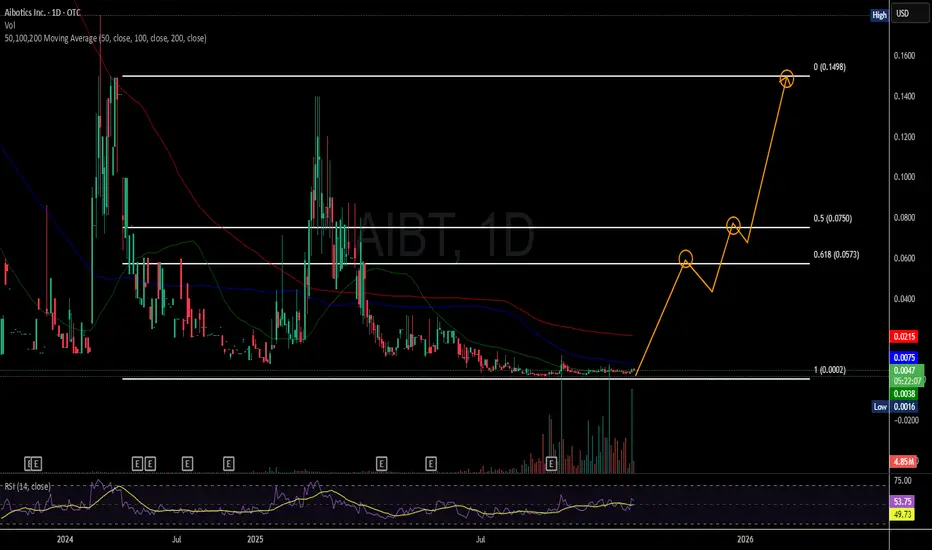
Aibotics (OTC: $AIBT) Is Gearing For A Breakout- (Sponsored)The price of this AI and Robotics stock is gearing for a bullish breakout amidst breaking put from a long term falling wedge pattern.
OTC:AIBT stock has already spike almost 60% in yesterdays trading session, with the RSI at 56 Aibotics stock is poised to surge almost 3000% with increase interest in its new massage robot.
With an intraday market cap of $990k, Aibotics stock is pretty much early. Should the stock break the ceiling of the 61.5% Fib level, bullish breakout is inevitable.
About Aibotics
Aibotics Inc., together with its subsidiaries, engages in the study of psychedelics for the treatment of mental health issues in the United States.
It provides psychedelic methodologies for the treatment of palliative care, depression, and anxiety. The company was formerly known as Mycotopia Therapies, Inc. and changed its name to Aibotics Inc. in February 2025 Aibotics Inc. is based in Miami, Florida.
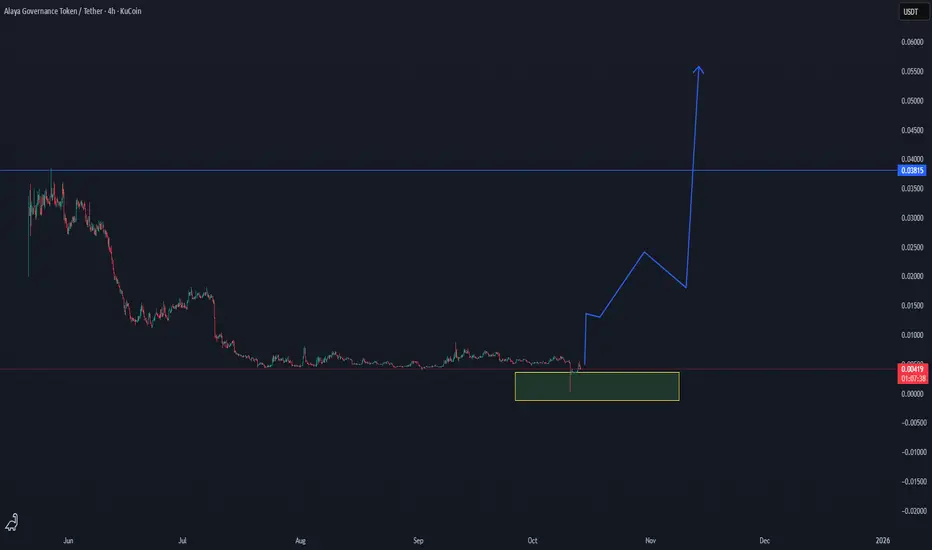
AGT/USDT — Breakout Formation from Accumulation Zone ImminentAGT/USDT — Breakout Formation from Accumulation Zone Imminent 🚀
AGT has entered a strong accumulation zone after a prolonged downtrend, showing the first technical signs of a potential trend reversal. The current consolidation within the highlighted support block suggests that buyers are stepping in, preparing for a possible breakout phase.
Low time frame confirmation is here
📊 Current Price: $0.0042
🟢 Accumulation Zone: $0.0038 – $0.0045
🔹 Breakout Target: $0.038
The chart shows a typical bottoming structure, with a long accumulation base forming under historical resistance. Once AGT confirms a breakout above $0.006, momentum could accelerate rapidly — targeting the $0.02 → $0.038 zones.
This setup mirrors classic early-cycle patterns seen before major upward expansions in similar low-cap assets. A strong breakout candle with volume will serve as confirmation of the next phase.
📈 Technical Outlook:
Accumulation structure in place
Breakout trigger above $0.006–$0.007
Main breakout target around $0.038
Summary:
AGT/USDT is building strength at the bottom of its range. If volume confirms, a major reversal cycle could be underway, opening the path toward a breakout to $0.038 and beyond.
🎯 Targets: $0.02 → $0.038
📊 Bias: Bullish — Breakout Setup Forming
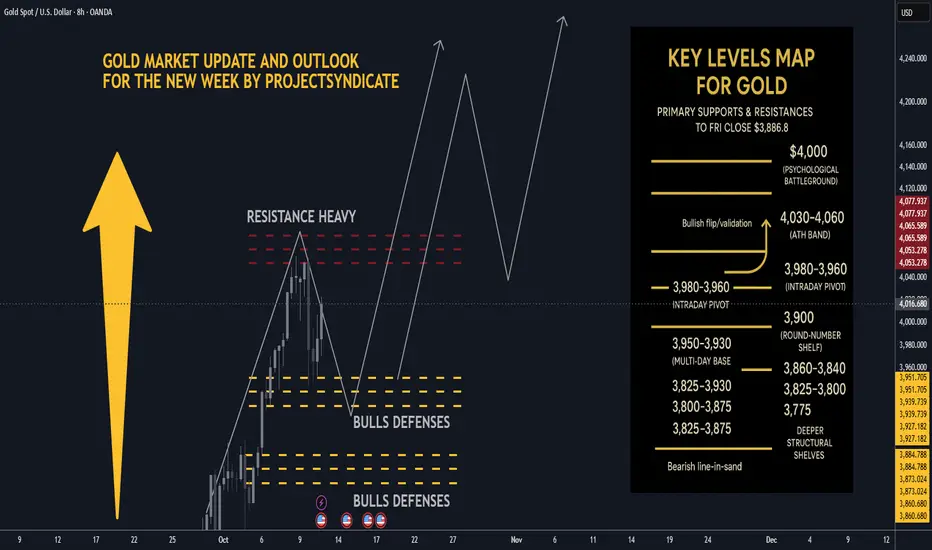
Gold next week: Key S/R Levels and Outlook for Traders🏆 Friday’s Close & Recent ATH:
Gold XAUUSD closed Friday around ~$3,990–$4,020/oz depending on venue most consolidated feeds show prints near $3.99–$4.02k at Friday close. The nearest recent intraday highs printed in the $4,030–$4,060 area across data providers this week, putting $4,000 as the immediate psychological battleground and $4,050–$4,060 as the latest short-term ATH band. YTD performance remains extraordinary 2025 YTD still showing a very large gain.
📈 Trend Structure:
Price continues to track a well-defined ascending channel on 1H/4H with clear impulsive legs out of recent consolidations. Market character = higher highs / higher lows, persistent dip-buying, and strong trend adherence into quarter-turn 25/50 handles near round thousands. Momentum has been resilient into week-end despite tariff headlines, suggesting structural demand and participation from official buyers.
🔑 Key Resistance Levels:
The most critical resistances to watch updated from Friday close ≈ $4,000:
• 4000 — immediate psychological round-number battleground.
• 4,030–4,060 — recent intraday ATH band / short-term supply recent highs printed here across venues.
• 4,075 → 4,100 — measured move / extension band if acceptance above the ATH zone occurs.
• 4,150–4,200 — stretch momentum targets on sustained risk-off and break/acceptance above 4,100 structural extension.
Quick note: different data vendors quote small differences in ticks — I used consolidated high prints to identify the ATH band.
🛡️ Support Zones:
Immediate supports step down as follows
• 3,980–3,960 intraday pivot just under Friday close.
• 3,950–3,930 multi-day base / near-week lows.
• 3,900–3,888 round-number shelf and the prior week’s consolidation band.
• Deeper structural shelves: 3,860–3,840, 3,825, 3,800 → 3,775.
A sustained break below ~3,900–3,888 would signal increasing corrective risk; daily close under ~3,825 would more clearly shift the regime.
⚖️ Likely Scenarios:
• Scenario 1 Base Case – Controlled dip toward 3,950–3,930 or the 3,900 area to reload bids, then rotation higher toward 4,030–4,060 as buyers re-engage.
• Scenario 2 Momentum Break – Quick clearance of the 4,030–4,060 ATH band → sustained acceptance above 4,075–4,100, unleashing momentum into 4,150–4,200. Overbought readings exist intraday, but structural demand has kept pullbacks shallow.
📊 Short-Term Targets:
On continuation: 4,020 → 4,030–4,060 → 4,075 → 4,100, with 4,150–4,200 as higher extensions if acceptance holds.
On retrace: 3,980 → 3,950 → 3,930 → 3,900 as the key retrace ladder.
💡 Market Sentiment Drivers updated:
• Tariff shock / geopolitical risk: President Trump announced proposals for large new tariffs reports of a 100% tariff threat and expanded export controls on Chinese imports this week, escalating trade-war risk and knocking risk sentiment — that increases safe-haven demand for gold. News outlets Reuters, AP, WaPo and market reactions were visible Friday.
• Rate & policy expectations: Markets continue to price material odds of rate easing/softer Fed path relative to earlier in the year; that reduces real yields and supports gold. Feeds and FedWatch implied pricing show elevated cut odds that underpin lower opportunity cost for gold.
• Official demand: Central bank buying has remained constructive — WGC/official stats show continued net purchases in recent months monthly buying rebounded in August. This adds structural support to dips.
• Macro/flow: Risk-off from tariff headlines, rare-earth export controls, and supply-chain concerns are the immediate drivers that could catalyze pushes toward the ATH band.
🔄 Retracement Outlook:
A tag of 3,950–3,930 or a short stop-run into 3,900–3,888 would be a typical healthy pullback inside the trend. Fast reclaim of the first support band after a liquidity flush often precedes fresh ATH tests. Breaks under 3,900 that fail to reclaim quickly increase the probability of a deeper slide into the 3,860–3,825 shelf.
🧭 Risk Levels to Watch:
• Bullish structure intact: holding above ~3,950–3,930 or more conservatively, above 3,900 keeps the bull case intact.
• Bearish line-in-sand: daily close < 3,825 weakens trend; daily close < 3,775–3,750 signals a bigger corrective phase and opens lower targets.
🚀 Overall Weekly Outlook:
Gold remains in a strong uptrend with $4,020–$4,030/ATH band $4,030–$4,060 → $4,000 as the immediate battleground after Friday’s close. Expect buyable dips while supports hold; the topside roadmap favors 4,075–4,100 and 4,150–4,200 as measured extensions if the market digests tariff news into a longer-running risk-off regime.
Gold Bull Markets Long Term Overview and 2025 Market UpdateGold Bull Markets Long Term Overview and 2025 Market Update
________________________________________
• This cycle is different: record central-bank buying + renewed ETF inflows + lower real rates = powerful tailwind.
• Price: Gold notched fresh ATHs this month (up to $3,790.82). 2025 is shaping up as the strongest year since the late 1970s.
• Relative: Gold is crushing equities YTD (≈+40% vs S&P 500 ≈+13% total return).
• Setup: A 13-year “cup-and-handle” breakout in 2024 kick-started the move.
• Outlook: Base case from the Street: $3,700 by end-’25 and ~$4,000 by mid-’26; upside to $4,500 if flows accelerate.
________________________________________
🏆 Historic Gold Bull Markets — Timeline & Stats
1) 1968–1980 “Super Bull”
• Start/End: ~$35 → $850 (Jan 1980)
• Gain: ~2,330%
• Drivers: End of Bretton Woods, oil shocks, double-digit inflation, geopolitical stress.
• Drawdown: ~–45% (1974–1976) before the final blow-off run.
2) 1999–2011/12
• Start/Peak: ~$252 (1999) → ~$1,920 (2011–12)
• Gain: ~650%
• Drivers: Commodities supercycle, EM demand, USD weakness, GFC safe-haven bid.
3) 2016/2018–Present (The “CB-Led” Cycle)
• Start Zone: $1,050–$1,200 → New ATH $3,790 (Sep 2025)
• Gain: ~215–260% (depending on 2016 vs 2018 anchor)
• Drivers: Record central-bank accumulation, sticky inflation/low real rates, geopolitics; 2024 13-yr base breakout.
________________________________________
📊 At-A-Glance Comparison (Updated 2025)
Metric 1968–80 Super Bull 1999–2012 2016/18–2025 Current
🚀 Total Gain ~2,330% ~650% ~215–260% (so far)
⏲️ Duration 12 yrs 13 yrs 7–9 yrs (ongoing)
💔 Max Drawdown ~–45% (’74–’76) ~–30% (’08) ~–20% (2022)
🏦 Main Buyer Retail/Europe Funds/EM Central Banks (dominant)
🏛️ Pattern Secular parabolic Cyclical ramps 13-yr base → breakout (’24)
Notes: current cycle characteristics validated by WGC demand trends & technical breakout in Mar 2024.
________________________________________
📈 Top 10 Stats of the Current Bull (2025)
1. Price & ATHs: Spot $3,75–$3,79k; fresh ATH $3,790.82 on Sep 23, 2025.
2. 2025 YTD: Roughly +40–43% YTD (best since the late ’70s).
3. Central Banks: 1,045 t added in 2024 (3rd straight 1k+ year). H1’25 ≈ 415 t (still elevated).
4. ETF Flows: Strongest half-year inflows since 2020, aiding the surge.
5. Gold vs Equities: Gold ≈+40% vs S&P 500 ≈+13% total return YTD.
6. Jewelry Demand: Price strength is crimping tonnage (2024 down ~11%; Q2’25 –14% y/y), even as value hits records.
7. Gold–Silver Ratio: Now around ~85–88 (silver catching up as it pushes $43–$44).
8. Macro Link: Strong safe-haven bid + rate-cut hopes supporting new highs.
9. Technical: Confirmed cup-and-handle breakout (Mar ’24) underpinning trend.
10. Street Forecasts: DB lifts 2026 to $4,000; GS baseline $4,000 by mid-’26, upside $4,500 with bigger private-investor rotation.
________________________________________
🔄 What Makes This Bull Different (2025 Edition)
• 🏦 Central-Bank Dominance — Official sector is the anchor buyer (3rd straight 1k+ tonne year in 2024; 2025 tracking strong despite Q2 deceleration).
• ⚡ Faster Recoveries — Pullbacks have been shallower and shorter vs the 1970s analog.
• 📈 Coexisting With Risk Assets — Rare combo: gold ATHs with equities up YTD suggests a macro hedge bid alongside optimism in select risk assets.
• 📐 Structural Breakout — The 13-year base cleared in 2024 set multi-year targets.
________________________________________
🎯 Strategy Ideas (2025 & Beyond)
Core
• Buy/Hold on Dips: Stagger entries (DCA) into physical (allocated), ETFs (e.g., GLD/IAU), and quality miners/royalties.
• Prefer Physical/Allocated where counterparty risk matters; use ETFs for liquidity.
Satellite/Leverage
• Silver & GSR Mean-Reversion: With the GSR ~85–88, silver historically offers torque in up-legs. Pair with high-quality silver miners.
• Factor Tilt in Miners: Focus on low AISC, strong balance sheets, growing reserves, and jurisdictions with rule-of-law.
Risk-Management
• Define max drawdown tolerance per sleeve; pre-plan trims near parabolic extensions or if macro invalidates (e.g., real-yield spike).
________________________________________
🧪 Reality Check: What Could Invalidate the Bull?
• Real yields + USD rip higher (sustained), dampening non-yielding assets.
• Sharp halt in official-sector buying (e.g., policy shifts).
• Rapid growth re-acceleration reducing safe-haven & rate-cut expectations.
________________________________________
🧭 Quick Reference Tables
🧾 Summary: Historic vs Current
Feature 1968–80 1999–2012 2016/18–2025
Total Gain ~2,330% ~650% ~215–260%
Duration 12 yrs 13 yrs 7–9 yrs (ongoing)
Correction ~–45% ~–30% ~–20% (’22)
Main Buyer Retail/Europe Funds/EM Central Banks
Pattern Parabolic Cyclical Cup & Handle → Secular
🧩 “If-This-Then-That” Playbook
• If real yields fall & CB buying persists → Ride trend / add on consolidations.
• If USD + real yields jump → Trim beta, keep core hedge.
• If GSR stays >80 with silver momentum → Overweight silver sleeve for torque.
________________________________________
🧠 Outside-the-Box Adds
💼 Role in a Portfolio (example frameworks)
• Resilience sleeve (5–10%): Physical + broad ETF.
• Offense sleeve (2–5%): Quality miners/royalties; optional silver tilt.
• Tactical (0–3%): Trend-following overlay (breakouts/consolidations).
🧭 Decision Checkpoints (quarterly)
• Central-bank net purchases (WGC).
• ETF flows (Western markets).
• Real yields (10y TIPS), USD trend, and GSR.
________________________________________
🔚 Key Takeaways (Updated)
• Relentless official-sector demand + technical breakout are the twin pillars of this cycle.
• Macro mix (policy easing expectations, geopolitics, diversification from USD reserves) supports an extended run.
• Base case: Street sees $3.7k by end-’25 and ~$4k by mid-’26, with upside to $4.5k if private capital rotation accelerates. Manage risk; embrace volatility.

Google Gap fill + wave 4?Google has had a great run into price discovery in wave III uptrend but now appears exhausted and ready for a short term pullback setting up new signals.
The gap looks likely to be filled as coinciding the wave IV Fibonacci targets and the S1 daily pivot.
RSI is making its way into oversold with plenty of room to fall. Price may fal as far as the 0.382 Fibonacci and retest the previous all time high!
Safe trading
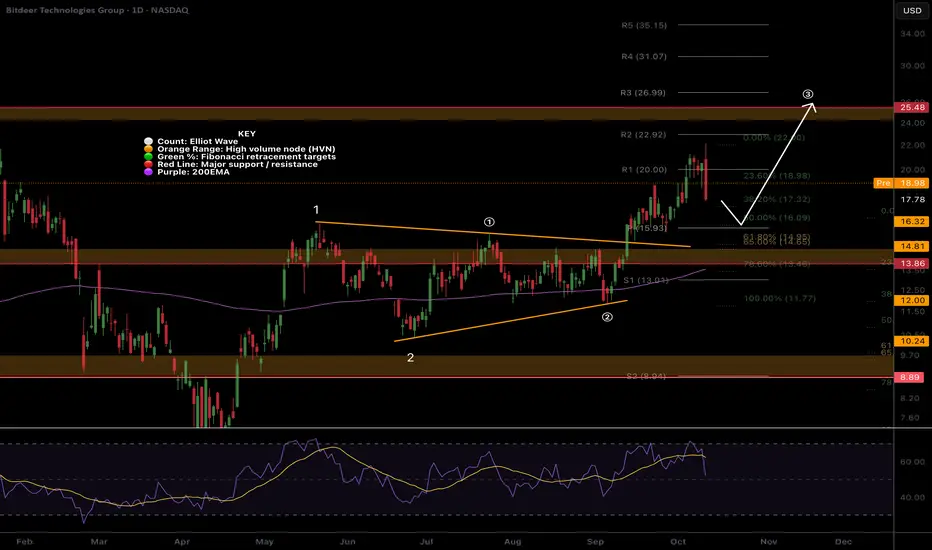
BTDR Volatile, but uptrend intactNASDAQ:BTDR had a huge bearish engulfing candle Friday. I keep my positions smaller on these assets.
Price is still in a wave 3 breakout towards the $25 High Volume Node target. It appears wave (1) of 3 is complete with a wave (2) target of the daily pivot and 0.5 Fibonacci or golden pocket zone nearby. That would also test the untested wave 1 high as support a highly likely event.
RSI has reset to the EQ where it often finds support in a strong uptrend.
Safe trading
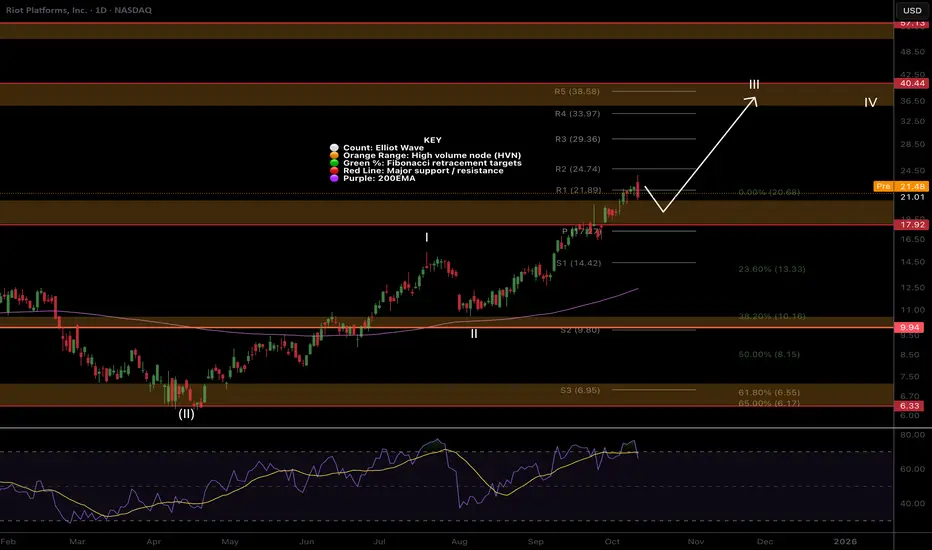
RIOT.. Nothing changed, $40 targetNASDAQ:RIOT broke out through resistance earlier than expected! A retest of the High Volume Node as support is highly likely event and price has a little down to go to get there. It may even be front run today.
RSI is overbought with no bearish divergence and can persist here for months in trending asset.
Wave II is underway and the next target is $40 High Volume Node resistance and the R5 daily pivot.
Safe trading
CLSK Rejected at thr major resistance, higher to go CLSK hit our first take profit target at the major resistance High Volume Node but has broken out of the macro triangle structure hinting at a big move still to come! Nothing concerning for me yet happening.
Wave 3 is underway to a minimum target of the $40 High Volume Node
RSI is overbought but no divergence and this can persist up here for months.
Safe trading