New AI Forecast - can it get the next moves correct after FridayIt's an interesting time on the markets after a massive Friday.
At this point the human's mind could argue anything could happen..
I'm really interested to witness whether the AI can get it right again (5/5 correct) as these are unfamiliar structures to both us and the AI. We just survived the biggest liquidation in history...can it get the next moves correct after something like that
AI

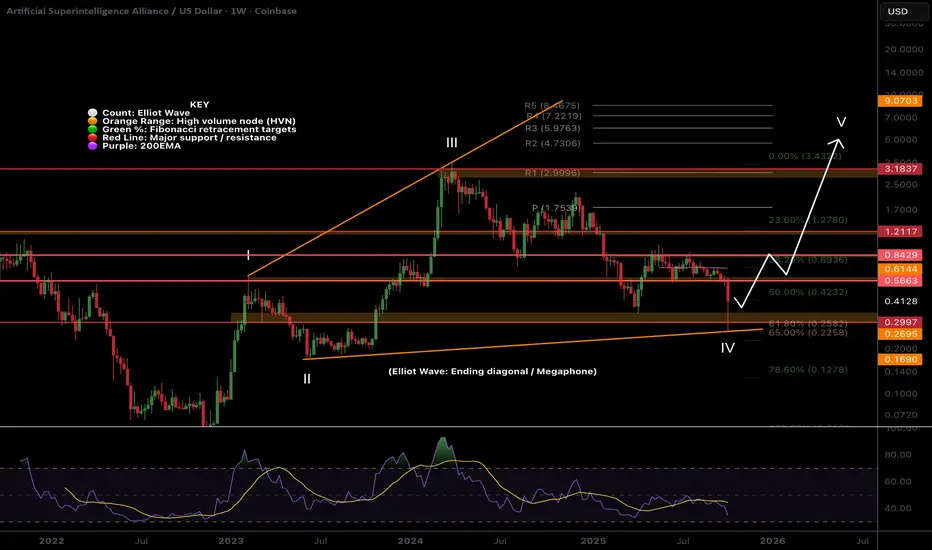
FET extreme opportunity zone!NYSE:FET wave IV megaphone pattern is still in play despite the lower low and is invalidated only if we get blow wave II at $0.1685. This is a complex Elliot wave structure where investors and traders get trapped easily!
Weekly RSI now has bullish divergence forming but is not yet confirmed. Price found support at the major High Volume Node and Fibonacci Golden Pocket, a high probability reversal area!
Wave V has an expected target of the R2 weekly pivot at $4.73 but can over-extend in an exuberant market conditions.
Fetch had one of the largest runs last year offering a 56x from a swing below the SD-3 green opportunity band zone. When an asset moves with such momentum to the SD+3 threshold (where it is expected to spend <1% of the time) momentum is found in the opposite direction and gives way to extreme undervaluation! This is were we strike!
Price has now reached the opportunity green band zone once more quickly catching a bid of 20% as of writing. Price is expected to spend <5% of the time in this zone offering investors a short window of opportunity. It can go lower of course but there is a good chance a bottom is formed in this area! I intend to buy here and I am looking out for longs which give me larger position size than buy and hold due to the nature of the risk management.
Price targets for fair value, where we expect price to return to at least, is currently at $0.60. Another irrational alt-season with backed momentum could see a new all time high towards the $5 range and I will take profits at each band threshold along the way!
Bittensor (TAO): Undervalued AI Crypto Gem Amid #Crypto Revival?Bittensor (TAO): Undervalued AI Crypto Gem Amid #Crypto Revival? $600+ in Sight? 📈
At $316.43 (+1.5%), TAO's market cap of $3.03B undervalues its DeAI ecosystem, with FDV at $6.62B hinting at growth—could #AI and #Crypto trends push it toward Bitcoin-like status? 🚀
**Fundamental Analysis**
With circulating supply of 9.6M and total 21M, TAO powers decentralized AI compute; undervalued per community sentiment, positives include modular AI infrastructure, though early-stage risks persist.
- **Positive:** Strong ecosystem partnerships (e.g., Google Cloud); bullish community sentiment.
- **Negative:** High volatility typical of altcoins; limited mainstream adoption yet.
**SWOT Analysis**
**Strengths:** Pioneering AI-blockchain fusion; capped supply scarcity.
**Weaknesses:** Dependency on AI hype; technical complexity.
**Opportunities:** Expanding DeAI use cases; listings on major exchanges.
**Threats:** Regulatory scrutiny on crypto; competition from centralized AI.
**Technical Analysis**
Chart exhibits strong uptrend with recent 7.2% weekly gain. Price: $316.43, VWAP N/A for crypto.
Key indicators:
- RSI: 60 (bullish, not overextended).
- MACD: Positive, confirming upward momentum.
- Moving Averages: 50-day at $300 (support hold), 200-day at $250 (long bull trend).
Support/Resistance: Support at $310, resistance at $320. Patterns/Momentum: Breakout from consolidation, momentum favoring bulls. 📈 Bullish | ⚠️ Bearish.
**Scenarios and Risk Management**
- **Bullish:** Surge above $320, DCA in for scaled entry amid #AI buzz.
- **Bearish:** Retreat to $310 on market dips, trim holdings.
- **Neutral:** Hover around current levels pending news.
Risk Tips: Stops at 10% drawdown, risk no more than 1% portfolio, diversify crypto holdings, DCA to average volatility. ⚠️
**Conclusion/Outlook**
Bullish if #Crypto and #AI converge. Watch exchange listings. Fits innovative theme with upside. Take? Comment!

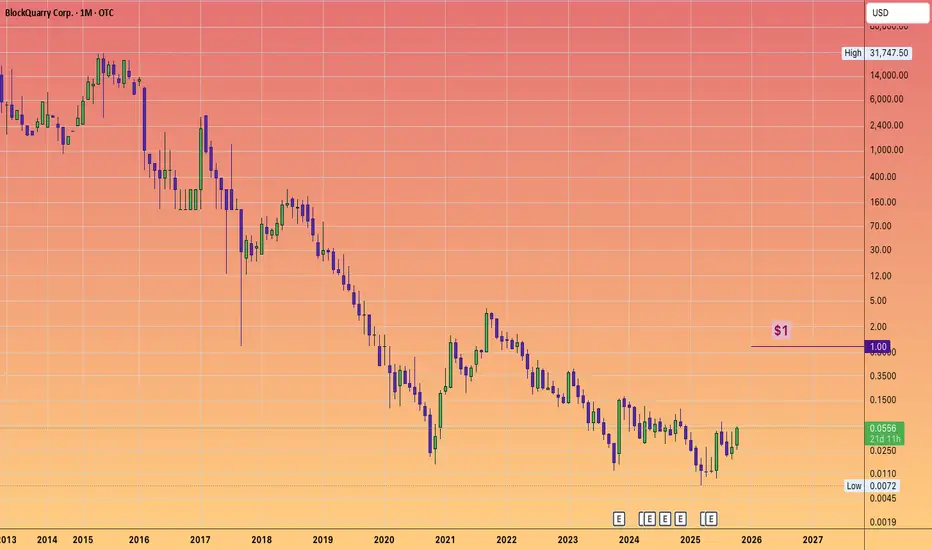
$BLQC Pink sheet stock can 20X --- BLOCKQUARRY CORP.What is it?
BLockQuarry has transitioned from pure #Crypto mining to advanced #AI data storage and HPC, tapping into high growth industries projected to reach $190 Billion for AI and $110B for HPC in the next several years.
The firm is leveraging state of the art data centers and infrastructure upgrades, focusing on scalable solutions for industries like Healthcare, finance and retail.
Financial Analyst forecasts:
Analysts have an average price target of $1.06 to $1.72 by late 2025!
Improved operational stability and freeing resources for expansion and debt reduction. A strengthened leadership team and new CEO with expertise in digital assets and operational growth in AI and HPC.
It's proprietary product BLQCBuster a US manufactured ASIC Bitcoin, features a modular chip architecture that enables superior mining capability per node. Which is meant to advance both performance and supply chain independence.
13, here we comeLooks bullish and can hit 13. It may have massive pullbacks before it hits 13. Play safe and diversify.
Not a financial advise.

Plug - Hear me outProposing a trade on a shit-co like plug may earn some laughs but hear me out for a second.
In the right light and with enough alcohol, she could pass for a strong six. I'd do her.
Jokes, aside, due to the frantic rush to solve AI datacenter energy problem, power companies have been getting a lot of play lately, some have real growth potential, while others may be the speculative dream of degenerates like myself.
A 25 year old company, about to hit the figurative wall (DiCapiro joke...slaps knee), has suddenly seen an influx of buying activity and what looks to be increasing volume following a look below and fail of a weekly box.
According to box rules, I can't ignore this trade. Plug has been in an area of consolidation for years. It's completed atleast two look above and look below and fails of the larger boxed range.
I'm not saying that this stock is going to the moon, but if It can reclaim the top of the mini weekly box and hold the midpoint of the larger box then $8 seems like a realistic target to me.
Now, this stock would easily revert back to the volume point of control (VPOC) around $2 or lbaf again or simply fail miserably below the boxes...then all you degens will be living in boxes.
If we do see 2.50 - $2 again, I'd love to take an entry there (a lbaf of vpoc would be nice too). Otherwise, I'll be monitor this name for the mentioned trades.
My posts are for shits and giggles. I'm just a guy with an interest and a celcius addiction.
~The Villain

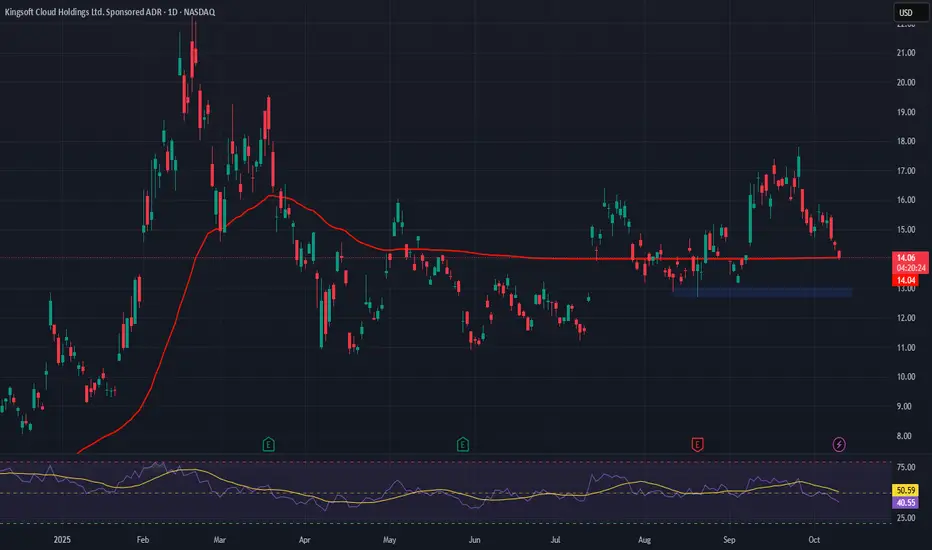
Kingsoft Cloud (KC) – Turning into an AI Powerhouse🔍 Overview
Kingsoft Cloud Holdings Limited NASDAQ:KC is rapidly evolving into a major player in China’s AI infrastructure space. With strong foundations in cloud computing and a sharp pivot toward high-performance AI services, KC is riding the wave of digital transformation in China's economy.
🚀 AI Cloud Growth
In Q1 2025, AI Cloud billings soared +228% YoY to RMB 525M.
Now makes up 39% of public cloud segment, up from a much smaller base.
This growth highlights KC's strategic shift from generic cloud to AI-driven infrastructure solutions.
🤝 Strategic Partnerships
Key ecosystem ties with Xiaomi and Kingsoft Corporation.
These integrations create network effects, boosting stickiness, cross-sell potential, and long-term revenue growth.
📊 Financial Turnaround
Q2 2025 revenue: +20.3% YoY, first profitable quarter in company history.
Q1 revenue: +10.9% YoY to RMB 1.97B.
Reflects tight cost control + margin expansion from AI services.
📈 Technical Outlook
Bullish bias above $12.75–$13.00
Upside target: $21.00–$22.00
Watching for consolidation or breakout from recent base.
💡 KC is emerging as a high-growth AI infrastructure play, aligned with national and enterprise trends in China’s digital economy.
RIOT Continues in Wave 3. Resistance? What resistance?NASDAQ:RIOT shot straight through resistance now support with only a small consolidation. The path should be clear for a stronger move towards $38

CLSK Breaking out!CLSK continues with momentum closing above the macro triangle upper boundary trend-line and now testing the last resistance before a breakout! This will coincide with a break above wave D and flip the macro structure bullish bringing in more capital!
Daily RSI is overbought with slight bearish divergence but can remain this way for weeks in a strong uptrend!

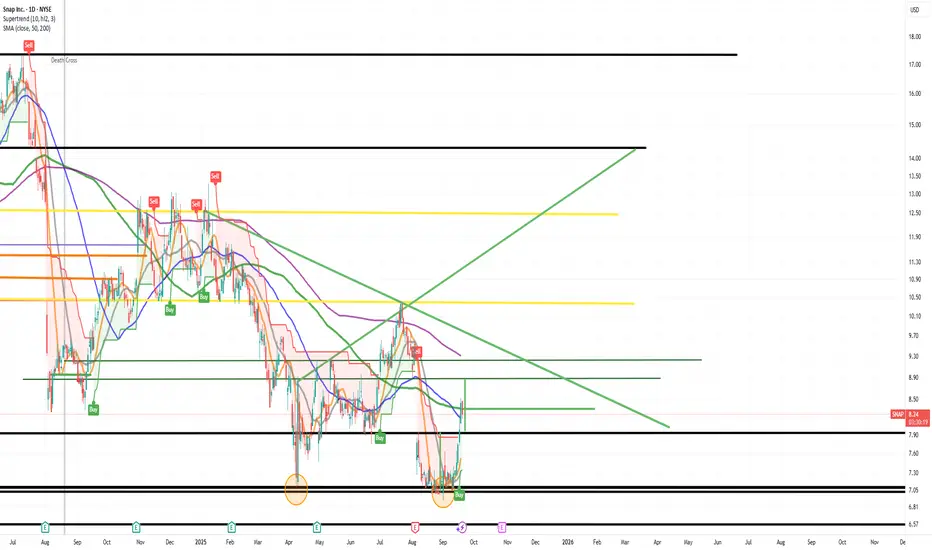
The King of $SNAP is back, with a price target of at least $13As a seasoned multimillionaire trader, I’ve navigated countless market cycles, and few trades have been as straightforward and profitable as Snapchat. Historically, NYSE:SNAP has offered clean technical setups and predictable momentum, making it one of the easiest gains in my portfolio.
Currently, I see a compelling opportunity unfolding:
Initial Target: $9.25 – This represents a gap-fill level that I consider virtually guaranteed based on historical price action and volume profile.
Breakout Potential: $11.00 – Once NYSE:SNAP clears the $9.25 threshold, I expect a rapid move toward $11, driven by momentum and short-covering.
Major Resistance: $13.00 – This is where I anticipate the next significant pause or consolidation.
1) Cup and Handle
2) Doulbe Bottom
Given the current setup, this is an ideal time to initiate a long position. The risk/reward ratio is highly favorable, and the technical indicators support a bullish continuation.
And yes, I’m sharing this publicly — not because I expect anyone to listen (let’s be honest, most won’t), but because I like receipts. When NYSE:SNAP hits these levels, I want the record to show: I called it first.
Strong buy recommendation. But hey, ignore it if you want — I’ll be too busy counting gains.
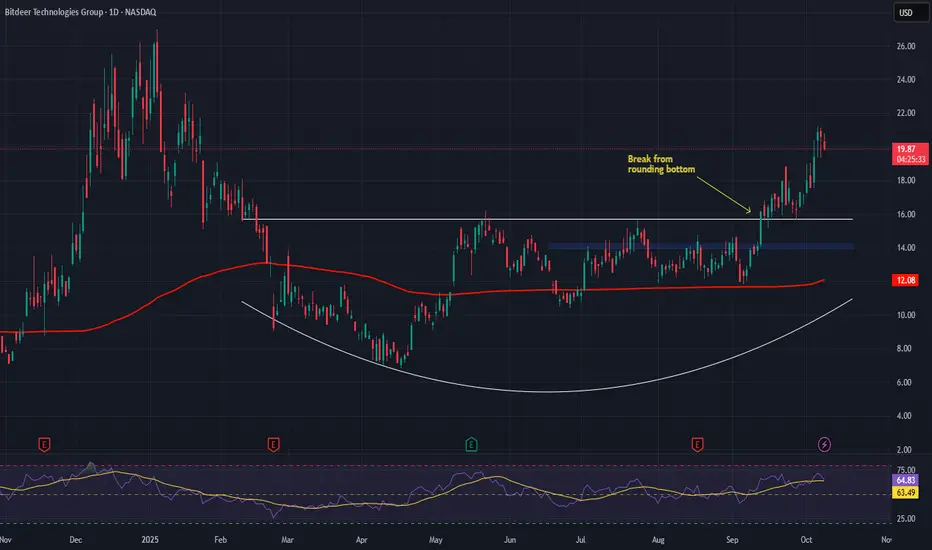
BITDEER – Bullish Outlook as Blockchain Meets AI PowerhouseBitdeer Technologies Group NASDAQ:BTDR is gaining serious traction as a dual-play on blockchain infrastructure and AI-driven compute power. The company operates at the intersection of crypto mining and artificial intelligence cloud services, offering exposure to two of the most dynamic sectors in tech.
🔍 Key Catalysts:
🚀 Revenue Momentum
Q2 2025 revenue surged +56.8% YoY, driven by expanding mining operations and renewed Bitcoin market strength.
📈 Massive Hashrate Growth
Bitdeer targets 40 EH/s of self-mining capacity by October, making it one of the largest global mining operators, well-positioned to ride institutional Bitcoin adoption.
🧠 AI Infrastructure Expansion
Transitioning beyond pure crypto, BTDR is doubling down on high-performance computing (HPC). Its AI Cloud platform, which won the 2025 AI Breakthrough Award, utilizes 1.6 GW of power capacity to run demanding AI workloads—marking a major evolution in the company’s model.
🌍 Global Footprint
A diversified presence across multiple geographies adds scalability and shields against regulatory shifts—a key edge in today’s policy-sensitive environment.
📌 Technical Setup:
We are bullish above the $14.00–$14.25 breakout zone. Sustained price action above this level could pave the way for an upside target of $27.00–$28.00 in the medium term.
Putting latest AI architecture to the test.Our base model got 100% of it's forecasts correct last week, which is unsustainable on the markets. So I am stress testing my latest AI model to 'interview' it as my go to back-up should the base model be having an off day.
Also, use these forecasts as market structure and market timing forecasts, the images themselves are fixed therefore the Height (price y-axis) can't be changed.

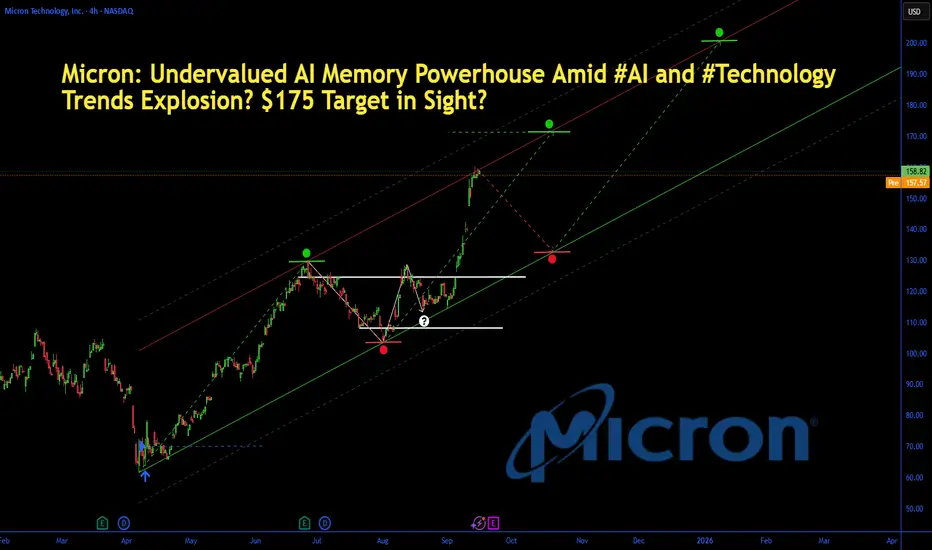
Micron: AI Memory Powerhouse Amid #AI and #TechnologyMicron: Undervalued AI Memory Powerhouse Amid #AI and #Technology Trends Explosion? $175 Target in Sight?
Micron (MU) shares hit a new 52-week high of $158.28 today, up 1.2% amid surging AI data center demand and institutional buying, with the stock soaring 86.8% YTD on memory chip tailwinds.
As Q4 fiscal 2025 earnings loom on September 23—projecting 58% EPS jump to $1.29 on $8.7B revenue—analysts have hiked targets to $175, implying 10%+ upside. Just as #AI racks up 17K mentions and #technology trends with 46K on X today (fueled by AI video generators and chip hype), Micron's HBM3E tech for Nvidia GPUs positions it as the undervalued play in the $200B+ semiconductor memory market.
But with forward P/E at 12x, is MU set to ride the AI wave higher, or will supply gluts cap the rally? Let's unpack the fundamentals, SWOT, charts, and setups for September 17, 2025.
Fundamental Analysis
Micron's resurgence is driven by AI hyperscaler demand for high-bandwidth memory (HBM), with Q2 fiscal 2025 revenue hitting $9.3B (up 93% YoY) and data center sales doubling to $2.2B.
Analysts forecast 2025 revenue of $38.5B (up 50% YoY), as HBM capacity ramps to 250K wafers amid #AI trends exploding on social media. Trading at 18% below fair value per DCF, MU's undervaluation shines with gross margins rebounding to 37%—but cyclical DRAM risks could flare if PC demand softens.
- **Positive:**
- AI boom ties into today's #technology hype, with HBM3E sales projected at $2.5B in FY2025; institutional stakes rising signal confidence.
- Q2 EPS beat of $1.18 (vs. $1.00 est.) and $1.6B FCF undervalues the stock at 12x forward earnings vs. sector 25x.
- Broader trends in edge AI and automotive chips position MU for 20%+ CAGR, amplified by #AI video generator virality.
- **Negative:**
- Inventory overhang from prior cycles could pressure pricing, clashing with #technology optimism if China trade tensions escalate.
- High capex ($8B annually) strains balance sheet if AI adoption slows amid economic jitters.
SWOT Analysis
**Strengths:** Leadership in DRAM/NAND with 20%+ market share; AI-optimized HBM tech generates 50%+ gross margins, amplified by #AI relevance in data centers.
**Weaknesses:** Cyclical exposure to consumer electronics; $7.8B net debt limits agility in a volatile #technology market.
**Opportunities:** HBM ramp to meet Nvidia/AMD demand unlocks $5B+ revenue; undervalued at 12x P/E amid 58% EPS growth and #AI boom on X.
**Threats:** Supply chain disruptions from geopolitics; competition from Samsung/SK Hynix capitalizing on #technology trends.
Technical Analysis
On the daily chart, MU is in a parabolic uptrend, breaking 52-week highs after consolidating above $140 support, with volume exploding on AI news and mirroring #AI volatility spikes. The weekly shows a cup-and-handle breakout from summer lows, now accelerating higher. Current price: $158.28, with VWAP at $156 as intraday pivot.
Key indicators:
- **RSI (14-day):** At 74, overbought but fueled by momentum—watch for consolidation amid #technology surges. 📈
- **MACD:** Bullish crossover with surging histogram, confirming AI-driven acceleration; minimal divergence. ⚠️
- **Moving Averages:** Price crushing 21-day EMA ($145) and 50-day SMA ($130), golden cross locked in.
Support/Resistance: Key support at $150 (recent breakout and 50-day SMA), resistance at $165 (Fib extension) and $175 (analyst target). Patterns/Momentum: Cup-and-handle targets $200; strong buy signals. 🟢 Bullish signals: Volume on earnings hype. 🔴 Bearish risks: Overbought RSI could pull back 5-8% on profit-taking.
Scenarios and Risk Management
- **Bullish Scenario:** Smash $165 on earnings beat or #AI catalyst targets $175 short-term, then $200 by year-end. Buy dips to $150 for entries tied to tech trends.
- **Bearish Scenario:** Breach $150 eyes $140 (200-day EMA); supply news amid #technology fade could retrace 10%.
- **Neutral/Goldilocks:** Range-bound $150–$165 if data mixed and #AI cools, ideal for straddles pre-earnings.
Risk Tips: Set stops 3% below support ($145.50) to tame volatility. Risk 1-2% per trade. Diversify with NVDA or SMH to hedge semi correlations.
Conclusion/Outlook
Overall, a bullish bias if MU holds $150, supercharged by today's #AI and #technology trends, cementing its undervalued status with 40%+ upside on memory demand. But watch September 23 earnings for confirmation—this fits September's chip rotation amid viral AI hype. What’s your take? Bullish on MU amid #AI chip trends or fading the rip? Share in the comments!
$DVLT - #DataVault #AI - $2.68 PTNASDAQ:DVLT has officially broken out above $2.00 after multiple retests of the $1.10–$1.40 range last week. Momentum remains strong following its IBM partnership news, and price action is respecting an ascending channel projecting toward $2.50–$2.80.
A clean hold above $1.74 could confirm continuation — eyes on the next leg up.
#DatavaultAI #DVLT #AI #AIStocks #MomentumTrading #NASDAQ #StockMarket

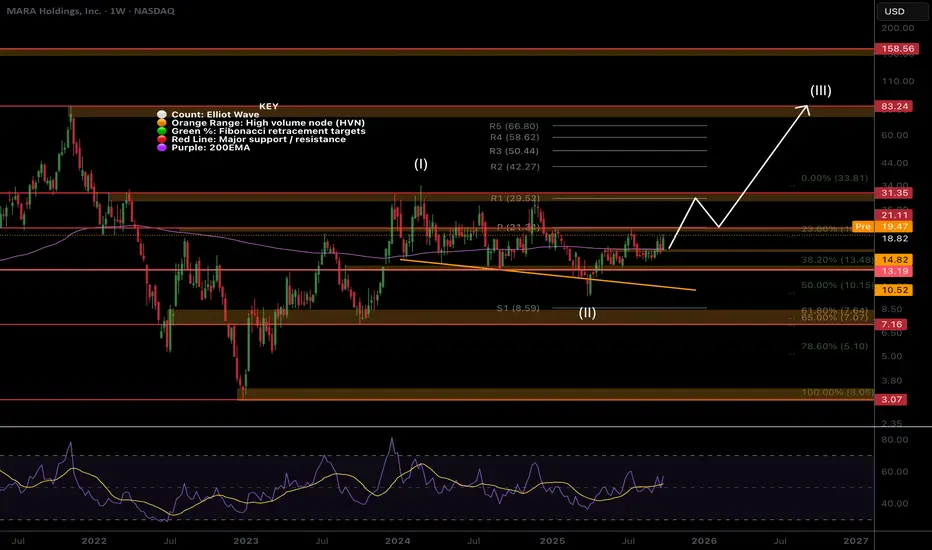
MARA Ready To Finally Move towards $30?MARA’s Elliot Wave (II) retracement front run the Fibonacci golden ratio and has now overcome the weekly 200EMA. The weekly pivot looms as strong resistance $21 just above the first target of our recent trade signal. If wave (III) is underway we should see price begin to accelerate alongside Bitcoin with an initial target of $31 followed by $80 High Volume Node.
Expect price to consolidate at the wave (I) resistance $30 for a while. Weekly RSI is crossed bullishly at the range EQ giving it room to move bullishly!
Safe trading
Gold next week: Key S/R Levels and Outlook for Traders🏆 Friday’s Close & Recent ATH:
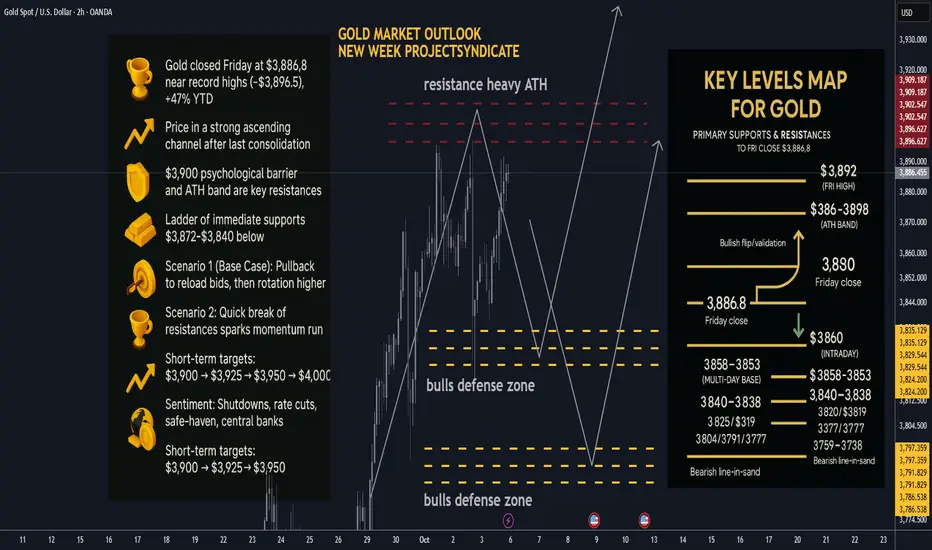
Gold (XAUUSD) closed Friday at $3,886.8, after printing a session high near $3,891.9. The latest all-time high is ~$3,896.5 (Thu), putting $3,900 squarely in play as the next psychological milestone. YTD performance remains extraordinary (≈+47% in 2025).
📈 Trend Structure:
Price continues to track a well-defined ascending channel on 1H/4H with a clean impulsive leg out of the last consolidation. Market character = higher highs / higher lows, persistent dip-buying, and strong trend adherence into quarter-turn levels (25/50 handles).
🔑 Key Resistance Levels:
The most critical resistance now sits at $3,900 (psychological + round-number supply). Beyond that, watch the ATH band $3,896–$3,898 and Friday’s spike high $3,892. Break/acceptance above opens $3,925–$3,950 as measured-move extensions, with $4,000 as a probable magnet on momentum follow-through.
🛡️ Support Zones:
Immediate supports step down as follows: $3,872–$3,860 (intraday pivot), $3,858–$3,853 (multi-day base), $3,840–$3,838 (Fri low). Deeper structural shelves: $3,825–$3,820, $3,804, $3,791, $3,777. A sustained break below $3,838–$3,825 would signal a more meaningful corrective phase.
⚖️ Likely Scenarios:
• Scenario 1 (Base Case) – Pullback then push: Controlled dip into $3,858–$3,838 to reload bids, then rotation higher toward $3,900+.
• Scenario 2 – Straight break: Quick clearance of $3,892/ATH $3,896–$3,898 → $3,900, unleashing a momentum run into $3,925–$3,950.
(Overbought signals persist, but structural demand keeps dips shallow.)
📊 Short-Term Targets:
On continuation: $3,892 → $3,900 → $3,925 → $3,950, with $4,000 as stretch if acceptance holds above $3,900. On retrace: $3,858 → $3,840 → $3,825.
💡 Market Sentiment Drivers:
• Shutdown-driven data delays & uncertainty are boosting safe-haven bids; Friday’s NFP was delayed, reinforcing cut expectations.
• Rate-cut odds remain elevated into October, keeping the opportunity cost of holding gold low (FedWatch/BofA commentary).
• Official-sector demand stays constructive (central banks resumed net +15t buying in August per WGC), underpinning dips.
• Macro/geopolitical risk + tariff chatter continue to provide a tailwind; 2025’s ~47% surge underscores the regime shift.
🔄 Retracement Outlook:
A tag of $3,858–$3,853 (multi-day pivot) or a stop-run to $3,840–$3,838 is a typical “healthy” pullback zone inside trend. Swift reclaim of $3,858/53 after a liquidity flush often precedes fresh ATHs.
🧭 Risk Levels to Watch:
Holding above $3,858–$3,838 keeps the bullish structure intact. Failure/acceptance below $3,825 shifts risk toward $3,804 → $3,791 → $3,777 and opens the door to $3,759–$3,738.
🚀 Overall Weekly Outlook:
Gold remains in a power-trend with $3,892/ATH $3,896–$3,898 → $3,900 as the immediate battleground. Expect orderly, buyable dips while those supports hold; topside roadmap favors $3,925–$3,950 with $4,000 viable on a decisive breakout/acceptance.
________________________________________
🗺️ Key Gold Levels Map — Primary Supports & Resistances (Updated to Fri Close $3,886.8):
Primary Resistances: 3892 (Fri high) → 3896–3898 (ATH band) → 3900 → 3925 → 3950 → 4000.
Primary Supports: 3872–3860 (intraday) → 3858–3853 (multi-day base) → 3840–3838 (Fri low) → 3825 / 3819 → 3804 / 3791 / 3777 → 3759–3738 (deeper control).
Bullish flip/validation: Sustained acceptance ≥3900 turns dips into buys toward 3925–3950.
Bearish line-in-sand: Daily close <3825 weakens the trend; <3791 confirms a broader corrective swing.
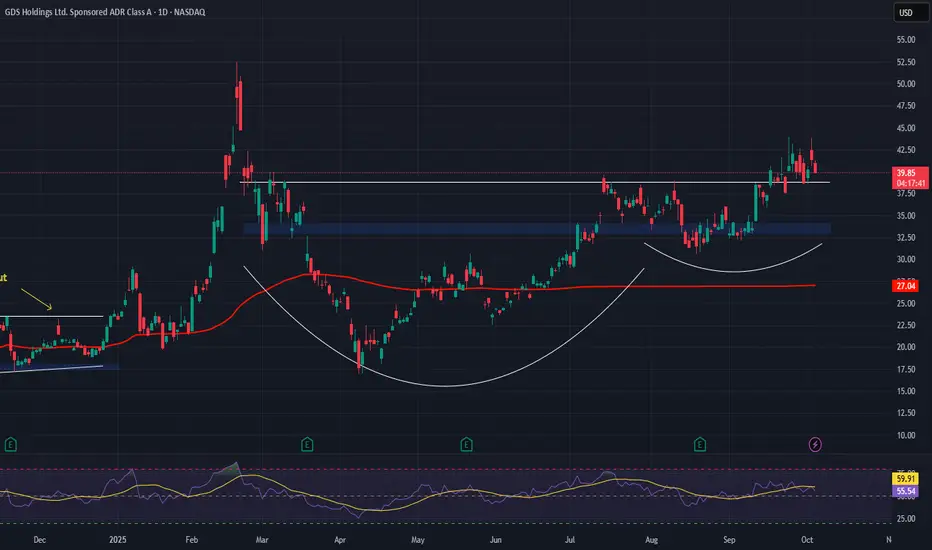
GDS Holdings (GDS) – Bullish Setup in the AI-Data Center BoomGDS Holdings Limited NASDAQ:GDS is emerging as a key player in Asia’s data infrastructure race, positioned to capitalize on explosive demand for AI-ready, high-density data centers.
🔍 Thesis Summary:
$1.2B Series B Equity Raise Completed
Backed by SoftBank Vision Fund & Ken Griffin, funding will enable >1 GW new capacity. A massive expansion push in China & Southeast Asia, where demand for digital infra is accelerating.
AI Wave = Data Center Surge
GDS is well-positioned to benefit from the rise in AI workloads, which require low-latency, high-power density facilities. Their premium sites in top-tier Asian hubs make them a first-choice provider.
Strategic Advantages Noted by Analysts
Raymond James cites rare access to land & power near major Chinese metros — a barrier to entry that protects margins & boosts scalability.
📊 Trade Setup:
Bullish above $33–$34
Upside target: $50–$52
Constellation Energy Back Up to $350CEG is on major support and *likely* to rise back up to $350 and above. That would be the next major support if it gets above.
Good luck!

BBAI Back To $9 or more.Big Bear AI is looking great and should be able to get back to $9 IMO.
BigBear.ai (BBAI) has several powerful catalysts backing a bullish thesis, including recent defense contracts, new AI deployments, expanding biometric partnerships, and increasing institutional ownership—all factors that signal substantial potential upside for the stock in the evolving AI sector.
Defense and Security Catalysts
BBAI recently announced a high-profile partnership with the U.S. Naval Forces at UNITAS 2025, deploying advanced AI and orchestration tools for maritime operations—positioning the company as a strategic asset in defense tech.
BigBear.ai’s collaboration with DEFCON AI further enhances its role in military logistics, while additional contracts across the U.S. and the UAE signal global expansion and diversified defense revenue streams.
These partnerships showcase BBAI's operational AI capabilities and may lead to future government and defense contract wins, a major growth vertical relative to most small-cap AI peers.
Real-World AI Deployments
BBAI has moved beyond speculative hype with real, revenue-generating businesses—its biometric veriScan technology is active in major airports like Nashville, streamlining customs, reducing congestion, and signaling a viable commercial pathway outside of defense.
Cargo security solutions with Narval Holding Corp in Panama and expansion in sports-related analytics (Washington Commanders partnership) demonstrate application diversity, with recurring revenues and growing brand presence.
Financials, Institutional Support, and Technical Strength
While Q2 revenues declined and losses widened, BBAI finished June with a record cash balance of $390.8M for future investments.
Updated guidance is for $125-140M in 2025 revenues, reflecting confidence in contract momentum and pipeline growth.
Major institutions, including Goldman Sachs, have recently added positions—GS increased its stake by 570%, now holding over 2 million shares, alongside Rhumbline Advisers, NewEdge Advisors, and ETFs. Total institutional ownership is over 7% of the float, indicating strong stakeholder confidence unlikely for most micro and small-cap AI names.
Technically, the stock trades above its 50- and 200-day moving averages, maintains bullish momentum, and saw a 14% breakout after defense announcements; volume trends are surging, with moves that mirror AI sector momentum leaders.
Unique Growth Profile in AI Sector
BBAI offers real-world, mission-driven AI solutions rather than speculative research, standing apart from many AI 'penny stocks.' Its expanding contract base and real deployments help justify re-rating potential from both AI sector excitement and actual revenue growth.
Because the U.S. and allied defense markets increasingly depend on AI, BBAI's "mission-ready" tech gives it first-mover advantages that could turn short-term volatility into substantial long-term rewards.
For risk-tolerant investors, the company's strategic pivot, cash position, institutional interest, and recurring revenue opportunities suggest a strong probability of market revaluation if contract flow and partnership growth continue.
BBAI is a compelling AI growth play with real contracts, strong defense sector exposure, expanding commercial applications, and increasing institutional support—ingredients for long-term bullish conviction despite short-term volatility.
NFA, DYOR.

$RZLV: Constructive Action Within Macro Bullish TrendNASDAQ:RZLV is moving in line with the broader macro bullish trend. As long as the 4.5 support zone remains intact, the setup looks constructive for one more leg higher toward the 11–13.5 resistance area.
Chart:

The science of hindsight I didn't sleep easy last night at the AI back-up model getting the forecast wrong (the dip bit)
So after a 'ah-ha', I rushed over to the trade computer and saw that the primary AI model actually DID GET IT RIGHT, it was human error that missed it.
My confidence is restored, the King of the AI models defends it's thrown

Stress testing the latest in Trading-TechIt's taken man 100 years on the financial markets to be able to forecast on this level.
Now that I have the thinking structure of the latest AI models trained, I get to beta test them on live markets.
In this video I explain what it is I am testing and how I apply the predictions
The 30min chart is fast moving in comparison to the higher timeframes, so the structure of the price candles are messier. With that in mind, the AI models are holding strong... lets see if they can keep this up

TTD: AdTech Giant Amid #Altseason Buzz? $72 in Sight?TTD: Undervalued AdTech Giant Amid #Altseason Buzz? $72 in Sight? Price at $49.64 (+4.33%), tied to Q2 earnings beat and crypto ad surge on X/Reddit, undervalued with 53% upside to targets, questioning if data growth sparks rally.
Fundamental Analysis
EPS $0.83 TTM, revenue growth 23.18% TTM, expected EPS growth 40.25% 5Y, P/E 56.12; Graham formula IV $74.76, PEG 1.39 (near 1, undervalued per Lynch on growth), DCF suggests moat in programmatic ads; incentives align management with revenue beats, inversion highlights competition risks.
Positive:
18.2% 5Y revenue forecast.
Strong cash $1.69B.
Negative:
Volatility 7.2%.
Short-term sell signals.
SWOT Analysis
Strengths: Leading platform, high moat via data.
Weaknesses: High beta 1.08.
Opportunities: #Crypto ad expansion.
Threats: Market slowdowns.
Technical Analysis
Rebound from lows, neutral rating. Price: $47.14, VWAP N/A. Key indicators: RSI: 35/selling pressure.
MACD: Level (12,26) N/A.
Moving Averages: 5-day DMA 44.84.Support/Resistance: 43.79/45.27. Patterns/Momentum: Buy signal short-term. Bullish | Bearish. Scenarios and Risk Management Bullish: Break $45, DCA for $72 on earnings; second-order thinking sees ad surge amplifying gains.
Bearish: Below $43.79.
Neutral: Range trading.Risk Tips: Stops 5-10% below, diversify 5%, DCA dips.
Conclusion/Outlook
Bullish if growth sustains, lollapalooza from #Altseason boosts upside. Watch Q3 earnings. Fits adtech theme with #Crypto upside. Take? Comment!
