NVDA Hagia Sophia CRACKING! CAUTION!NVDA is starting to fall apart. Nice rounding top followed by mini towerspike (as shown in the picture) that is now starting to roll over.
The price was rejected after the first crack that bounced lower. That's the big warning CRACK! Now we wait for the bigger CRACK! to occur.
Despite how small it looks on the chart, the reality is that NVDA has lost 20% or 1/5 of its total value already.
There is only so much B.S. they can come out and say to pump the stock. Eventually, that dies off along with the stock.
Remember! Circular financing is flat-out illegal because it fabricates the appearance of real demand, real capital, or real creditworthiness when none actually exists. It’s the financial version of forging a signature. This administration has gutted the SEC, and no one will dare call it out for what it is in AI. But the markets will always correct for theivery in the end.
NVDA should never have gotten this high. But that is the beauty of Reflexivity. We should all be used to it by now.
Eventually, it will all come crashing down. I hope not with you in it. I urge caution to the bulls!
THANK YOU for getting me to 5,000 followers! 🙏🔥
Let’s keep climbing.
If you enjoy the work:
👉 Boost
👉 Follow
👉 Drop a solid comment
Let’s push it to 6,000 and keep building a community grounded in truth, not hype.
Aibubble

Uptrend Started After Liberation Day - All Has Broken BelowThe US markets have been described as “on a rally” for quite some time. I would not agree if it is meant to describe the overall US market, but would agree if it refers specifically to AI or tech stocks. Why?
Among the four major US indices, the Russell—representing a much broader base of US-listed companies—continues to struggle to break above its high from last year, even though the others have far surpassed it. In fact, it has since corrected by 9.5% since its all-time high just last month.
After that, the other indices are also following suit only in the past few days, breaking below this uptrend that started in April.
Russell has taken the lead and has broken below this trend in late October.
The earliest clue came from the Russell Index, where many suppliers of the Magnificent 7 companies are also part of Russell 2000 components. When the Russell—or smaller-cap companies—starts to weaken, it often reflects broader market pressures that may eventually spill over to the rest of the indices or vice versa.
Video version on the process of how I monitor the four indices and then narrow it down to the individual index.
Micro E-mini Russell 2000 Index
Ticker: M2K
Minimum fluctuation:
0.10 index points = $0.50
Disclaimer:
• What presented here is not a recommendation, please consult your licensed broker.
• Our mission is to create lateral thinking skills for every investor and trader, knowing when to take a calculated risk with market uncertainty and a bolder risk when opportunity arises.
CME Real-time Market Data help identify trading set-ups in real-time and express my market views. If you have futures in your trading portfolio, you can check out on CME Group data plans available that suit your trading needs www.tradingview.com

MSFT WARNING!Here is a closer view of the chart I posted back on Oct 5, 2024, for a nice profitable -25% drawdown.
This time will be far more profitable.
Here is a breakdown of the chart.
- Up against a 38-year trendline.
- A rare 5-wave rising wedge.
- A H & S with a head test
- Big Ass Gap Below
- Double top M pattern that CRACKED!
- Rising Bearish Wedge.
This is just getting started!
Bulls, if you didn't make your money in MSFT yet and are trying to squeeze a little bit more profits bc you are too damn greedy. Then you deserve what you get next.
THANK YOU for getting me to 5,000 followers! 🙏🔥
Let’s keep climbing.
If you enjoy the work:
👉 Boost
👉 Follow
👉 Drop a solid comment
Let’s push it to 6,000 and keep building a community grounded in truth, not hype.

Analysis for What’s Coming - AI Bubble Sentiment The US markets have been described as “on a rally” for quite some time. I would not agree if it is meant to describe the overall US market, but would agree if it refers specifically to AI or tech stocks. Why?
Among the four major US indices, the Russell—representing a much broader base of US-listed companies—continues to struggle to break above its high from last year, even though the others have far surpassed it. In fact, it has since corrected by 9.5% since its all-time high just last month.
After that, the other indices are also following suit only in the past few days, breaking below this uptrend that started in April.
Micro E-mini Russell 2000 Index
Ticker: M2K
Minimum fluctuation:
0.10 index points = $0.50
Disclaimer:
• What presented here is not a recommendation, please consult your licensed broker.
• Our mission is to create lateral thinking skills for every investor and trader, knowing when to take a calculated risk with market uncertainty and a bolder risk when opportunity arises.
CME Real-time Market Data help identify trading set-ups in real-time and express my market views. If you have futures in your trading portfolio, you can check out on CME Group data plans available that suit your trading needs www.tradingview.com

AI Valuation TechnicallyThese are the three largest market-cap listed companies on the Nasdaq.
If we are concerned about an AI bubble, I’m going to show you how I perform a quick glance at some top companies and their index to determine the likelihood of an upcoming short-, mid-, or long-term correction.
In 2017, Microsoft’s P/E reached its highest at 45 — and it continued to rise after that.
In 2023, Nvidia’s P/E reached its highest at 147 — and it continued to rise after that.
In 2024, Apple’s P/E reached its highest at 40 — and it continued to rise after that.
Video version:
Micro E-mini Nasdaq-100 Index
Ticker: MNQ
Minimum fluctuation:
0.25 index points = $0.50
Disclaimer:
• What presented here is not a recommendation, please consult your licensed broker.
• Our mission is to create lateral thinking skills for every investor and trader, knowing when to take a calculated risk with market uncertainty and a bolder risk when opportunity arises.
CME Real-time Market Data help identify trading set-ups in real-time and express my market views. If you have futures in your trading portfolio, you can check out on CME Group data plans available that suit your trading needs tradingview.com/cme/

NVDA: 1 week before earnings effect. Supply-demand imbalance.Parretto principle (20-80): small important things can have great influence in grand scheme of things. Some events have greater weight, than say 80-90% of daily events.
Stocks move based on Supply-demand dynamics (disbalance etc), patterns or trends are just a feedback.
The problem with using charts as a feedback for strength (or feedback for S-D strength) is that: (1) on a expensive market, with extended prices (with high supply too), (2) during important NVDA earnings, it's almost predictable how markets would sink, or at least be volatile.
Demand stalls. Supply gets worried. Price down.
//People are risk averse. Hence.. predictable.

Palantir reversal underway.Here is the #PLTR chart compared to Silver.
We can observe a softness in this ratio.
This has formed a minor head and shoulders pattern, initiating a downward trend.
In the end, I truly believe that the significant inverse head and shoulders breakout is probably going to be tested.
Michael Burry's puts might very well yield substantial returns as a lot of the AI trade experiences a retracement or backing and filling following some massive upward movements.

Monitoring AI Valuation - Precision on Upcoming CorrectionThese are the three largest market-cap listed companies on the Nasdaq.
If we are concerned about an AI bubble, I’m going to show you how I perform a quick glance at some top companies and their index to determine the likelihood of an upcoming short-, mid-, or long-term correction.
In 2017, Microsoft’s P/E reached its highest at 45 — and it continued to rise after that.
In 2023, Nvidia’s P/E reached its highest at 147 — and it continued to rise after that.
In 2024, Apple’s P/E reached its highest at 40 — and it continued to rise after that.
Micro E-mini Nasdaq-100 Index
Ticker: MNQ
Minimum fluctuation:
0.25 index points = $0.50
Disclaimer:
• What presented here is not a recommendation, please consult your licensed broker.
• Our mission is to create lateral thinking skills for every investor and trader, knowing when to take a calculated risk with market uncertainty and a bolder risk when opportunity arises.
CME Real-time Market Data help identify trading set-ups in real-time and express my market views. If you have futures in your trading portfolio, you can check out on CME Group data plans available that suit your trading needs www.tradingview.com

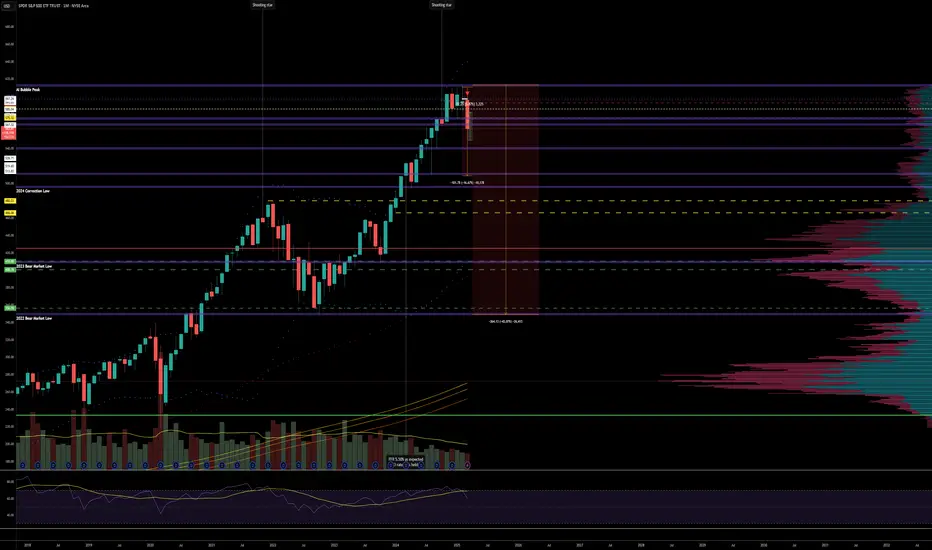
SPY to Crash to $350s by MayPeople fail to realize how dramatic market crashes can be. Historically bear markets have seen 30%+ declines from peak. We are going to see a 40%-50% decline from peak down to 350s by May.
With 1 or 2 exceptions, rate cutting cycles have always coincided with bear markets, which are 30%+ declines from peak in the S&P 500. We have the largest spike in unemployment since covid, largest drop off in real estate sales, massive AI bubble in tech stocks, Q1 GDP falling off a cliff to -2.8%, the list goes on and on.
SPX at Great Depression and Dot-Com Crash LevelsCurrent deviation from long term mathematical model at the top of trend only reached twice in the last 100 years; once during the Great Depression and once during the top of the Dot-Com bubble.
Mathematical model = Ratio of Close to smoothed 300 Week SMA (SMA 10 of SMA 10 of SMA 70 Week Close)

Correction Coming for AI? AI technology has been recognized as the new future since the end of 2022. The rapid advancements in AI and its stock prices sparked debates regarding the sustainability of its current valuations.
Indeed, AI technology has a long runway ahead, but like all journeys, it will eventually encounter a bend. In today's tutorial, we are going to study its fundamental and technical reasons why we may have to prepare for a windy and bumpy ride ahead.
E-mini Nasdaq Futures & Options
Ticker: NQ
Minimum fluctuation:
0.25 index points = $5.00
Micro E-mini Nasdaq Futures & Options
Ticker: MNQ
Minimum fluctuation:
0.25 index points = $0.50
Disclaimer:
• What presented here is not a recommendation, please consult your licensed broker.
• Our mission is to create lateral thinking skills for every investor and trader, knowing when to take a calculated risk with market uncertainty and a bolder risk when opportunity arises.
CME Real-time Market Data help identify trading set-ups in real-time and express my market views. If you have futures in your trading portfolio, you can check out on CME Group data plans available that suit your trading needs www.tradingview.com
