Algorithm

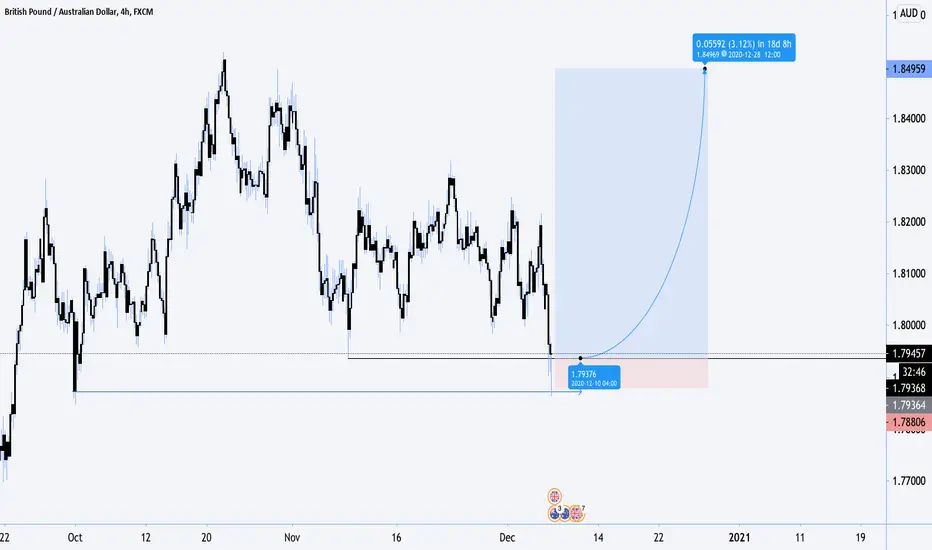
GBPAUD longs Intraweek Setup Update + ExplanationThe current 4 Hourly Body Closure Low of the week was retested today NY session. See the pinpoint precition and closure above it's clear under my system that money was taken from intraday buyers holding a long trade.
I firmly believe GA is ready to rocket from here. Let's see what happens. Great R/R tho

Long Play - MCLD Technicals Signalling BullishThanks for checking out this idea! Note: this is not financial advice. Trade at your own risk and with due diligence. I may or may not have a position in this security. Manage your risk.
On our weekly timeframe, we currently see a close above the 9 EMA, while RSI remains near oversold, and MACD is at a potential crossover - will we be rejected by the MACD signal line again, or will we see continuation to the upside?
If we look at the daily chart above, we will see a confirmation of uptrend, with the daily MACD crossing over signal line, and bullish divergence as price action goes down while RSI and MACD have been moving up. A push into positive MACD territory will be a major buy signal.
We can also note a candle close just on top of the daily 9EMA (grey) and close to the .382 fib level. A cross of the 9EMA over the 20EMA (purple) will pump price as algorithms get triggered.
Hope this analysis helps you guys out. Happy holidays and happy trading!

GA December Forecast / Longs into prev month highs 1.8500$After taking out prev month lows im expecting a long swing into prev month highs and beyond to finish this 2020 market cycle.
AAPL 12/7-12/18 Trade Plan-Bullish Trend on the Daily.
-Nearing the previous resistance @124.80-125.00 back from mid October
Short under AAPL breaking and holding under 120.75
PT @118.00-118.25
PT @116.75-117.00
Long over 122.15
PT @124.75-125.00
PT @126.60

SE Trade Plan (12/2)-(12/18) Daily Chart - Bullish
4Hour Chart - Bullish
2Hour Chart - Bullish
1Hour Chart - Bearish
30Min Chart - Bearish
15Min Chart - Bearish
5Min Chart - Bearish
Short under @176.31
PT @173.77
PT @167.40
SL @177.54
Long over @177.54
PT @179.41
PT @182.09
SL @176.31

SRNE Trade Plan (11/27)-(12-11)Below 5.70 Short
PT @4.79
Ideal PT @3.40
SL @5.32
Above 7.26 Long
PT @7.97
PT @8.33
Ideal PT @10.31 then 11.76
SL @6.65
Leaning on bullish as long as it holds above @5.6. Holding below @5.32 and we'll retest @4.79 then @3.40 rock solid support.

Ethereum Projection-Hawk
If you're interested in the algorithm I use to calculate the Supply and Demand zones, here's a link:

Buy Signal: 48.96Ingenuity Trading Model-
Geometric Markov Model : In probability theory, a Markov model is a stochastic model used to predict randomly changing systems. Markov Models are used in all aspects of life from Google search to daily weather forecast. The randomly changing systems we focus on are the equity, futures, and forex markets. The geometric element of the model is the fractal wave structure you can find on any chart you look at across any market and across all time dimensions.
Our model focuses on the current wave formation (current state)- geometric price formation along with its volume and volatility over a given time period and using that information to predict the future state- future price movement.

Bitcoin RoadmapHere is the count and support zone calculated for the previous bear market:
This is the link to the algorithm that I use for my Supply / Demand zones:
-Hawk

Bitcoin Forecast using the Oracle AlgorithmThe following is an analysis using the Oracle Algorithm which draws support and resistance boxes.
- Alien Crew
Link to Oracle:

Showcasing Oracle & Zeus combined [Premium Algorithms]This chart shows two premium indicators that were custom made by myself.
Oracle sees the future, while Zeus sees the present. The combination of these scripts provides a significant edge in the market.
-Hawk
Oracle:
Zeus:

Showcasing Oracle & Zeus combined [Premium Algorithms]This chart shows two premium indicators that were custom made by Hawk at Alien Crew.
Oracle sees the future, while Zeus sees the present. The combination of these scripts provides a great edge in the market.
Oracle:
Zeus:
-Hawk

experiment hmmm check it out... maybe an algo here, all these peaks are are 104 days apart, regardless of trend direction, I'm plotting this chart as an experiment to see if gen boosts at that same interval, if so gen will boost and peak in roughly 2weeks haha algo detected :)
peace
freddy

🤖 MU LONG 🤖MU is one of the few stocks that has been struggling on making the V-shaped recovery compared majority of it's peers in the tech industry. As we can see MU is back to it's consolidation range back from June-August.
Breaking above 51.30 and we'll retest 53.50-54.00 hard resistance. I picked up a few 52C 10/2 swings from yesterday and ended up trimming half for 30% and swinging the rest considering the amount of time we have and how MU's is setting up.
PT @51.90-52 and 52.60-52.75
Ideal PT @53.8-54.20
Conservative SL @50.55
Max SL @49.69
Look to Short MU and TP if MU fails to break over 51.50-51.60-51.75 minor resistance @Open today

🇫🇧 FB SHORT 🇫🇧Support Trend Line that held FB on it's bullish run since mid-march has been broken yesterday due to the Anti-Trust news/rumors sell off. Look to enter a half position on FB 9/25 PUTS if FB fail to hold over 255-256 or if it can't break and hold over 261-262.
PT @251-252 and 247.5-249
Ideal PT @241.5-242.25
Conservative SL @260.5-261
Max SL @264.10
Consider to pick up calls above 263-265 as I can see FB retesting 272-273 if we can hold above those levels.

💻 SE LONG 🖥️After pushing for yet another ATH @165.95 earlier this month, SE has been retracing back to the support trend line that has been holding since early May. Look for a clean break above 150.50-151 before picking up calls.
PT @158-159
Ideal PT @165-167 (ATH)
Conservative SL @145-146
Max SL @142-143
I would consider puts if SE fails to break or hold over 150.60 as I can see it pulling back to low 140's/high 130's
PT @146-146.5 then 143.5
Ideal PT @138-141.4
Conservative SL @151.80
Max SL @153.39

📫 AMZN 9/14-9/18 Trade Plan 🎁AMZN had a nice run pushing new ATH to @3552.25 and pulling back breaking the support trend line that has been holding since March.
LONG
Holding Above 3050
Target 3078, 3126, 3165, 3228 (Resistances)
SHORT
Holding Under 3042
Target 3018, 2994, 2947, 2912 (Supports)

🤖 WORK 9/2-9/4 ER Options Trade Plan 🤖Earnings Report tomorrow on the 3rd of September
LONG
Bullish over 33.15
PT @33.70, @34.75, @35.5 then hard resistance in the 38-39 (ATH) range
SHORT
Failing to hold above 33.70 and we'll pullback
PT @33.20, @32.70, and @31.95-32.15 solid support

📹 ZM ☎️ (8/31)-(9/11) Options/ER Play📹 ZM ☎️
Earnings Report 8/31
Current Price @300.56
Bullish holding over @300 to push to @302.17 resistance then retest ATH @303.58. Above @303.58 I can see the next PT's @310-315+
-Support @299's
-Resistance @302.17
-Resistance @303.58
On the downside, if ZM struggles to break over 303.58, expect a pullback to 295's.
Supports to Watch
-@295's
-@290-292
-@284-286
-@277

☕ SBUX (8/31) - (9/11) ☕ Options☕ SBUX ☕
SBUX had a nice bull run last week topping out around @85.30
Holding above @83.50 and SBUX will have a high chance to break last's week's high. Above @85.65 and we'll find @87-88
On the downside, failing to break @85.30 and we'll most likely pullback to @82.50's, @79.50's, then rock solid support @77.15

MSFT (8/31)-(9/4) Trading Plan$MSFT
MSFT Bullish above 227.
Price target @231.10
Breaking and holding above @231.15 and we'll push to @235-240 range for new highs.
MSFT Bearish breaking under 225.45
Price target @221-220
Under @220, we'll pullback until we find support around @215 or so

❗ DOCU (8/31) - (9/4) ER Options Play ❗$DOCU ER (9/4)
Current price @216.30
LONG
Bullish Above 215
Price Target @221.20 (Resistance on Friday)
Ideal Target @228-229 (Resistance, near ATH)
Breaking above ATH and we'll push to 239-240.
Play Invalid under @214.40 (SL)
SHORT
On the downside, break and holding under 214.60 and we'll pull back to 206.69-208.10
