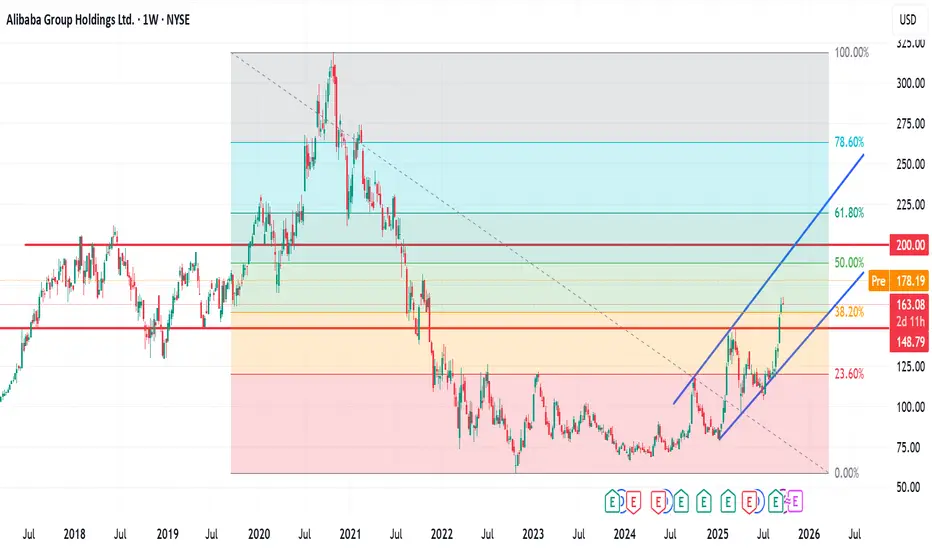
Alibaba - Preparing a major buying opportunity!🥇Alibaba ( NYSE:BABA ) creates a major break and retest:
🔎Analysis summary:
For the past three years, Alibaba has perfectly been respecing all structure. And with the recent retest of a major resistance, Alibaba is now heading for a decent correction. But with the emerging bullish break and retest, Alibaba will soon create a major reversal.
📝Levels to watch:
$135
SwingTraderPhil
SwingTrading.Simplified. | Investing.Simplified. | #LONGTERMVISION
Alibaba

$BABA - Falling Wedge BreakoutAlibaba ( NYSE:BABA ) continues to respect classic trading patterns.
We’ve seen a number of bullish continuation patterns (falling wedge & bullish pennant) before, each one ended up with a sharp growth.
At the moment the price is forming another Falling Wedge above the $146 key support. As long as Baba holds above this area, the priority of price movement is strictly UPWARDS .
Losing $146 would invalidate this setup.

ALI BABA : SELL OR BUY ??The last time that the price was around 100 $ was at the IPO (2014) and then between AUG 2016- JAN 2017
TOTALL ASSET :
IPO(2014) : 41.27 B
2016: 73.55 B
2017: 114.01 B
2020: 257.86 B
2021 :276.25 B (UNTIL Q3)
GROSS PROFIT :
IPO(2014) : 8.12 B
2016: 14.05 B
2017: 20.66 B
2020: 42.09 B
2021: Q1 + Q2 +Q3 =37.25 + Q4(9.03)(IF WE CONSIDER SAME AZ Q4 OF 2020) = 46.28 B
P/E FORWARD = 7.40 !!!
P/S =2.12 !!!
P/CASH FLOW = 0.10
P/B = 1.79
RETURN ON ASSET = 3.86%
QUICK RATIO = 1.65
DEBT / ASSET RATIO = .08
All these items show the prices are not permanent.

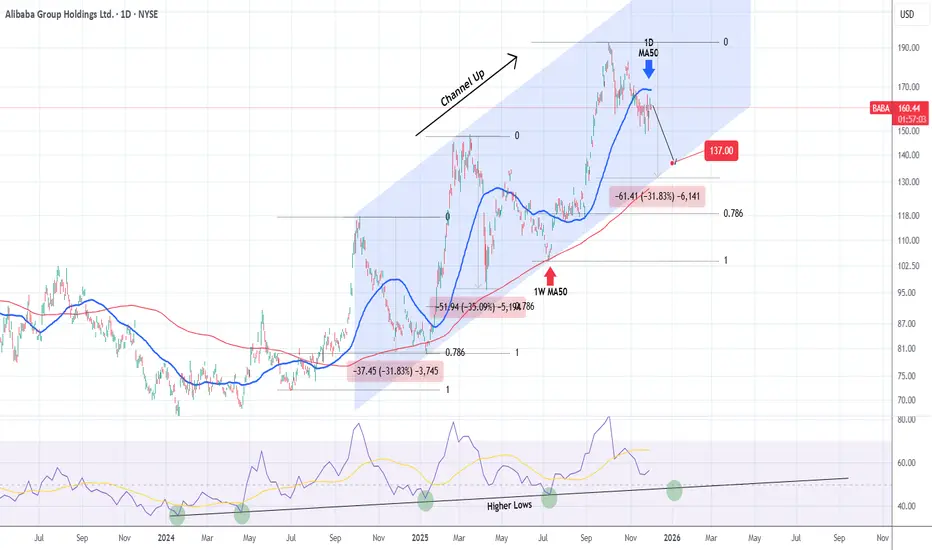
ALIBABA This correction isn't over.Alibaba (BABA) has been trading within a Channel Up since the October 07 2024 High. Right now it is on the 3rd Bearish Leg of this pattern, confirmed below the 1D MA50 (blue trend-line).
Both previous Bearish Legs touched the 1W MA50 (red trend-line) and the 1W RSI Higher Lows trend-line.
We expect that to happen at $137.00 (at least), which still puts the stock above both the 0.786 Fibonacci retracement level of the Bullish Leg and the -31.83% drop of the first Bearish Leg.
---
** Please LIKE 👍, FOLLOW ✅, SHARE 🙌 and COMMENT ✍ if you enjoy this idea! Also share your ideas and charts in the comments section below! This is best way to keep it relevant, support us, keep the content here free and allow the idea to reach as many people as possible. **
---
💸💸💸💸💸💸
👇 👇 👇 👇 👇 👇
Alibaba Group Holding Limited ($BABA) Announced Q4 Earnings Alibaba Group Holding Limited (BABA) announces her earnings reports today before the bell. The stock is up 5% with RSI at 47 NYSE:BABA shares are eyeing the $200 resistant should bullish momentum increase.
In the news, Alibaba reported cloud computing revenue up 34% year-on-year in its fiscal second quarter, beating market expectations. Investors are focused on Alibaba’s cloud division which books its revenue related to artificial intelligence.
In September, the company said it plans to increase spending on AI models and infrastructure development, on top of the 380 billion yuan ($53 billion) over three years it announced in February. Alibaba said on Tuesday it has spent around 120 billion yuan in capital expenditure toward AI and cloud infrastructure over the past four quarters.
In 2024, Alibaba's revenue was 996.35 billion, an increase of 5.86% compared to the previous year's 941.17 billion. Earnings were 129.47 billion, an increase of 62.36%.
Analyst Summary
According to 13 analysts, the average rating for BABA stock is "Strong Buy." The 12-month stock price target is $187.31, which is an increase of 16.54% from the latest price.
About BABA
Alibaba Group Holding Limited, through its subsidiaries, provides technology infrastructure and marketing reach to help merchants, brands, retailers, and other businesses to engage with their users and customers in the People's Republic of China and internationally. It operates digital retail platforms under the Taobao and Tmall names; wholesale marketplaces through 1688.com and Alibaba.com; global e-commerce platform under the AliExpress name; e-commerce platforms under the Lazada, Trendyol, and Daraz names;

Hang Seng Tech eyes breakout as Alibaba takes the stage
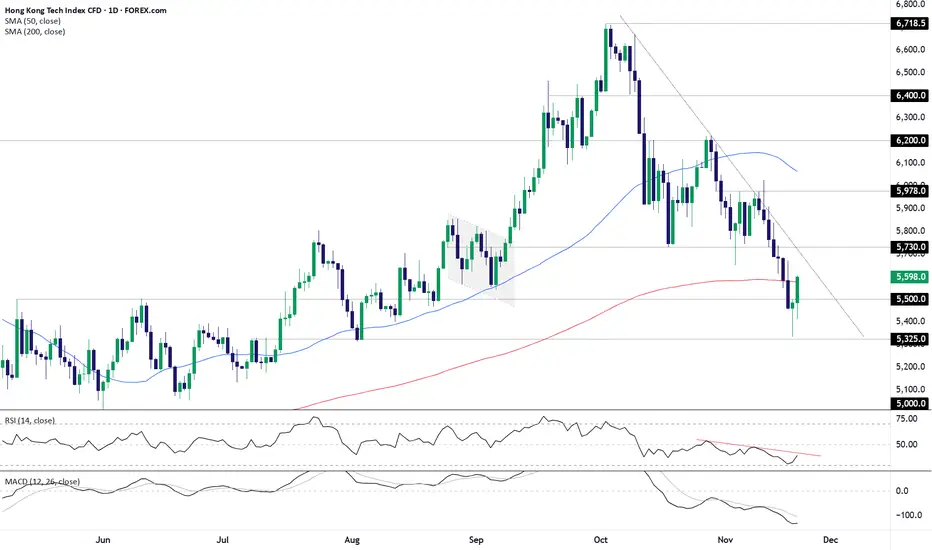
Is the rout in Hang Seng Tech coming to an end? That’s the question traders should be pondering today following the rapid rebound of recent days, seeing the index recover from multi-month lows to trade above the important 200-day simple moving average. It will be important on Tuesday, providing a level to build setups around depending on how the price action evolves during the session.
Before looking at potential ideas, the message from RSI (14) and MACD remains entirely bearish, with the former trending lower beneath the neutral 50 level while the latter sits at depressed levels having already staged a bearish crossover of the signal line earlier this month. With the 50-day moving average curling lower and the price in a clear downtrend, the broader message favours short setups over long.
Given that backdrop, an inability for the index to sustain its push above the 200DMA would generate a potential short setup, allowing for positions to be established beneath it with a stop above for protection. 5500 acted as both support and resistance earlier this year, making it screen as a possible initial target. If it were to be broken, 5325—where the index slide stalled on Friday—would be the next after that.
While bearish setups are favoured, it doesn’t completely dismiss the case for countertrend longs should the index continue to trade above the important 200DMA. If the breakout sticks, longs could be set above it with a stop beneath for protection, targeting the October downtrend and/or 5730 resistance. If those levels were to be broken cleanly, it would hint at the start of a new trend, opening the way to higher levels such as 5978, the 50DMA or 6200.
Alibaba will release its earnings before the U.S. open on Tuesday, with the conference call scheduled for 7:30 a.m. Eastern Time (8:30 p.m. Hong Kong Time).
ALI BABA HIGH PROBABILITY SETUP SOON!!!🚨 BABA HIGH PROBABILITY BUY SETUP 🚨
* Here We Can See Clearly The Next Potential Moves For BABA Coming Hours/Days.
* Keep Your Eyes Close On Your Trading Positions.
* Happy PIP Hunting Traders.
FXKILLA.

BABA Breakout Watch: Close Above 171 Opens Path to 190Alibaba (BABA) ripped higher from late August and topped near $190 in early October. Since then, price has been correcting inside a descending channel while holding above the 60-day moving average. Short-term momentum has cooled (MACD histogram negative), but the broader structure remains constructive: buyers defended the $158.00 demand zone and price is compressing toward the channel’s upper boundary.
Primary path: I’m looking for a daily close above ~$171.00 (break and hold over the channel top / short-term resistance) to signal a continuation of the prior uptrend. If confirmed with rising volume, the next waypoint sits near the upper band/near-term supply around $175.00–$180.00, followed by a retest of the October highs into $190.00–$191.50. That area remains the key supply zone where the last rally stalled.
Alternative: If buyers fail and $158.00 gives way, the corrective leg likely extends. A decisive break of that floor would put the lower channel line in play and opens room toward the next major support clustered around the 120-day context near $140.00. For positioning, longs can lean on $158.00 as the clean invalidation; below there, the bullish thesis is off the table.
This is a study, not financial advice. Manage risk and invalidations

ALIBABA HIGH PROBABILITY SETUP SOON!!!🚨 BABA HIGH PROBABILITY BUY SETUP 🚨
* Here We Can See Clearly The Next Potential Moves For BABA Coming Hours/Days.
* Keep Your Eyes Close On Your Trading Positions.
* Happy PIP Hunting Traders.
FXKILLA.

Alibaba Weekly Elliot Waves AnalysisBABA is currently in Wave 5. I believe BABA Wave 5 will be an ABC correction. With that being said, I expect a relief pump (wave B) to happen which will last for 1-2 weeks before we continue dumping. I have buy orders set for $85/$86 and at worse, $58. $100 support looks weak based on the lower Fibonacci targets. Be diligent with this one!
(Side Note: Wave 1 was also an ABC correction which is why the last wave will be similar to the first.)
You can learn more about this analysis by researching ABC corrections and Zigzags. Thank you!

BABA Perfect long positionNYSE:BABA is at a strong level ahead of its next upcoming earnings, I am looking for it to continue within its already formed parallel channel on the weekly chart. The daily shows a strong rejection of its 50ema, consequently breaking a previous swing high. the break indicates possibility of bullish momentum through the level. The current consolidation phase into the long term trend and the consolidation occurring on the long term volume profile POC, all act as positive confluence to the general idea of a mid-long term buy position on BABA. CN50 is also showing great strength on the monthly chart, which is a great confluence with BABA's overall performance.
Constriction of Bollinger daily bands is an added confluence, indicating the potential for increased volatility and a large move to come out of this consolidation phase in the near term.
I have entered a large long position, with stops shown at levels shown on chart to allow the trade to breath in the midst of unexpected volatility around earnings etc. Stops and tp may be adjusted as conditions change.
Goodluck trading ;)
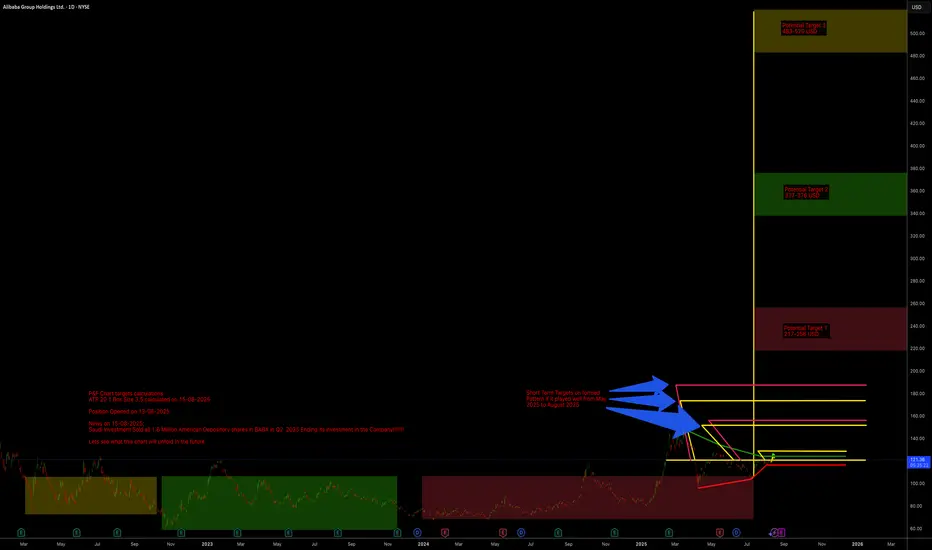
Ali BABA Potential Huge Up Targets ALi BABA have Potential Huge Up Targets with potential 3 years accumulation range from March 2022 to today 15 August 2025.
P&F Chart targets calculations
ATR 20 1 Box Size 3.5 calculated on 15-08-2025
Position Opened on 13-08-2025
News on 15-08-2025:
Saudi Investment Sold all 1.6 Million American Depository shares in BABA in Q2 2025 Ending its investment in the Company!!!!!!!
Lets see what this chart will unfold in the future
BABA: triangle with tensionOn the weekly chart, BABA has already formed a golden cross - price is above both MA50 and MA200, confirming a bullish trend shift. The stock is now approaching the upper edge of the symmetrical triangle and the key resistance at $122, which also aligns with the 0.5 Fibonacci level.
The numbers inside the triangle represent the contraction phases, not Elliott waves. This is a classical consolidation before a potential breakout. If the $122 level is broken and retested, upside targets are $128 (0.618), $137 (0.786), and eventually $148–181 (1.0–1.618 extension).
Volume is rising, MACD is flipping bullish, and RSI is climbing out of oversold territory — all signs point to growing bullish momentum.
Fundamentally, Alibaba benefits from China's economic rebound, possible regulatory relief, and ongoing share buybacks. With Chinese tech rotating back into favor, BABA could lead the rally.
So if you're still waiting for a signal - it's already here. The golden cross is done, price is flying above moving averages, and all that’s left is a clean breakout. Watch $122 — that’s the launchpad.

Alibaba probably near “bottom”. 19/Oct/22As Alibaba previous long term impulsive move was a “leading diagonal” pattern. So there is high “possibility” that its stock price “might hold” above 57.20..

Alibaba - Here we have the final bottom!🏮Alibaba ( NYSE:BABA ) finally created its bottom:
🔎Analysis summary:
As we are speaking, Alibaba finally managed to create a long term bottom formation. Specifically with the recent bullish break and retest, bulls are picking up momentum. We just have to see a break above the current key resistance level in the foreseeable future!
📝Levels to watch:
$140
SwingTraderPhil
SwingTrading.Simplified. | Investing.Simplified. | #LONGTERMVISION

BABA Alibaba Group Holding Limited Options Ahead of EarningsIf you haven`t bought the dip on BABA:
Now analyzing the options chain and the chart patterns of BABA Alibaba Group Holding Limited prior to the earnings report this week,
I would consider purchasing the 135usd strike price Calls with
an expiration date of 2025-9-19,
for a premium of approximately $14.25.
If these options prove to be profitable prior to the earnings release, I would sell at least half of them.

$190 -$200 a possible level for BABA$190 -$200 a possible level for BABA.
I woke up to the news of possible collaboration between Alibaba and Nvidia AI collaboration.
With the AI demand and this news, I think the fundamental is great.
Technically, I will be looking at BABA pushing towards $190 zone, or to a psychological level of $200.
Remail positive and trade with care
Bullish pennant on the hourlyAfter a huge rally on alibaba it is not over yet, hedgefunds are rising price targets and alibaba is currently forming a bullish pennant on the hourly time frame getting close to breakout

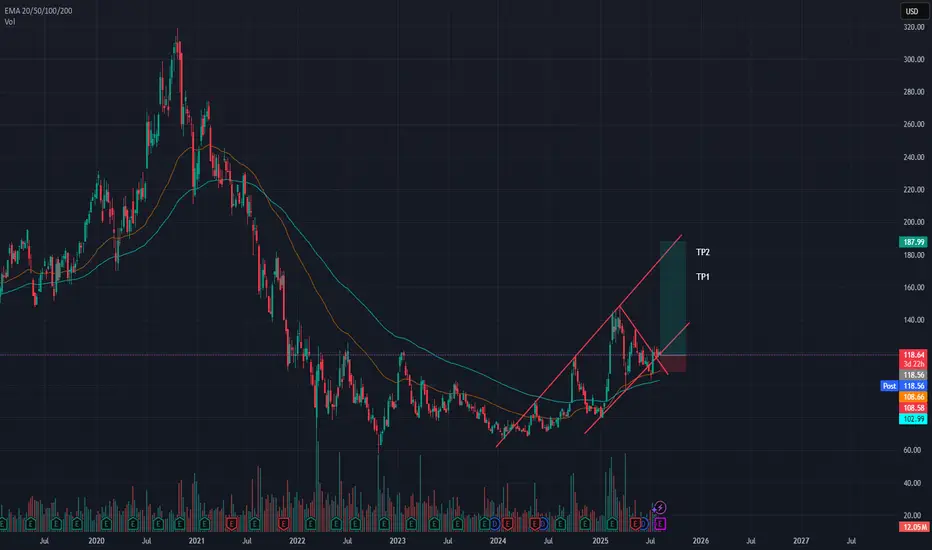
Alibaba | BABA | Long at $108.84Like Amazon, I suspect AI and robotics will enhance Alibaba's NYSE:BABA e-commerce, logistics, and cloud computing operations. There is some risk here, like other Chinese stocks, that they could be delisted from the US market if trade/war tensions rise. But I just don't think that is likely (no matter the threats) due to the importance of worldwide trade and investment. I could be way wrong, though...
NYSE:BABA has a current P/E of 14.2x and a forward P/E of 2x, which indicates strong earnings growth ahead. The company is very healthy, with a debt-to-equity of 0.2x, Altmans Z Score of 3.3, and a Quick Ratio of 1.5. If this were a US stock, investors would have piled in long ago at the current price.
From a technical analysis perspective, the historical simple moving average (SMA) band has started to reverse trend (now upward), indicating a high potential for continued (overall) price movement up. It is possible, however, that the price may reenter the SMA band in the near-term - the $80s aren't out of the question - as tariff threats arise. But that area is another personal entry zone if fundamentals hold.
Thus, while it could be a bumpy ride and the risk is there for delisting, NYSE:BABA is in a personal buy zone at $108.84 (with known risk of drop to the $80s in the near-term).
Targets into 2028:
$125.00 (+14.8%)
$160.00 (+47.0%)

Why BABA Alibaba Could Rebound Strongly by Year-End 2025If you haven`t bought BABA before the recent rally:
What you need to know:
BABA’s fundamentals, fueled by e-commerce, cloud, and AI, support its technical bullishness:
E-commerce and Cloud Rebound:
Q1 2025 revenue grew 7% year-over-year, with Taobao/Tmall rebounding and cloud revenue surging due to AI demand.
Alibaba’s cloud division, China’s largest, benefits from hyperscaler AI workloads, with 15% profit margin projections by 2029.
AI Leadership:
BABA’s AI assistant and generative AI tools drove a 70% stock surge in early 2025, positioning it as a leader in China’s AI race.
At 12x forward P/E with 8% revenue CAGR, BABA is undervalued (fair value ~$162).
Share Buybacks:
Aggressive share repurchasing (6% annual reduction) boosts EPS, with $1 trillion GMV reinforcing e-commerce dominance.
Macro Tailwinds:
Easing CCP regulations and China’s stimulus measures (e.g., rate cuts) support BABA’s rally.
Minimal U.S. exposure insulates BABA from trade war risks.
Conclusion: BABA’s Path to $168
BABA’s technicals, with a bullish breaker and wedge, signal a breakout above $125–$130, targeting $150–$168 by year-end 2025. Fundamentally, its e-commerce dominance, cloud/AI growth, and undervaluation make it a standout. Traders should buy dips near $110–$115 or await a $130 breakout. With stimulus and buybacks as catalysts, BABA is set to soar.
Disclosure: I am part of Trade Nation's Influencer program and receive a monthly fee for using their TradingView charts in my analysis.

BABA Alibaba Options Ahead of EarningsIf you haven`t bought BABA before the rally:
Now analyzing the options chain and the chart patterns of BABA Alibaba Group Holding Limited prior to the earnings report this week,
I would consider purchasing the 135usd strike price Calls with
an expiration date of 2026-3-20,
for a premium of approximately $10.50.
If these options prove to be profitable prior to the earnings release, I would sell at least half of them.
Disclosure: I am part of Trade Nation's Influencer program and receive a monthly fee for using their TradingView charts in my analysis.

BTCUSDT.P 1D Time frameMarket Overview
Current Price: ~$112,380
Daily Change: Slight dip (around –0.3%)
Volatility: At multi-month lows, meaning the market is consolidating before a possible breakout.
📈 Key Levels
Immediate Resistance: $112,800 → price needs to clear this for upside continuation.
Next Resistance Zones: $114,000 → $116,000, and further up around $128,000.
Immediate Support: $111,000 → first cushion below current price.
Deeper Support: $110,000, then $107,800–108,000.
🔎 Technical Indicators
RSI (14-day): ~43 → Neutral, showing neither overbought nor oversold conditions.
MACD: Bullish crossover → suggests upward momentum is building.
Stochastic Oscillator: Near oversold → possible short-term bounce.
🧭 Outlook
Bullish Case: A sustained breakout above $114,000 could open a rally toward $128,000.
Sideways Case: Holding between $111,000 and $113,000 keeps Bitcoin in consolidation.
Bearish Case: A break below $110,000 could trigger a move toward $108,000 or even $102,000.
Overall Bias: Moderately bullish, but the market is in a tight range and waiting for a breakout.

MSFT 1D Time frameMarket Snapshot
Current Price: ~$498.41
Daily Change: +0.23 (≈0.05%)
Market Cap: ~$2.79 Trillion
P/E Ratio: ~28.9
EPS: ~12.93
🔎 Technical Indicators
RSI (14-day): ~41 → Neutral, leaning slightly bearish.
MACD: –2.7 → Negative but giving a weak buy crossover signal.
Williams %R (14-day): ~–74 → Suggests a possible rebound (buy).
CCI (14-day): ~–108 → Oversold zone, buy indication.
ADX (14-day): ~20.6 → Weak trend strength.
ROC (Rate of Change): –3.5 → Mild bearish momentum.
📈 Moving Averages
5-day MA: Below current price → Bearish short-term.
20-day MA: Below current price → Bearish.
50-day MA: ~$509, above price → Acting as resistance.
100-day MA: ~$476, below price → Supportive.
200-day MA: ~$443, below price → Long-term uptrend still intact.
🔧 Support & Resistance
Support Zone: ~$491 – $497
Resistance Zone: ~$500 – $510
📅 Outlook
Bullish Case: If MSFT climbs above $509–510, momentum could extend toward new highs.
Bearish Case: A break below $491 may lead to a pullback toward $480–485.
Overall Bias: Neutral to slightly bearish in the short term, but long-term bullish trend remains intact above the 200-day MA.
