ALI BABA HIGH PROBABILITY SETUP SOON!!!🚨 BABA HIGH PROBABILITY BUY SETUP 🚨
* Here We Can See Clearly The Next Potential Moves For BABA Coming Hours/Days.
* Keep Your Eyes Close On Your Trading Positions.
* Happy PIP Hunting Traders.
FXKILLA.
Alibabatradingsetup

ALIBABA HIGH PROBABILITY SETUP SOON!!!🚨 BABA HIGH PROBABILITY BUY SETUP 🚨
* Here We Can See Clearly The Next Potential Moves For BABA Coming Hours/Days.
* Keep Your Eyes Close On Your Trading Positions.
* Happy PIP Hunting Traders.
FXKILLA.

BABA Perfect long positionNYSE:BABA is at a strong level ahead of its next upcoming earnings, I am looking for it to continue within its already formed parallel channel on the weekly chart. The daily shows a strong rejection of its 50ema, consequently breaking a previous swing high. the break indicates possibility of bullish momentum through the level. The current consolidation phase into the long term trend and the consolidation occurring on the long term volume profile POC, all act as positive confluence to the general idea of a mid-long term buy position on BABA. CN50 is also showing great strength on the monthly chart, which is a great confluence with BABA's overall performance.
Constriction of Bollinger daily bands is an added confluence, indicating the potential for increased volatility and a large move to come out of this consolidation phase in the near term.
I have entered a large long position, with stops shown at levels shown on chart to allow the trade to breath in the midst of unexpected volatility around earnings etc. Stops and tp may be adjusted as conditions change.
Goodluck trading ;)
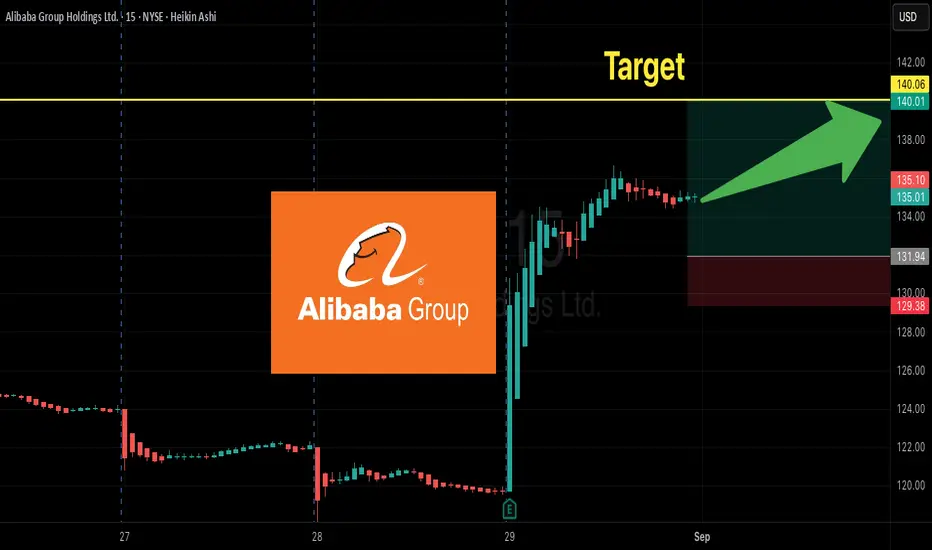
Alibaba - Here we have the final bottom!🏮Alibaba ( NYSE:BABA ) finally created its bottom:
🔎Analysis summary:
As we are speaking, Alibaba finally managed to create a long term bottom formation. Specifically with the recent bullish break and retest, bulls are picking up momentum. We just have to see a break above the current key resistance level in the foreseeable future!
📝Levels to watch:
$140
SwingTraderPhil
SwingTrading.Simplified. | Investing.Simplified. | #LONGTERMVISION

BABA About to EXPLODE—Weekly 140C Play—Don’t Miss Out
# 🐂💎 BABA WEEKLY OPTIONS ALERT (2025-09-01) 🚀📈🔥
### 📊 Multi-Model Consensus → **STRONG BULLISH**
* ✅ **Momentum:** RSI Daily 71 / Weekly 74 📈
* ✅ **Volume Surge:** 🔺 2.9x last week → Institutions loading bags 👜
* ✅ **Options Flow:** Calls ≈ 2.84x puts 💥
* ✅ **Volatility:** VIX \~15.3 → perfect for calls 🎯
---
### 🎯 Recommended Trade (Consensus Pick)
👉 **BABA 140C (2025-09-05)**
💵 Entry: \~\$1.59
🛑 Stop: \$0.95 (-40%)
🎯 Target: \$2.39 (+50%)
📏 Size: 1 contract (risk-adjust)
⏰ Entry: Market open
🔥 Confidence: 85%
---
### ⚡ Aggressive Play (OTM)
👉 **BABA 145C (\~\$0.84)**
⚡ Higher leverage, stronger flow, but faster theta decay ⏳
---
### 🕒 Risk & Exit Plan
* Close **by Thursday EOD** 🗓️ (avoid Friday theta/gamma trap)
* Stick to stop-loss & risk sizing 💡
* Watch for profit-taking after +9.8% last week 📉
---
📌 **Trade JSON (for algo/backtest nerds 🤓)**
```json
{
"instrument": "BABA",
"direction": "call",
"strike": 140.0,
"expiry": "2025-09-05",
"confidence": 0.85,
"profit_target": 2.39,
"stop_loss": 0.95,
"size": 1,
"entry_price": 1.59,
"entry_timing": "open",
"signal_publish_time": "2025-09-01 22:19:55 EDT"
}
```
---
\#️⃣ **Hashtags / Tags**
\#BABA #OptionsTrading #FlowTrading #StockMarket 🚀📈🔥
\#UnusualOptionsActivity #SwingTrade #TradingSignals #SmartMoneyFlow
\#CallOptions #WeeklyOptions #ChinaStocks
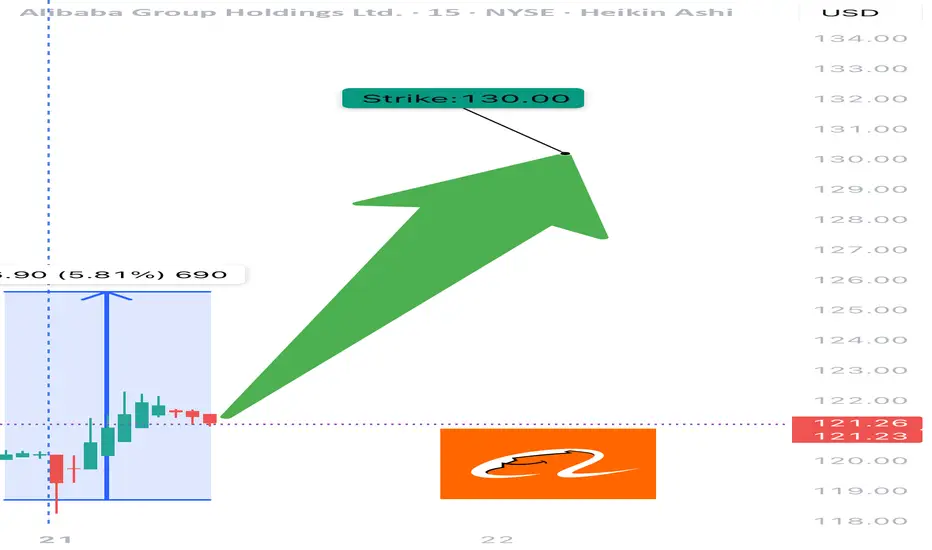
BABA Earnings Play---Don’t Miss Out
# 🚀 BABA Earnings Play (8/28 AMC) 🚀
💎 **Moderate Bullish | 72% Conviction** 💎
🎯 **Trade Setup**
📊 Ticker: \ NYSE:BABA
🔀 Direction: CALL 📈
🎯 Strike: 130.00
📅 Expiry: 2025-08-29
💵 Entry: 0.83 (ASK)
⏰ Timing: Pre-earnings close (8/28 AMC)
📦 Size: 1 contract (risk 💸 \$83)
🎯 Target: 2.49 (200%)
🛑 Stop: 0.42 (-50%)
⚡️ **Why Bullish?**
* 📈 Strong margins & FCF cushion
* 🔥 Call OI stacked at \$125–130 (gamma fuel)
* 📊 Price above key MAs, neutral RSI → upside ready
* 🌎 Macro risk still there, but market tilt is bullish
✅ **Execution Rule**: In before close, out within 2h post-print or at target/stop.
---
### 📌 Suggested Tags (TradingView-style)
\#BABA #Alibaba #EarningsPlay #OptionsTrading #CallOptions #WeeklyOptions #BullishSetup #MomentumTrading #TradeIdeas #StockMarket 🚀📊

Alibaba - This chart is pretty bullish!🎁Alibaba ( NYSE:BABA ) will head much higher:
🔎Analysis summary:
After we saw the perfect creation of the rounding bottom on Alibaba, the trend finally shifted back to bullish. Especially with the recent bullish break and retest, Alibaba is now preparing for another major move higher. All we need now is simple bullish confirmation.
📝Levels to watch:
$140
SwingTraderPhil
SwingTrading.Simplified. | Investing.Simplified. | #LONGTERMVISION

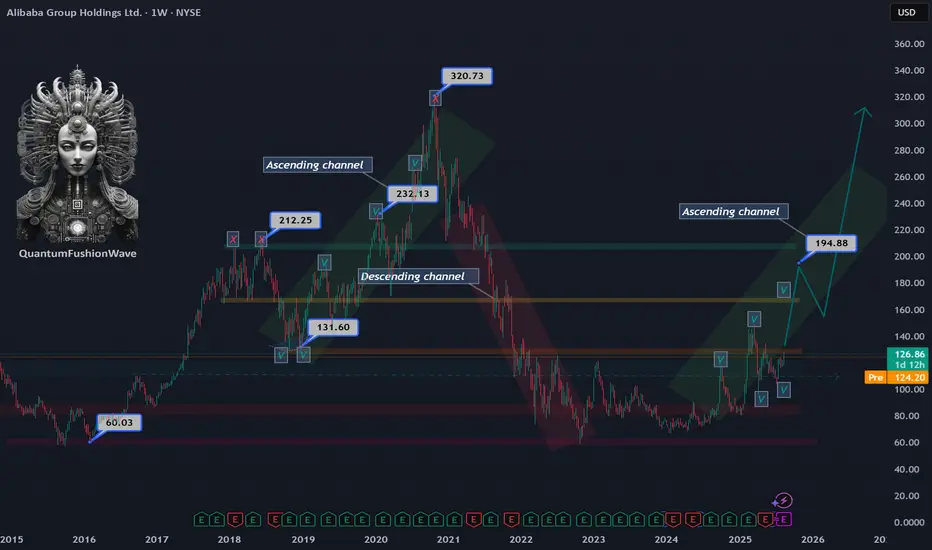
Alibaba’s Next Stop: $200Alibaba (BABA) is showing clear signs of strength as it trades around $126, confirming entry into a new bullish channel.
The stock rejected further downside at $95, a level that aligns with major resistance-turned-support zones from 2016, 2023, and 2024. This successful defense signals that market sentiment has shifted, laying the groundwork for a sustained move higher.
If momentum holds, BABA could rally aggressively into the $190–$200 range by November–December 2025, where a significant resistance zone from 2018 awaits.
Alibaba - A remarkable reversal!🛒Alibaba ( NYSE:BABA ) reversed exactly here:
🔎Analysis summary:
Recently Alibaba has perfectly been respecting market structure. With the current bullish break and retest playing out, there is a very high chance that Alibaba will rally at least another +20%. But all of this chart behaviour just looks like we will witness a major bottom formation soon.
📝Levels to watch:
$110, $135
🙏🏻#LONGTERMVISION
Philip - Swing Trader

BABA WEEKLY TRADE IDEA – JULY 21, 2025
🐉 NYSE:BABA WEEKLY TRADE IDEA – JULY 21, 2025 🐉
📈 Strong RSI. Institutional Accumulation. Gamma-juiced upside.
Momentum is building — timing is key.
⸻
📊 Trade Setup
🔹 Type: Long Call
🎯 Strike: $130.00
📆 Expiry: July 25, 2025 (4 DTE)
💰 Entry Price: $0.52
🎯 Profit Target: $0.74 (📈 +42%)
🛑 Stop Loss: $0.30 (~40% Risk)
📈 Confidence: 70%
🕰️ Timing: Enter at Monday Open
📦 Size: 1 Contract (or scale accordingly)
⸻
🔍 Why This Trade?
✅ Daily RSI = 68.3 → Bullish momentum building
✅ Volume = 1.3x week-over-week → Institutional buying confirmed
📊 Neutral Call/Put Flow → Sentiment not overheated = better entry
🧠 Multiple models agree on MODERATE BULLISH bias
🌬️ VIX stable = ideal for controlled option premium entries
💎 Gamma risk manageable, but monitor price spikes at resistance near $130–132
⸻
⚠️ Risk Management Notes
🔸 RSI near breakout zone → monitor for fakeouts
⏳ Only 4 days to expiry → time decay risk accelerates
📉 Watch for rejection near key levels ($130.50–132.00)
🛑 Respect the stop: If momentum stalls early, exit fast
⸻
📌 Execution Strategy
🔹 Enter clean, single-leg naked call
🔹 Exit partial at 30% profit, full by Thursday unless breakout is strong
🔹 Avoid spreads: delta exposure preferred for upside spike capture
⸻
🏁 Verdict:
All models point to upside, but not full conviction.
This is a momentum + positioning trade, not a breakout gamble.
NYSE:BABA 130C – Risk $0.30 to Target $0.74 📈
Tight structure. Moderate aggression. Execute with precision.
⸻
#BABA #OptionsTrading #CallOption #WeeklyTrade #MomentumPlay #UnusualOptionsActivity #TradingViewIdeas #GammaFlow #FlowBasedSetup #Alibaba
Alibaba (BABA) Shares Fall to Lowest Level in 2.5 MonthsAlibaba (BABA) Shares Fall to Lowest Level in 2.5 Months
Yesterday, Alibaba (BABA) shares dropped to their lowest level since late April. The decline followed the company’s announcement of a planned bond issuance totalling approximately $1.53 billion, with a maturity date set for 2032. The funds will be used to support the development of Alibaba's cloud infrastructure and expansion of its international e-commerce business.
The market’s negative reaction may stem from concerns over rising debt levels and the potential return on these investments.
Technical Analysis of Alibaba (BABA) Share Price
When analysing the price movements of BABA shares in 2025, two key trading ranges stand out:
→ $126–145: This range originates from the long bullish candle on 20 February, following the release of a strong quarterly report;
→ $96–103: This zone was established in late April, as supply and demand stabilised around the psychologically significant $100 level.
The upper range has since acted as a resistance zone, with the price reversing from it in mid-May. The lower range has served as a support area, particularly in early April when the stock came under pressure after tariff-related headlines.
The current price action is notable in that Alibaba shares have:
→ Broken through the June support level at approximately $111.92;
→ Formed a bearish A-B-C structure, marked by lower highs and lower lows.
Using Fibonacci extension analysis, we can reasonably assume:
→ The $111.92 level is now likely to act as resistance;
→ The next potential target for the ongoing downtrend (leg C→D) lies at the 1 Fibonacci level ($100.55) — aligning closely with the previously identified support zone.
This article represents the opinion of the Companies operating under the FXOpen brand only. It is not to be construed as an offer, solicitation, or recommendation with respect to products and services provided by the Companies operating under the FXOpen brand, nor is it to be considered financial advice.

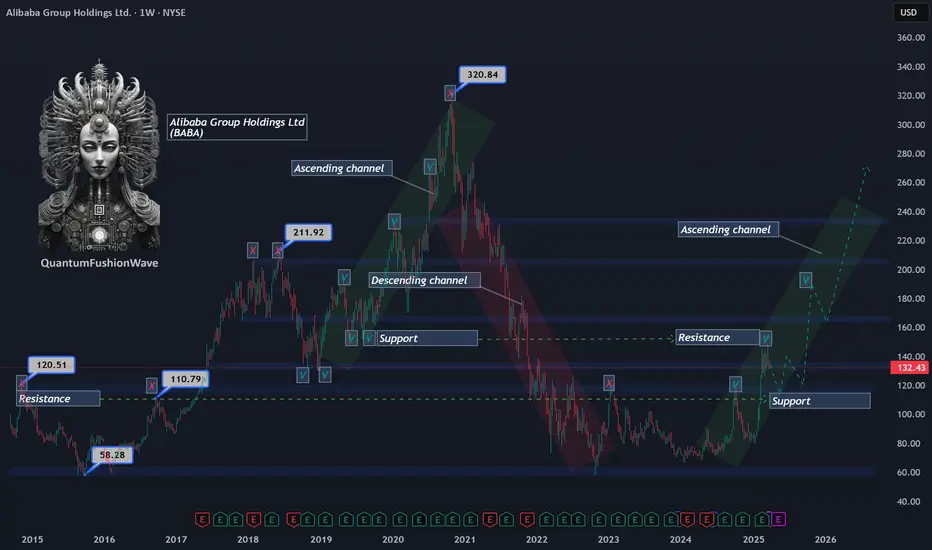
Alibaba (BABA) Technical Analysis:Retracement Within an Ascending Channel
Alibaba (BABA) has faced strong supply pressure at $149, a key price level that previously acted as support in 2019 and has now flipped into resistance. The inability to reclaim this level has triggered a retracement, with the stock currently trading around $132, showing signs of continued corrective movement.
Despite the short-term weakness, BABA remains within a developing ascending channel, suggesting a potential higher timeframe bullish structure. If the retracement extends, the next significant level to watch is $110, a historical 2016 resistance level that could now act as a demand zone. A strong reaction and rejection from this level would reinforce the validity of the ascending channel and increase the probability of a trend continuation toward previous all-time highs.
Key Levels to Watch:
Resistance: $149 (2019 support turned resistance)
Current Price: $132 (active retracement zone)
Support Levels:
$110 – Historical resistance from 2016, potential demand zone
$100 – Psychological level, further downside risk
Traders should monitor price action around these key levels, as a confirmed breakdown below $110 could invalidate the channel and shift market structure to a more bearish outlook, while a strong bounce could provide a high-probability long setup within the channel’s framework.
I'm GAGA for BABA!NYSE:BABA
🎯134🎯150🎯171
Five weeks of green candles for over 55%!
Road this one higher from the beginning and fully exited. Now that we are pretty extended and broke out of the Inverse H&S Pattern I'd like to see a pullback to retest the breakout at $115-118 for an entry back in.
- Green H5
- Volume GAP
- Wr% Up trending
- Inverse H&S breakout
- China has momentum (look for tariff news or earnings this week to provide a dip buying opp.)
Not financial advice

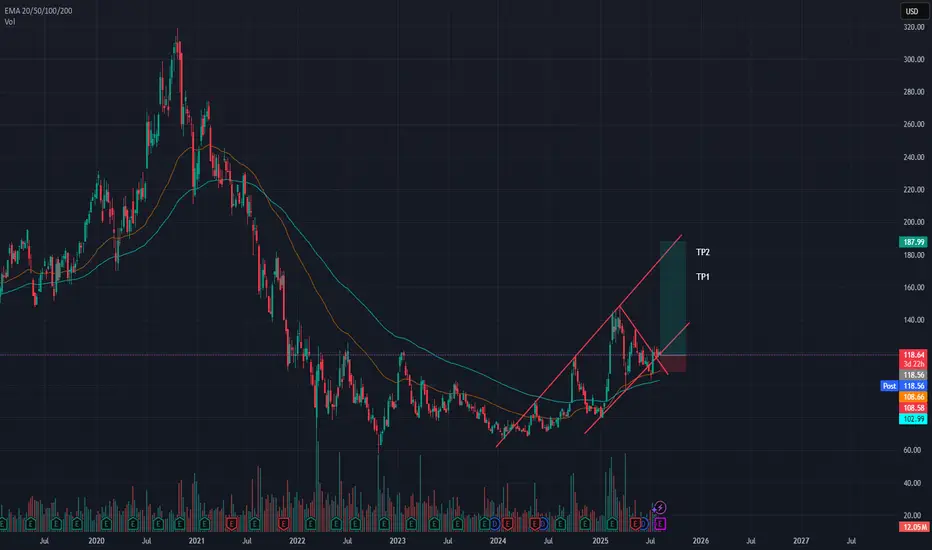
Alibaba - with Eyes on $200–$230 by end of 2025Alibaba (BABA): Entering a Bullish Phase
Alibaba (BABA) has officially entered a bullish phase after successfully holding the $80 support level at the beginning of 2024. This strong rejection set the stage for a rally to $127, confirming the start of an uptrend.
Key Resistance Battle: Breaking $130 with Ease?
The next critical price level to watch is $130, last seen in November 2018.
If Alibaba breaks through $130 without effort, this will confirm strong bullish momentum, allowing the stock to continue climbing.
However, if BABA initially fails to break $130, it could trigger a pullback to $108, offering a new entry opportunity before the next leg up.
Long-Term Target: $200–$230 by Late 2025
Phase 1: If Alibaba retests $108 and successfully holds, it will make another attempt to break $130.
Phase 2: Once $130 is broken, BABA will gradually climb to $200 by the end of 2025, following a steady growth pattern without rapid acceleration.
Bullish Catalyst Scenario: If news flow remains favorable, Alibaba could push even higher, targeting $230 by the end of 2025.
Key Price Levels to Watch:
Support: $108 (potential pullback zone if $130 is rejected).
Resistance 1: $130 (major breakout level).
Resistance 2: $200 (main target by year-end 2025).
Bullish Extension: $230 (if market sentiment remains strong).
Summary: Strong Bullish Structure with Potential Upside
Alibaba’s price action suggests a clear uptrend, with $130 being the next major battle zone. If it breaks with ease, expect a smooth climb toward $200 by 2025. If it faces rejection, a pullback to $108 will offer a new buying opportunity before resuming the uptrend.
Should favorable news emerge, Alibaba could even hit $230 by the end of 2025, reinforcing its long-term bullish outlook.

ALIBABA Ready to Explode! Big Gains on the Horizon!Alibaba (BABA) Technical Analysis - 15-Minute Timeframe - Long Position Setup
Entry Price: $99.13
Stop Loss (SL): $97.32
Target Levels:
TP1: $101.36
TP2: $104.96
TP3: $108.57
TP4: $110.80
Market Context and Sentiment: Recent developments indicate strong institutional interest in Alibaba, as evidenced by prominent fund manager Zhang Kun making Alibaba a substantial holding in his portfolio. This investment has bolstered positive sentiment around Alibaba, further supported by strategic economic measures favoring leading tech stocks in China.
Technical Indicators:
Trend Direction: Positive momentum is observed with price action above the Risological Dotted Trendline, signaling a bullish bias.
Volume: Current volume at 16.04M aligns with the recent positive market sentiment, with average 30-day volume standing at 26.70M. This moderate volume increase reinforces the long setup validity.
Analysis and Outlook: This setup presents a well-defined long entry with clear stop loss and target levels. The bullish institutional interest provides a strong fundamental tailwind, which could drive price action towards initial and extended targets. Should the price break through TP1 at $101.36 with sustained volume, a continuation towards TP2 at $104.96 becomes likely, with potential progression to TP3 and TP4.
Conclusion: Alibaba's current price action and market sentiment create a favorable environment for a long position. Close monitoring is advised, particularly as price approaches each target, with adjustments as necessary to secure gains.

Alibaba's Slide Continues! Three Targets Hit, Awaiting Final TP4Technical Analysis: Alibaba – 15-Minute Timeframe (Short Trade)
Alibaba has shown strong bearish momentum, hitting three profit targets after a clear short entry at 108.26. The price is now approaching the final target (TP4), making this trade highly successful so far.
Key Levels
Entry: 108.26 – The short trade was initiated after confirming a clear bearish setup.
Stop-Loss (SL): 109.65 – Positioned above resistance to manage risk and protect against potential reversals.
Take Profit 1 (TP1): 106.53 – Successfully reached, confirming the start of a strong downtrend.
Take Profit 2 (TP2): 103.73 – Continued bearish pressure pushed the price to this level.
Take Profit 3 (TP3): 100.94 – A further downside target that has already been achieved.
Take Profit 4 (TP4): 99.21 – The ultimate target, currently awaiting completion as the bearish trend continues.
Trend Analysis
The price remains below the Risological Dotted trendline, confirming a strong downtrend. With three profit targets already hit, the market appears poised to reach the final target at 99.21 if bearish momentum persists.
The short trade on Alibaba has been highly successful, hitting TP1, TP2, and TP3, with the final target TP4 in sight. The continued downward movement suggests that 99.21 could be reached shortly, concluding the trade profitably.

Alibaba - Don't forget chinese stocks!Hello Traders and Investors, today I will take a look at Alibaba.
--------
Explanation of my video analysis:
Back in 2020 Alibaba stock created a textbook breakout of an ascending triangle formation which was followed by more continuation towards the upside. Then Alibaba stock topped out in 2021 and we saw a massive decline of -80% from the previous highs. At the moment Alibaba is still in a very bearish market but there is a chance that we will see a reversal in the near future.
--------
Keep your long term vision,
Philip (BasicTrading)

Alibaba - Trading opportunity is finally there!Hello Traders and Investors, today I will take a look at Alibaba .
--------
Explanation of my video analysis:
Almost a decade ago Alibaba stock retested a strong support at the psychological $60 level and reversed significantly towards the upside. Just a couple of months ago Alibaba stock once again retested this support and created an anticipated reversal. If Alibaba stock actually manages to break above the current resistance trendline, we could maybe see a similar rally like we saw in 2015 and the following years.
--------
Keep your long term vision,
Philip (BasicTrading)

Break down on technicals for Alibaba near historical lowsHi Guys. As always, heres a macro chart setup i've found to be a MUST WATCH, at the very least if not a potential long.
Analysis done on 1 week, indicating a macro analysis.
Alibaba (BABA), at current prices is roughly 75% from its blow off top in 2020.
Around October- November 2022, we tested support at the historical bottom and bounced to test the Resistance zone with a REJECTION.
Bringing us to our current price action where we have managed to maintain a HIGHER LOW.
This supports the idea that perhaps trend is shifting towards BABA wanting to move UP.
Notice also the Blue, Green and Purple Moving averages, Flattening out. This can be an indication that price is showing demand after moving averages moved down so much from the highs.
look for curve up in MA with crosses happening. This would be significantly supportive of probabilities we see Uptrend.
Essentially the order from top to bttom we want to see is:
1. Purple on top
2. Green next
3. Blue below that
4. Red below all
This is an indication of a Bull cycle. As you can see blatantly in previous history.
Notice also Volume which has been steadily increasing since 2019. Maintainence of Higher lows on Volume is also a good sign, that perhaps BABA may rally if we continue this volume trend.
__________________________________________________________________________________
Thank you for taking the time to read my analysis. Hope it helped keep you informed. Please do support my ideas by boosting, following me and commenting. Thanks again.
Stay tuned for more updates on BABA in the near future.
If you have any questions, do reach out. Thank you again.
DISCLAIMER: This is not financial advice, i am not a financial advisor. The thoughts expressed in the posts are my opinion and for educational purposes. Do not use my ideas for the basis of your trading strategy, make sure to work out your own strategy and when trading always spend majority of your time on risk management strategy.

Alibaba - Buy The DipHello Traders, welcome to today's analysis of Alibaba.
--------
Explanation of my video analysis:
Starting in 2016 Alibaba created a pretty obvious higher timeframe bullish reversal which was followed by a crazy bullrun on Alibaba stock. In 2021 Alibaba broke below a major bullish trendline and dropped more than -70%. If we see another bullish reversal at the $65 level and a break above the trendline mentioned in the analysis, I am looking for bullish trading setups.
--------
I will only take a trade if all the rules of my strategy are satisfied.
Let me know in the comment section below if you have any questions.
Keep your long term vision.

Alibaba (BABA) -> This After -80%My name is Philip, I am a German swing-trader with 4+ years of trading experience and I only trade stocks , crypto , options and indices 🖥️
I only focus on the higher timeframes because this allows me to massively capitalize on the major market swings and cycles without getting caught up in the short term noise.
This is how you build real long term wealth!
In today's anaylsis I want to take a look at the bigger picture on Alibaba.
For me personally it was quite impressive that Alibaba stock dropped more than 80% after the massive 400% increase from 2015 to 2020.
Recently Alibaba stock retested and already rejected the previous all time low of 2015 and I think that it is just a matter of time until we will see a monthly bullish break of structure.
- - - - - - - - - - - - - - - - - - - -
I know that this is a quite simple trading approach but over the past 4 years I've realized that simplicity and consistency are much more important than any trading strategy.
Keep the long term vision🫡

BABA Chinese government reshuffle spooks investorsSHORT
The Alibaba (BABA) share price has struggled so far in 2022, falling by 44.7% year-to-date (YTD).
Chinese e-commerce and technology sectors are facing fresh challenges: The Nasdaq Golden Dragon index, which tracks US-listed shares in Chinese companies, shed a record 14% following announcements that Xi Jinping has extended his rule to a third term as president – and filled senior government roles with party loyalists. In the 24 hours following the announcement, Alibaba fell 18%.
The Hang Seng Index also fared dismally, dropping 1,030 points to a 13-year low, following investor concern that the new government would stifle the economy and private enterprise. With China’s zero-Covid policy now cemented in the near term, along with government support for Vladimir Putin, a bearish sentiment might continue for tech stocks as investors stick to a risk-off mode.
The strict zero-Covid controls implemented by the Chinese government have resulted in lockdowns which have disturbed supply chains and the manufacturing industry.
In an article for CNBC, Antonella Teodoro, senior consultant at MDS Transmodal, said: “China’s zero-Covid approach is impacting production and manufacturers are seeking alternatives to the current ‘factory of the world’.
“Drilling down to the individual commodity groups exported from China, we observe that China has been continuing to lose market share, with Vietnam amongst the countries gaining importance on the international landscape.”
In March, the BABA share price fell below $100 for the first time since 2017. It has since been unable to hold above that level. But the stock had gained value since late May after the company announced its first-quarter earnings report.
The June-quarter earnings report was more positive: Daniel Zhang, chairman and CEO of Alibaba Group, said: “Following a relatively slow April and May, we saw signs of recovery across our businesses in June. We are confident in our growth opportunities in the long term given our high-quality consumer base and the resilience of our diversified business model catering to different demands of our customers.”
Toby Xu, chief financial officer of Alibaba Group, also commented: “Despite the challenges posed by the COVID-19 resurgence, we delivered stable revenue performance year-over-year. We have narrowed losses in key strategic businesses given ongoing improvements in operating efficiency and increasing focus on cost optimisation .
“We recently shared our plan to add Hong Kong as another primary listing venue. By becoming primary listed on both Hong Kong and New York stock exchanges, we aim to further expand and diversify our investor base.”
Is the current share price at a good entry point for investors looking to make an Alibaba stock investment? Has the share price bottomed out or is there potential for it to retreat again?
Historical stock price data shows that BABA dropped by 49% in 2021, ending the year at $118.79 a share, as worries about the Chinese market and a sell-off in technology stocks in the US exerted further downward pressure.
In April last year, the Chinese government fined the company $2.8bn for what the State Administration for Market Regulation said was monopolistic behaviour
The record fine was lower than the market had anticipated and removed some of the uncertainty surrounding the potential penalty that would be imposed. However, a gain in the share price was short-lived and it continued the downward trend that started in October 2020, after hitting its all-time highest stock price of $309.92.
Alibaba announced its December quarter 2021 results on the same day that Russian tanks rolled into Ukraine (24 February 2022), leading to much market upheaval, particularly in the technology sector.
What may also have concerned investors was that its revenue figures represented its slowest quarterly growth rate since going public in 2014. Revenues totalled RMB242.58bn ($38.07bn) in the October-December period, an increase of 10% year-over-year (YoY).

Alibaba stock in chinawe analyze that alibaba stock will be bearish next year due to reducing restrictions due to the Corona pandemic .
we must take care of the resistance made below
we must take of stoploss and take profit targets .
if it likes you dont forget to promote
