HBAR Macro Chart, Wave 2 complete, ATH incoming?CRYPTOCAP:HBAR wave C of 2 ended in the expected area, the 0.786 Fibonacci retracement of wave 1, at a high volume node. This is the altCoin golden pocket where low-caps have the highest probability of reversing from. A long weekly lower wick was left on daily bullish engulfing candles.
If that was wave 1 then wave 3 should be powerful and take price into all-time high and beyond, with targets of the weekly R3-R5 pivots, $0.6-$0.8.
Weekly RSI has a little room to push lower into oversold but also gives it roo to produce a weekly bullish divergence. First target s the weekly pivot at $0.2.
Safe trading
ALT-COIN

SOL, Finding support for a bottom?CRYPTOCAP:SOL took a hit last week on the capitulation event, printing a strong bottoming candle with a long lower wick.
Price has now reached my wave 4 ytarget of the 0.382 Fibonacci retracement at the major High Volume Node support, between the S1 nd S2 pivot.
Daily RSI hit oversold, but with no divergence. The trend remains down, below the daily pivot and daily 200EMA, but could be finding a bottom soon.
Safe trading

AVAX at significant lows, is this the end of AVAX?CRYPTOCAP:AVAX has dropped below its 2021 and 2023 lows without ever attaining a new all-time high. Not good for the bulls.
Weekly RSI still has room to fall, and the next target is the High Volume Node support at $3.49, with no support zones from here until there. This move would likely spell the end of AVAX, after years of weakness.
Weekly pivot and 200EMA is at ~$22 and would need to see that recovered for renewed faith.
Safe trading

AAVE dump may not be over, macro triangle invalidatedCRYPTOCAP:AAVE macro triangle analysis was finally invalidated with the thrust lower. Instead, wave B of an ABC seems to be underway with an initial target of the altCoin golden pocket 0.786 Fibonacci retracement and High Volume Node support, $70.
Weekly RSI has a little room to fall until oversold. There is bullish divergence from July 1st 2024 bottom.
AAVE is again demonstrating its abnormal distribution of price action.
Safe trading

XRP Macro triangle was complete!CRYPTOCAP:XRP
Triangles are patterns found before a terminal move in Elliot Wave theory. We can see 5 waves up on weekly bearish divergence completing that terminal move.
Price is expected to retrace to the triangle EQ after that move. Thats the $0.51 High Volume Node, 60% lower form here.
Don't shoot the messenger.
Safe trading

SOL, holding up well but short term weakness continuesCRYPTOCAP:SOL weekly bearish divergence continues to play out until we get oversold are a bullish divergence to negate. There is room to fall. The running flat is negated and the pattern looks like a normal ABC correction.
Price lost the weekly 200EMA and pivot, bears are in control.
Wave 4 has a terminal target of the 0.38 Fibonacci retracement at $72, where we expect a bottom and move to new highs, $600 target.
I think we are going to see bottoms soon enough. Dumping on a low liquidity Saturday is a suspicious move that could trigger a capitulation event.
Safe trading

HBAR almost at altCoin golden pocketCRYPTOCAP:HBAR hit my short term downside target $0.1 and is heading to the altCoin golden pocket 0.786 Fibonacci retracement, a high probability wave 2 bottoming area for low cap , volatile assets. Vol-70.
This is also a major High Volume Node, $0.7
Weekly RSI is getting oversold but with no divergence.
I think we are going to see bottoms soon enough. Dumping on a low liquidity Saturday is a suspicious move that could trigger a capitulation event.
Safe trading

SOL, uptrend intactCRYPTOCAP:SOL
🎯Price caught a bid moving bullishly above the daily pivot, now being tested as support. Wave 2 of a new motif wave appears to be underway with an inital target of the daily 200EMA.
📈 Daily RSI is back to the EQ, restting quickly. A good sign for bullish continuation.
👉 Analysis is invalidated below wave C, $110
Safe trading

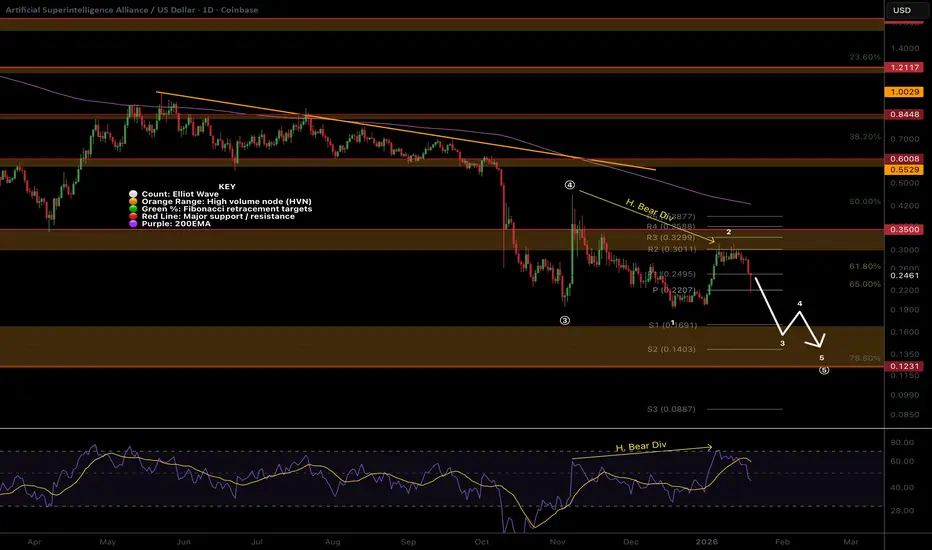
FET looking for new lows, downtrend in tact, h. bear divNYSE:FET
🎯The downtrend is intact, with wave 2 appearing complete. Wave 3 down is strong and hard. Price appears to want to continue lower to test the altCoin golden pocket at 0.786 Fibonacci retracement.
📈 Daily RSI went too high, too fast, and printed hidden bearish divergence at a High Volume node. The rejection was hard and swift.
👉 Analysis is invalidated above wave 2 swing high, $0.3.
Safe trading
ETH, trying to breakout, multiple attempts 200EMA and R1 pivotCRYPTOCAP:ETH
🎯Wave 1 appears to have completed a leading diagonal. Wave 2 appears complete with the recent higher low, but we need to break above wave 1 for confirmation. Price was rejected at the daily 200EMA and R! pivot, but is attempting to break through again. Overcoming this will be very bullish, especially as we are above the daily pivot.
📈 Daily RSI is printed hidden bearish divergence, followed by another bearish divergence. A move above wave (1) is essential to negate this, or prices could head to new local lows.
👉 Analysis is invalidated below wave (2)
Safe trading

AAVE Hidden bearish divergence on the daily playing outEURONEXT:AAVE
🎯 The path from last week’s analysis is being followed, so far. Price printed a bullish engulfing candle breaking above the daily pivot, but was ultimately rejected at the R1 pivot, now testing the daily pivot and High Volume Node as support. The downtrend is intact. The first target for continued upside is the daily 200EMA and High Volume Node resistance at $210. Overcoming the daily 200EMA will add confluence to a major bottom being in. Wave (C) of triangle wave (D) appears to be underway.
📈 Daily RSI printed hidden bearish divergence which is playing out.
👉 Analysis is invalidated if we drop below $148, keeping wave (B) alive.
Safe trading

BNB Short-term analysis | Trading and expectationsCRYPTOCAP:BNB
🎯Price has closed above the daily 200EMA and daily pivot, suggesting a new bull trend has taken hold. If this is wave (3), we should expect a strong breakout in the coming days/weeks towards the all-time high. Wave 4 appears complete, with a textbook ABC correction ending at High Volume Node support.
📈 Daily RSI is currently showing bearish divergence across many altcoins, including BNB. A push above wave (1) will negate this divergence.
👉 Analysis is invalidated below wave (2), daily pivot and 200EMA.
Safe trading

SOL Macro analysis | The bigger picture | Long-term holdersCRYPTOCAP:SOL
🎯 Sol has been holding up significantly well with only a shallow retracement to the 0.382 for wave A of 4. A running flat correction appears complete at the Fibbonaci 0.236, weekly 200EMA and High Volume Node. Wave 5 has a target of the R3 weekly pivot at $462, but I expect this to overextend due to the shallow pullback to the R% pivot at $660.
📈 Price is above the weekly 200EMA, which is bullish, but below the pivot, which is bearish, giving the overall pattern ambiguity. Weekly RSI is bearish with room to fall, but doesn’t often reach oversold.
👉 Analysis is invalidated if price falls below wave A, $90
Safe trading

ETH Macro analysis | The bigger picture | Long-term holdersCRYPTOCAP:ETH
🎯 Wave (IV) appears to have completed a multiyear running flat with weekly bullish divergence. A new motif wave is underway, completing its wave 1 of 5 with a poke above all time high on weekly bearish divergence. Wave 2 appears complete at the 0.5 Fibonacci retracement and High Volume Node support. Wave 3 has a target of the R4 weekly pivot at $7348. Wave 5 could extend towards $10,000.
📈 The retracement has been shallow compared to other alts. Weekly RSI is flipping bullish from below the EQ while price is about to challenge the weekly pivot. Price is above the weekly 200EMA, keeping the bullish trend in tact.
👉 Analysis is invalidated only if we get below$2634, keeping wave 2 alive.
Safe trading

BNB Macro analysis | The bigger picture | Long-term holdersCRYPTOCAP:BNB
🎯 Price completed a macro wave 3 with bearish divergence on the RSI. Wave 4 is expected to end at the 0.382 Fibonacci $640, and can not extend below the 0.5 Fib, $506. Crypto assets can overextend in wave 5, which I believe we will see in 2026, with a terminal target of the R5 weekly pivot target, $2000, a psychological milestone where heaving selling may begin.
📈 Wave 4 is still underway, testing the previous all-time High Volume Node, 0.236 Fibonacci retracement, $760. Weekly RSI is at the EQ, where a bottom was found the previous two times and the price returned to an all-time high.
👉 Analysis is only invalidated if price falls below the 0.5 Fib, $506.
Safe trading

AAVE - Macro analysis | The bigger picture | Long-term holdersEURONEXT:AAVE
🎯 I am still looking at this multiyear triangle to break out to the upside with a terminal target of $670, the all-time High Volume Node resistance. Price is rangebound between $440 and $130 and appears to have completed triangle wave (C). Wave (D) is next, with a target of the upper boundary trend-line ~$340.
📈 Price is below the weekly 200EMA and pivot, reflecting the recent bearish trend, but finding support with bullish divergence in the RSI, suggesting a major bottom is forming. Wave (A) found terminal support at the golden pocket Fibonacci retracement.
👉 Analysis is invalidated below wave (A) or wave (B). This asset has been one of the best assets for trading signals in the last 3 years, sticking to the rules strictly.
Safe trading

ETH hit my downside target now what?Wave 1 appears to have completed a leading diagonal with a poke above all-time high- what we expect from wave 1. Wave 2 is underway, testing the weekly 200EMA so far, and an expected reversal point- also the 0.382 Fibonacci retracement.
The retracement has been shallow, but ETH was beaten down and undervalued, making a shallow pullback expected. The 0.5 Fibonacci retracement is the next downside target at the S1 pivot.
🎯 Terminal target for the business cycle could see prices as high as $9000
📈 Weekly RSI was oversold with bearish divergence and has now reset below the channel EQ.
👉 Analysis is invalidated only if we get below the wave (4) bottom $1365
Safe trading

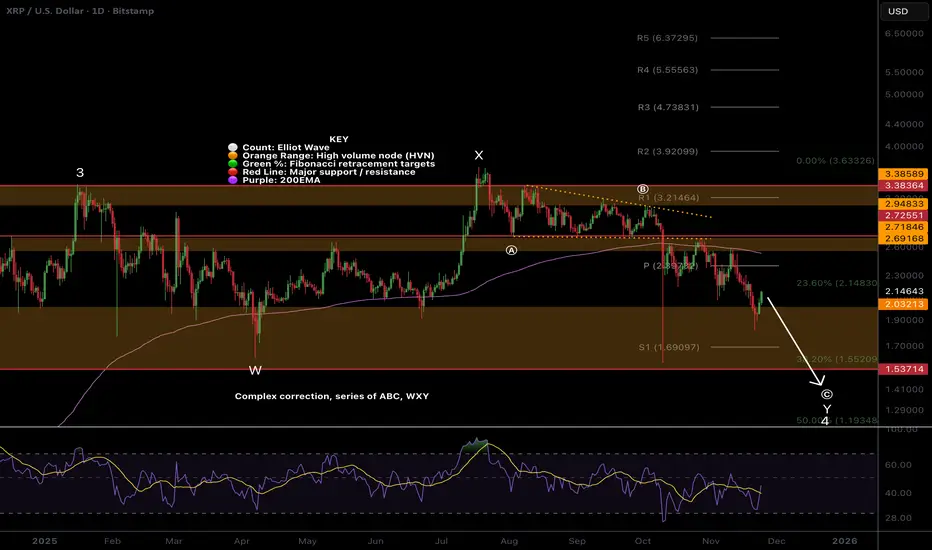
XRP count changed, wave 4 underwayPrice appears to have completed a WXY after the Oct 10th flash crash, but further downside is possible to complete wave 4.
Wave (B) completed a barrier triangle, which suggests the thrust down was the final move before reversal. Price has revisited the wick- expected price behaviour, and we are now looking for a bottom.
Price is below the daily 200EMA and pivot, which is bearish.
📈 Daily RSI reached oversold with no divergences
👉 Continued downside brings up the $1.75 High Volume Node EQ
Safe trading
SUI Dropped hard! More to come?Price accelerated in a downtrend, falling below a major High Volume Node support, invalidating the macro triangle.
Wave C of a textbook ABC correction is underway with a target of the golden pocket. and S2 pivot at $1.
📈 Daily RSI is oversold with no divergence
👉 Continued downside has a next target of $1
Safe trading

AAVE Local, bottoming soon?Locally, price continues bearish after falling out of the wedge, completing wave (B) of the macro triangle. Price action looks ready to reverse
Wave © appears complete after the big drop, black swan event- Oct 10th. I was looking for a dip back into the long lower wick, which we have and price is finding support. This suggests we grind higher from here, but we must get through the daily 200EMA, just above the High Volume Node resistance and daily pivot. This area will be tough to crack and was rejected on the first attempt.
📈 Daily RSI has printed bullish divergence from the oversold threshold- a bottoming signal.
👉 Continued downside has a next target of $114.
Safe trading

ONDO,1 more push lowerLSE:ONDO Price is sitting just above High Volume Node support, testing the descending trend-line as resistance. As long as we are below the trend-line, the probability is to the downside.
Wave 2 appears complete after 5 waves down from the wave X flat correction. Price was front-run at the golden pocket Fibonacci retracement, but only a bounce so far. We are below the daily pivot and 200EMA, which is bearish.
📈 Daily RSI tapped oversold twice with slight bullish divergence.
👉 Continued downside has a target of the bottom of the High Volume Node at $0.5
Safe trading

ETH Correction complete?CRYPTOCAP:ETH Wave 2 is taking the form of a complex WXYXZ correction broadening wedge. Ugly, hard to trade or find any entries. This will cause a lot of stress. This is also potentially a wave 4, but my preferred count is 2 for now.
Wave 2 appears complete with a swing below the boundary, but the recovery should have been stronger by now; instead, we are stalling below the daily 200EMA. The trend is down, and so we should expect more down. Wave X printed a triangle
📈 Daily RSI has not reached oversold and is still bearish with no divergences.
👉 Continued downside has a target of the High Volume Node $2600, where I will be adding.
Safe trading

AAVE local analysis updated, Bear trend continueEURONEXT:AAVE Locally, price continues bearish after falling out of the wedge, completing wave 1. Until the price gets above the orange descending trend-line, the probability is downside continuation.
Wave 2 appears complete after the big drop, black swan event. I was looking for a dip back into the long lower wick, which we have and price found support. This suggests we grind higher from here, but we must get through the daily 200EMA, just above the High Volume Node resistance and daily pivot. This area will be tough to crack.
The alternative count is a triangle forming discussed below, which is the (A)(B)(C) shown.
📈 Daily RSI has printed bullish divergence from the oversold threshold, which is bullish and a bottoming signal.
👉 Continued downside has a next target of $150.
Safe trading
