Stagnant Dominance Screams No Inflows – Crypto Crash Looming?Overview:
Over the past 43 days (July 12 to August 24, 2025), USDT Dominance has hovered around 4% with slight increases (from ~4% to 4.24%), indicating zero fresh capital inflows into crypto.
Growth in alts like Ethereum stems solely from money rotating out of Bitcoin (BTC.D decline), not new money— a classic redistribution trap. This setup warns of high crash risk, as the market lacks real liquidity support. As of August 24, 2025, USDT.D at 4.24% is priming for a surge, potentially triggering altcoin carnage.
NeoWave Technical Analysis:
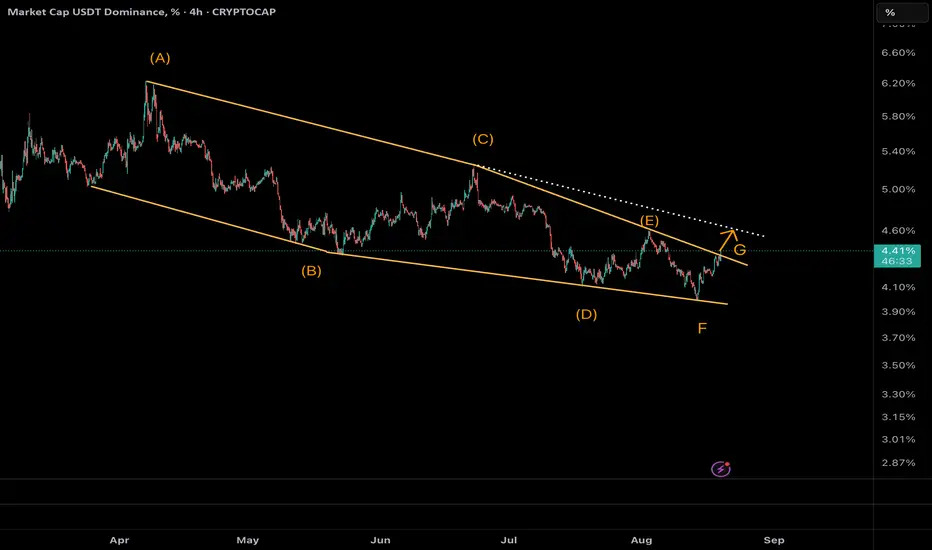
The chart shows a completed Diametric correction (7 waves A-B-C-D-E-F-G) in the descending yellow channel, with Wave G accelerating downward. Wave A from ~6.4% to 4.9%, B rebound to 5.7%, C drop to 4.5%, D rise to 5.4%, E decline to 4.3%, F short rally to 4.5%, and G plunging to 4.24%.
Monowave count (~55-70 subwaves) and symmetry (A/C/E/G large, B/D/F small) validate the pattern. The trendline break confirms reversal, targeting the next line at ~4.6% (1.618 Fib extension from F low).
Stagnant dominance over 43 days underlines no inflows—crypto's "growth" is internal shuffling, vulnerable to sudden outflows.
Why Crash Risk is High:
No new cash means the market is floating on borrowed time. Ethereum's pumps owe to BTC rotations, not organic demand—per Statista, USDT dominance rose in May 2025 but stabilized, signaling caution. If USDT.D breaks 4.6%, alts could dump 20-30% as funds park in stables.
Trade Idea (Bullish USDT.D / Bearish Alts):
Entry: Long USDT.D above 4.24% on BOS confirmation; short ETH/alts below $4,800.
Targets: TP1 at 4.6%, TP2 at 5% (channel midline). For ETH: $3,800-$3,500.
Stop Loss: Below 4.1% (R:R ~1:3).
Sizing: 1-2% capital; trail on midline breaks. Watch volume—low inflows mean flash crashes ahead.
Crypto's house of cards—time to hedge! #USDTDominance #NeoWave #CryptoCrash #NoInflows
Altcoincrash

USDT.D Daily | Explosive Surge from 4% –Altcoins Bloodbath Ahead🔹 Overview
USDT Dominance (USDT.D) has completed a 7-wave Diametric correction inside the descending yellow channel. Now, Wave G is accelerating with strong momentum.
, dominance is at 4.33%, breaking the channel trendline. This confirms the end of the correction phase and signals the start of a dominance rally.
Our prior forecast from the 4% floor is playing out exactly—capital is flooding into stables as risk-off sentiment crushes Altcoins.
⸻
🔹 Wave Structure (NeoWave)
• Diametric unfolded as A-B-C-D-E-F-G.
• Symmetry holds: large A/C/E/G vs. small B/D/F.
• Trendline break = pattern completion.
Monowave count (~55–70) confirms the structure’s legitimacy.
⸻
🔹 Technical Setup
• Current support: 4.28% (brown line).
• Target 1: 4.6% (Fib 1.618 extension + trendline).
• Target 2: 5% (channel midline).
• RSI bullish divergence + rising volume confirm strength.
⸻
🔹 Market Implications
This breakout means:
⚠️ Altcoin Bloodbath incoming.
USDT dominance rally = liquidity moving away from alts. BTC/ETH may stabilize, but alts risk heavy drawdowns.
⸻
🔹 Trade Idea (Bullish USDT.D)
• Entry: Long USDT.D (or short alts) above 4.33% on BOS confirmation (daily).
• Targets: TP1 = 4.6%, TP2 = 5%.
• Stop Loss: Below 4.28%.
• Risk: 1–2% per trade. Trail stops if midline breaks.
⸻
🔥 Get ready for a stablecoin takeover & brutal altcoin flush.
Another Storm Brewing for Altcoins – Others.D Hits Critical ResOn the 4H chart, Altcoin Dominance (Others.D) has surged back toward 7.8%, testing the upper resistance zone once again. This move mirrors previous peaks, where sellers stepped in aggressively, triggering sharp pullbacks.
📌 Technical Snapshot:
• Price rejected near 7.85%-7.90%, aligned with a descending resistance line (white) and long-term horizontal resistance (yellow dashed).
• The recent rally from 7.45% lows was steep and fast, suggesting exhaustion as momentum indicators flash early divergence.
• Structure resembles a corrective rally inside a broader downtrend channel (white boundaries).
📉 Bearish Outlook for Alts:
• Failure to break above 7.90% could spark another sell-off, pushing dominance back toward 7.50%-7.45%.
• A deeper flush may extend toward 7.30%, coinciding with the channel bottom.
• Meanwhile, if BTC.D continues to strengthen, alts may face another storm of capital rotation back to Bitcoin and stables.
📊 Scenario Path (Red Flag for Alts):
• Consolidation at 7.8% → rejection from trendline
• Breakdown toward 7.6% → 7.5% → possibly 7.3%
• Only a decisive breakout above 7.90%-8.00% invalidates the bearish case and opens the door for a sustained altseason.
⸻
🎯 Trade Idea (Risk-Off Bias):
• Watch for rejection at 7.8%-7.9% zone
• Short bias on alts / hedge exposure if dominance rolls over
• Target zones: 7.5% → 7.3%
• Stop above 8.0% to protect against breakout

BNB at the top of Bullish Channel
As it shown, BNB is around top line of Channel ad get ready to drop

Others.d sign the falling of AltCoins this is a classic set up of price action analysis. As it shown in Fig, Others.d reach to fresh order block at 7.9%, after that a Choch and BOS and Retest of it happend.
Now Market is ready to Dump Badly.
get ready of it

Cardano: Crash Ahead? Prepare for a Potential 20%+ Downside!Hey Realistic Traders, let’s dive into the analysis of BINANCE:ADAUSDT
On the daily chart, Cardano continues to struggle below the critical EMA200, signaling a persistent bearish bias. Even more telling, the price has repeatedly respected the bearish trendline, underscoring the strength of this downtrend.
To make matters worse, we've seen a breakout from two major bearish formations: the Rising Wedge and the Ascending Broadening Wedge. Both patterns point to a continuation of the downward spiral. Adding fuel to the fire, the MACD has made a clear bearish crossover, confirming that the bears are firmly in control.
Based on these signals, we anticipate a sharp drop toward the first target at 0.2753. After that, a brief pullback could bring prices back into the green zone before heading even lower to the second target at 0.2384.
This technical outlook remains valid as long as the price stays above the support area at 0.4158.
Disclaimer: "Please note that this analysis is solely for educational purposes and should not be considered a recommendation to take a long or short position on Cardano.
Please support the channel by engaging with the content, using the rocket button, and sharing your opinions in the comments below.

Bitcoin Update 18 June 2024Hello Traders,
Bitcoin is taking support in our given zone from last few days. Also today it took support of EMA 100 (Daily TF).
Checkout the latest update in this video

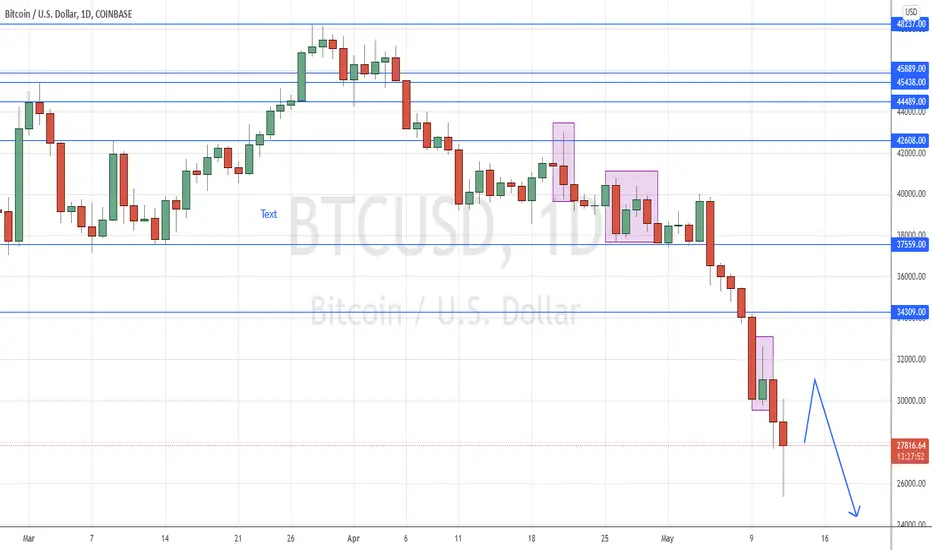
BITCOIN: Bearish Pin Bar Signal$BITCOIN ($BTCUSD) – Cash: The Bearish Pin Bar Signal triggered
(WARNING ON CRYPTO: TRADING BITCOIN AND CRYPTO IS HIGH RISK, CONSIDER A REDUCED POSITION SIZE AND LOWER LEVERAGE UNTIL YOU ARE FAMILIAR WITH THESE MARKETS).
Price Action: Price moved lower from the recent Bearish Pin Bar Signal that had formed earlier this week (We suggested trading this signal in the May 11th, members' daily newsletter).
Price significantly moved lower from the prior Multiple Inside Bar Pattern that had formed just above the 37559 prior short-term support level (Which is now a Key resistance level and an Event Area) over a week ago (We suggested trading this pattern in the April 29th, members daily newsletter).
Price moved lower from the prior Bearish Pin Bar Signal (Event Zone) that had formed just under the 42608 short-term resistance over two weeks ago (We suggested trading this signal in the April 24th, weekly newsletter and hopefully some traders got on board).
Potential Trade Idea 1: For more aggressive traders, we are considering selling on a retracement higher whilst price remains below the recent Bearish Pin Bar Signal.
Potential Trade Idea 2: We are considering selling on a retracement higher whilst price remains below the 37559 key resistance level and the recent Multiple Inside Bar Breakdown Pattern (Event Area).