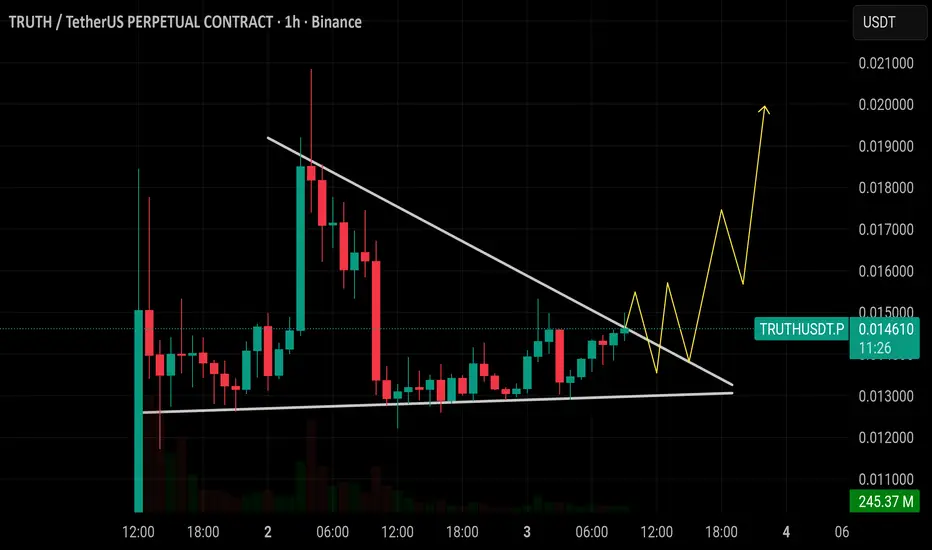
$TRUTH is breaking out from a falling wedge pattern around 0.014$TRUTH is breaking out from a falling wedge pattern around 0.0147. If momentum holds, price can push toward 0.0160 first and then extend toward 0.0200. Losing 0.0130 support would invalidate this bullish setup.
ALTS
Altcoins Index TOTAL2 and TOTAL3 are on the verge of a major breThe major resistance level that has persisted for almost 4 years since the 2021 ATH in two pairs is also on the verge of breaking the supply zone.

LINK - PERFECT SETUPWizzard TA on BIST:LINK
21.90$ retest - Accuracy: 100%
TP4 if I posted :)
Let's go!

$NEAR will reach to 8$ soonIf it's close above 3.4$ weekly it's easy move to 8$ and then 12$ target.

This month Will Define This Entire Crypto Cycle🎯 October Just Started — And It Might Define This Entire Crypto Cycle 📈
Happy October, everyone — a month with a powerful pattern.
If history repeats, this could be a defining moment:
2017 saw a 5x BTC rally in 60 days,
2021 delivered a 2.5x in just 45 days.
Now it’s 2025 , and we’re watching the charts line up once again. 🔁
We’ve been long Bitcoin since two days ago, right off the support at the bottom of the channel — a level we’ve tracked since March 14, 2023 .
That same chart gave us:
42K (hit summer 2023)
46K (initial rejection, later support)
And now, we’re targeting 127,370 → 138K–140K as part of the final macro wave. 🚀
Ethereum is showing strength too. From a solid buy zone near 4,000 , I still believe the next key levels are 6,443 and 10,364 .
Altcoins? Let’s talk dominance:
Bitcoin Dominance is still high (~58%) but could drop toward 56.91 — giving room for alts to breathe.
Ethereum Dominance remains in a clear descending channel, with a clean target of 18.29% dominance.
📊 We’ve revisited Ethereum vs. BTC charts, and I remain long ETH here with a 0.06 BTC target.
Other setups:
Solana support at 204.81 , targets 240 and 276 .
XRP ? I remain cautious — still preferring ETH over XRP based on recent cycles.
Total Market Cap still shows bullish structure, aiming for 4.8T and later 6.5T .
We’ve seen the October pattern repeat across cycles. While the exact altcoin winners change (XLM & XRP in 2017, ETH in 2021), the macro truth remains:
Bitcoin tends to lead — and October tends to explode.🔥
Thought of the Day 💡
“Cycles evolve, but the rhythm remains. Each October is a chance — not a promise. But charts give us a map, and right now, the map points up.”
Disclaimer
I share market views for educational and entertainment purposes only. This is not financial advice. I am not a licensed advisor. Trade at your own risk and always manage your capital responsibly.
One Love,
The FXPROFESSOR 💙
ps. it's a video..watch it and let me know your thoughts

Altcoins season LoadingThe Altseason is approaching.
Altcoins season is inevitable and will be loaded.


BTC.D Alt coins updatewait for the monthly candle closure and to form a fvg / gap, whenever it taps into the monthly fvg, start acculumating altcoins, invest good in stronger altcoins like ETH, Link, ENA, SEI, INJ and stronger memes like Doge, Fartcoin, Bonk and Turbo. These pairs are my favourite and will outperform in alt season. Because btc.d is strongly bearish that's why not giving any short signal for alts, ignore what's BTC doing. Market makers are just flushing the long / buyers before a strong impulsive moves. October first week or maybe the 2nd week may go in red then the real strong move will start. Market makers are just showing the market is strongly bearish, shifted structre to the downside trapping all smc/ict traders and other breakout traders to trap for short selling as they did in feb. Best Of Luck.

APEX Main trend. DEX exchange Bybit. Hype and super pump 05 2025Logarithm. Time frame 1 week. Correction (descending channel, two distribution zones) after a super pump of about 1500%. All key support and resistance zones were shown, including dynamic ones.
Also showed a local target in percentage in case of exit from a local descending wedge. There is a possibility that the price will enter the mirror support zone of the previous volatility zone of the horizontal channel, or even to the median (green dotted line). Just remember this. When working with the crowd hype, remember the risks.

#BTCD On the blue box, close all your longs.#BTCD On the blue box, close all your longs...
After 3755, I will close all my long positions. BTCD will suddenly rise, which will cause a market crash. Those in profit on longs should book their profits, and those in loss should save themselves from bigger losses. #ETH can go down near 2900, so you can imagine what will happen to the rest of the alts.
We’ll keep checking the remaining updates.
!! Jai Baba Ki !!

Bitcoin dominance VS. Altcoins run phaseBTC dominance has broken below its major uptrend, and we may see very positive movements in altcoins in the coming period.

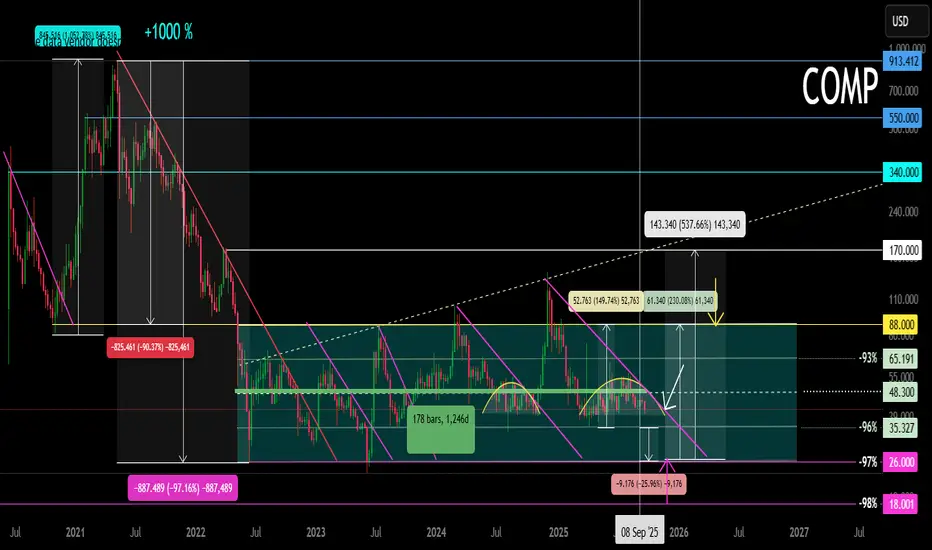
COMP Main trend. 09/24/2025Logarithm. Time frame: 1 week.
Declines from the pump high +1000% to -97%
A horizontal channel has formed, with rising highs (outer boundaries). The inner channel range is -93-96%.
Typical trading in horizontal channels (from zones or on breakouts) and upon exiting them, while adhering to money management.
Buy fear in pieces, sell joy in pieces.
BITCOIN DOMINANCE has BROKEN DOWN Initially, we have a head and shoulders pattern that has yet to reach its target.
Additionally, there is a significant breakdown from a broadening ascending wedge.
Expanding wedge formations exhibit increasing volatility as they develop.
These ascending broadening wedge chart patterns emerge during uptrends, signalling trend continuation with higher highs and higher lows, often touching the upper and lower boundary lines of the wedge.
When the head and shoulders pattern was formed, it FAILED to reach the upper boundary.
This suggests a exhaustion of the uptrend.
The activation of the head and shoulders confirmed that a reversal was underway.
Now, we are witnessing the breakdown of the wedge, followed by back testing, which confirms the weakness of #Bitcoin compared to the #ALTS, particularly #Ethereum, of course.
I still believe that Bitcoin has higher price targets that will be achieved, so I remain optimistic about BTC.
If you own Bitcoin, it would be wise to stay with that asset and avoid getting caught up in the extreme volatility of alt coins.
For those of us who have been battling and enduring in the trenches over the past few years, the opposite holds true.
We CANNOT give in to Bitcoin maximalism at this point in the game!
This is our Time!

SUILocal Analysis / Targets / Elliot Wave
Sui attempted to breakout into all time high and was rejected as expected for a wave (1). Wave (2) is underway with an expected first target of the High Volume Node and S1 daily pivot at $2.9, also the 0.382 Fibonacci retracement. Price must get through the daily 200EMA first. Secondary targets is the golden pocket and High Volume Node support at $2.3.
RSI is just below the EQ and crossed bearishly.
Standard Deviation Band Analysis
Price is below the fair value regression line and another thrust lower will see it reach the green opportunity buy zone where it has tested the threshold twice a support. Price was rejected twice when also attempting to breakout above fair value showing supply ready to drop.
Safe trading

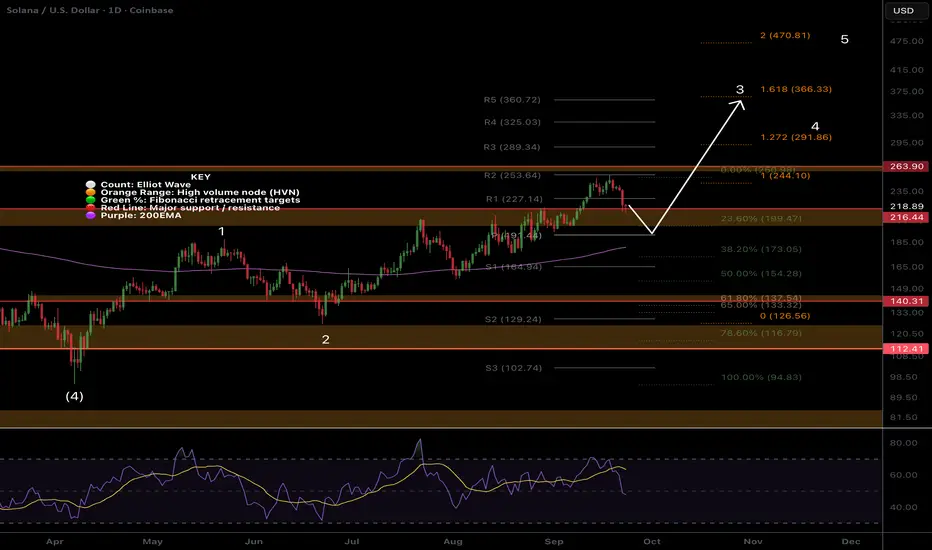
SOL Rejected at all time high! Whats next?Local Analysis / Targets / Elliot Wave
Solana attempted to break into price discovery but was rejected harshly back to the High Volume Node support trapping new traders and investors with the all time high excitement. Wave 3 appears to be underway with a minimum target of $365 the 1.618 Fibonacci extension and R5 daily pivot. Wave 3 pull backs should be shallow.
Continued downside bring up the ascending daily 200EMA and 0.382 target of $173. RSI is at the EQ and crossed bearishly.
Standard Deviation Band Analysis
Solana continues in the expected range just above fair value. Its attempts to break through the SD+2 threshold continue to thwarted but the next attempt will be number 4, the higher probability breakout!
Safe trading
ONDO Flat Correction Near Completion?Local Analysis / Targets / Elliot Wave
Ondo appears to be in a flat correction defined by the pattern and depth of the interior Fibonacci’s. Wave X appears complete and Y is underway, often a strong sell off phase as we can see here. Price would only be expected to whip below wave W to complete wave 2 before heading to new highs in wave 3. This also tests the High Volume Node as support and golden pocket.
The first wave 3 target is $1.5 High Volume Node resistance and R4 daily pivot. RSI has plenty of room to fall.
Standard Deviation Band Analysis
Price is riding the fair value regression line but remains just below after several tests as resistance. Continued downside would put Ondo in the green opportunity buy zone which most often presents great returns and price only stays there <5% of the time.
Safe trading

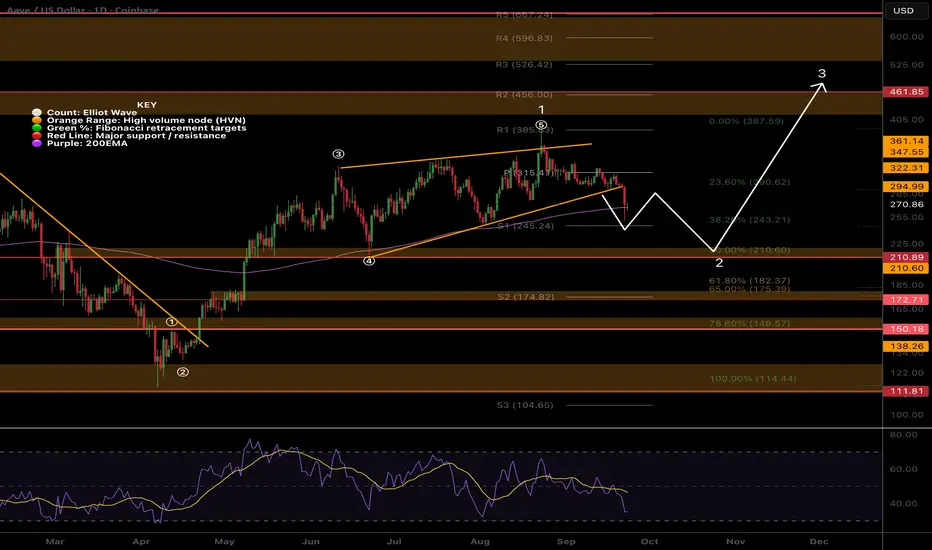
AAVE Breakdown from wave 5 wedge. Whats next?Local Analysis / Targets / Elliot Wave
CRYPTOCAP:AAVE broke down out of the wave (5) of 1 wedge per my previous analysis reaching the paths first target to find support the daily 200EMA and S1 pivot point. If price continues lower I expect it to bounce first before delivering a final thrust down in wave C of 2.
The major support High Volume Node, $210, is the target at the 0.5 Fibonacci retracement. Further breakdown brings up the golden pocket and S2 pivot, $175, and the alt-coin ‘golden pocket’ sits at $149 the 0.786 Fibonacci retracement. This is the most common area for alt-coin pull backs to terminate and a characteristic area for low volume, highly volatile assets in general due to the psychology as I discuss on my Fibonacci tutorial on YouTube.
RSI is making its way down into oversold but has plenty of room to fall with no bullish divergence yet.
Standard Deviation Band Analysis
Standard deviation bands are non-normally distributed unlike the renko chart shared in yesterdays report when time is removed. Price continues to spend way to much time at extremes with fast movement through the fait value zone. Bands are shifting significantly positive as time goes on due to price spending so much time in th eupper boundaries. This is a good sign of strength, dips remain shallow showing strong demand.
Price is testing the SD+2 threshold as support now and losing this would bring up the next target of the fair value regression line at $150 which adds confluence to the alt-coin ‘golden pocket’ targets in the technical analysis.
Safe trading
The next Bitcoin Long to take In this video I cover the next best available levels of where we are very likely to get a strong reaction from after this correction .
I have taken a variety of Fib pulls to determine the next buy levels as well as covering a local short setup .
Appreciate your support Thank alot
Tools used Fibs, AVWAP , VP, and Tpoc chart + pivots

TOTAL3 – Altcoin Market Cap (Excluding BTC & ETH) Weekly TF 2025Summary
TOTAL3 is currently in a macro bullish cycle and undergoing a mid-cycle correction. The chart presents a Fibonacci-based structural roadmap with 3 Take Profit zones, identifying both correction supports and breakout targets. There is a high probability of short-term downside before a significant altcoin rally.
🌈 Chart Context
Fibonacci Retracement (Primary Leg):
100% = 285.3B
0% = 1.16T
Trend-Based Fibonacci Extension
A = 285.3B
B = 775B
C = 464.11B
Price as of analysis: ~845.62B
Key Technical Observations
Support Levels:
61.8% Fib Retracement = 618.5B
Strong Confluence Zone: Fib Retracement 48% + Fib Extension 50–61.8% (highlighted on chart)
38.2% Fib Retracement = 824.38B
Resistance Levels:
951.73B: 23.6% Retracement + 100% Extension – strong resistance zone before $1T psychological level
Take Profit Zones:
1 TP (1.1T) = 127% Fib Extension (Upper leg of parallel extension)
2 TP (1.28T) = 161.8% Fib Extension
3 TP (1.7T) = -61.8% Fib Retracement and 261.8% Extension confluence zone
Pattern & Projection:
The structure suggests a possible correction phase to lower support before continuation.
Bullish continuation expected after corrective phase, shown by the projected dotted path.
Structure: Bullish structure with healthy correction in mid-phase of the macro uptrend.
Fundamental Context
Altcoin Lag: TOTAL3 remains ~40% below its ATH, while BTC and ETH have already hit new highs.
Liquidity Shift Expected: Altcoin capital rotation tends to follow after BTC dominance stabilizes or drops.
Macro Backdrop:
Fed expected to cut rates later in 2025
Stablecoin legislation and ETF narratives building altcoin trust
Institutional inflows are slowly diversifying from BTC to ETH and large-cap alts
These suggest a possible shakeout or deeper correction before altseason breakout gains strength.
Bias & Strategy Implication:
Bias: Bullish Mid-Term – Correction Before Continuation
Expected Scenario: Pullback to strong support zones (824B–733B–618B), followed by a sustained breakout toward 1.1T–1.7T.
Invalidation: Weekly close below 618B may delay bullish structure and extend correction.
Strategy:
Long entries at support zones with tight invalidation
Scaling out near TP1, TP2, TP3 based on market momentum
Philosophical View
Patience is the virtue of the second leg in a macro trend. The correction serves to eject the impatient, reprice risk, and strengthen conviction. When TOTAL3 rises from deep support, it will be not just price but confidence that rallies.
Related Reference Charts
TOTAL Market Cap Structural Breakout:
TOTAL2 Altcoin Chart with Fibonacci Path:
✅ Tags
#TOTAL3 #AltcoinMarket #Fibonacci #Altseason #CryptoCorrection #CryptoMacro #TechnicalAnalysis #BullishOutlook #MidCycleCorrection #Crypto2025
⚠️ Notes & Disclaimers
This analysis is educational and not financial advice. Markets are inherently risky. Do your own research and manage risk accordingly.

Altcoins season...Altcoins are loading up for a major upward wave.
The Altseason is approaching step by step.

MVRK - POST- LISTING HYPE - READY TO EXPLODE ??$MVRK - Mavryk: Powering Global Tokenization 🚀
Mavryk ($MVRK) is building the infrastructure for next-gen global tokenization, and it’s #RWA season!
🔹 RWAs are projected to be a $28.7 trillion market by 2030. Mavryk already has $10B+ signed deals! 🔥
🔹 Fair distribution, no VC games
🔹 MAINNET + TGE ARE LIVE! 🎉
🔹 Market cap only ~$70M? Hidden gem vibes 💎
🔹 Full chain audited by @CertiK✅
🔹TOTAL SUPPLY: 300M / 100% CIRCULATING
This kind of positioning + huge market potential = strong long-term play IMO. 📈
Do you think $MVRK is the next big #RWA winner?
Share your thoughts below! 👇

W Secondary. Reversed Head and Shoulders Key Area. 18 09 25Logarithm. 3 days.
Main trend 23 03 2025
A breakout of the previously mentioned key resistance (pair to USD) occurs on huge buying volume and an exit from the sideways trend (inverse head and shoulders).
Local targets, in case the inverse head and shoulders pattern is realized and a bowl forms at the next resistance level (previous consolidation).

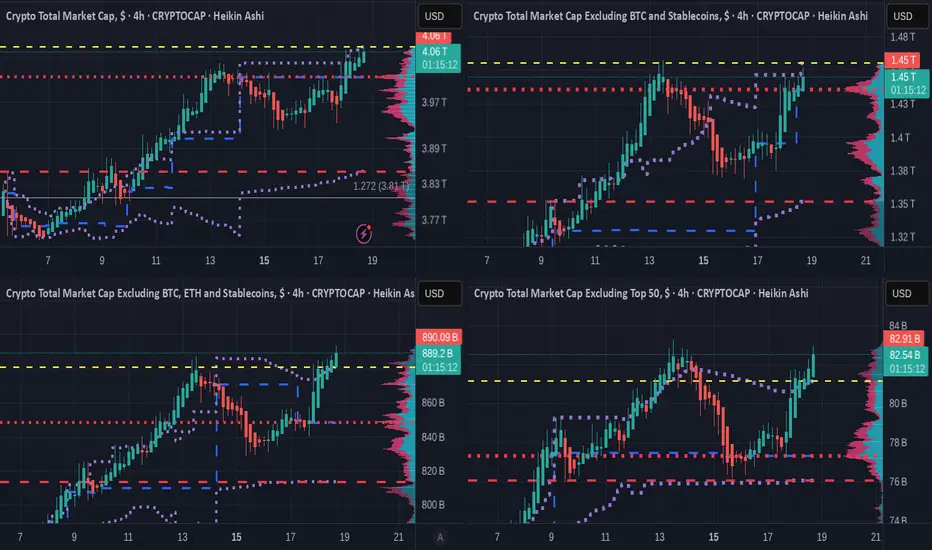
4 X Crypto TOTAL charts showing who is leading the packTHESE ARE THE SHORTER TERM 4 HOUR CHARTS
Top line - TOTAL Crypto Market Cap - TOTAL 2 (Excluding BTC )
Bottom Line - TOTAL 3 ( Excluding BTC & ETH ) - OTHERS ( Top 125 coins minus Top 50 by market cap )
TOTAL 3 is ALL ALT coins
OTHERS is Mid to Lower Cap ALT coins
These 4 Charts use the VRVP
the Volume Profile Visible Range (VPVR), is a technical analysis indicator on TradingView that displays the distribution of trading volume at different price levels within the currently visible range of a chart.
The Colour Key is below
Value Area High ( VAH ) - Yellow Dashed Line
Value Area Low ( VAL ) - Red Dashed line
Point of Control ( POC ) - Red Dotted line
Developing POC - Blue Dashed line
Developing Value Area - Purple Dotted line
The first thing to see is simply that OTHERS has a higher gain than any..
ALT SEASON is here but be VERY Cautious about how long this may last...
IT MAY NOT LAST long.....we MUST watch daily to see what is happening.
Because BTC is poised and ready able to move at any time and when it happens, usually Stops ALTS in their tracks.
Watch the Bitcoin Dominance chart
As you can see, we are in the Zone for a Bitcoin ATH in the next few months.
Be Cautious
So, currently, we have the TOTAL chart just coming up to the VAH. This may prove to be resistance in which Case ALTS may run longer. However, the POC just below could prove to be enough support to push PA above that VAH on a 2nd attempt, IF that is required.
TOTAL 2 is below but rising and the same may apply to the POC just below.
However, the TOTAL 3 and OTHERS are already above the VAH line and so have a clear road ahead but when this fails, the POC sipport is a LONG way below.
This is early days of reaction to the FED 25 point Drp [ and so we need to remain cautious as to the Trend that has yet to prove itself..
But things do look good.....