#XRP Retest ? XRP has reached the green zone where we could see another reaction.
If the price holds strong around this area, I believe an upward move could begin.
Altsignals

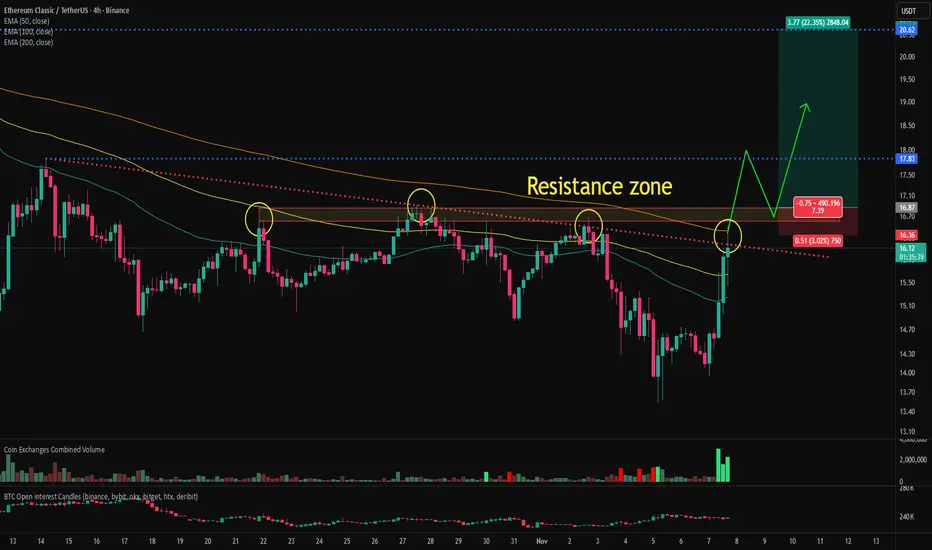
ETC(ehereum classic) chart analysis and bullish signalEthereum Classic is currently attempting to break above the 200-period moving average, a key resistance level, and a major supply zone on the 4-hour chart. Although it’s facing resistance at the moment, a decisive breakout through these overlapping resistance zones could provide an attractive long-entry opportunity with a favorable risk-to-reward ratio.
Given that this resistance area has rejected multiple breakout attempts in the past, the probability of a successful breakout this time appears relatively high.
The ETC/BTC chart has also cleared several major resistance levels, suggesting that ETC could follow a similar pattern to recent strong performers such as ZEC, DASH, and 1INCH.
The bullish alignment on the ETC/BTC chart also indicates that Ethereum Classic is outperforming Bitcoin.
If Ethereum Classic confirms a breakout above the resistance zone, I will share an updated analysis on the subsequent price outlook.
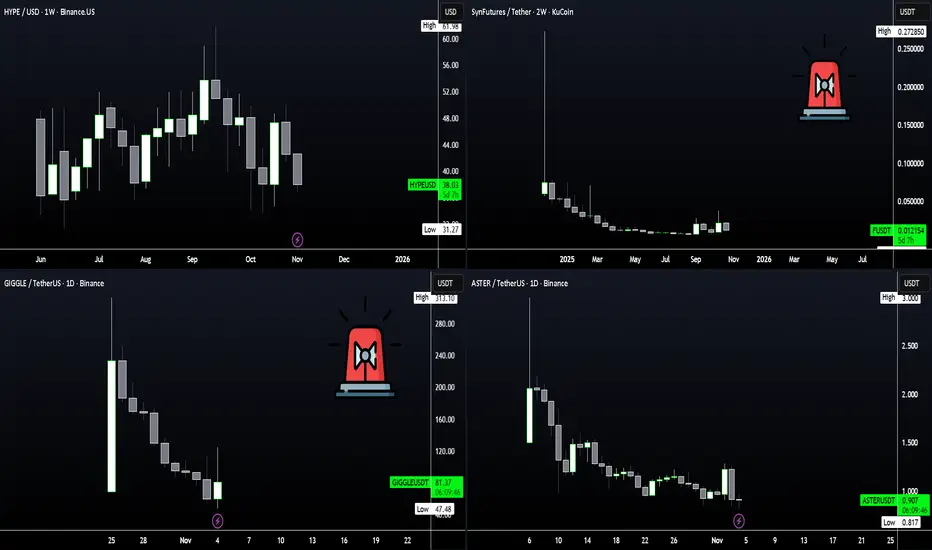
How To Trade NEW ALTS - SECRET PATTERN !!New Alts - a Pattern
Newly released alts all seem to follow the same pattern, at least for the first few weeks. From the frontpage chart, you'll notice a very interesting "fractal" if we can call it that.
It goes something like this:
🚀 Opening Candle 💥 Top Out 👇 Hard Drop ❕ Re-enters opening price or goes under 🔁 Bottoms out (HERE IS WHERE YOU BUY) 🚀 Higher Highs follow.
With this said, it seems evident that you should WAIT to buy a coin that has just been released on the exchange. Although you could try to jump in to the moving train, the risk is simply too high if you do not already have a position.
ALTS that have already retraced, bottomed out and establishing higher lows. These alts you could easily preset TP targets from 15% onwards, depending on your risk appetite.
📈HERE are some examples:
JTO, almost there:
RVF, full retracement and beyond (This could be a warning sign as a liquidity drain)
RAY, clear bottom, full retracement, approaching re-accumulation zone:
ADA, full retracement, hard bounce, approaching key re-accumulation zone:
ALWAYS remember to take caution in the volatile world of crypto with a SL and reasonable targets. Remember that trading newly released alts and memecoins greatly increase the risk on top of the existing risk of crypto.
Griffain is looking goodGriffain is looking good, with a huge potential of 40% returns. Right now it is trading in a descending triangle. Being a low supply token, it can easily jump to the target.
Not a Financial Advice

$XPL Trade Idea - Break Out LONG Stablecoin narrative
AMEX:XPL
Long Entries on Breakout of Trendline
Stop below recent lows.
Targets Aiming level by level
$2 soon
For swing spot trade - i think it's to better to have manual stop below $0.6

BTC.D Alt coins updatewait for the monthly candle closure and to form a fvg / gap, whenever it taps into the monthly fvg, start acculumating altcoins, invest good in stronger altcoins like ETH, Link, ENA, SEI, INJ and stronger memes like Doge, Fartcoin, Bonk and Turbo. These pairs are my favourite and will outperform in alt season. Because btc.d is strongly bearish that's why not giving any short signal for alts, ignore what's BTC doing. Market makers are just flushing the long / buyers before a strong impulsive moves. October first week or maybe the 2nd week may go in red then the real strong move will start. Market makers are just showing the market is strongly bearish, shifted structre to the downside trapping all smc/ict traders and other breakout traders to trap for short selling as they did in feb. Best Of Luck.

Can Pi Network(PI) Bounce +15% From PRZ?In recent days, Pi Network ( OKX:PIUSDT ) has dropped more than -40% , raising the big question: Is Pi still a project we can rely on, or is momentum fading away?
Main Reasons Behind the Drop:
1-Mass token unlocks in September → Huge increase in supply created heavy selling pressure.
2-Rising exchange reserves → More than 420M now sitting on CEX wallets, a sign of potential sell waves.
3-Fast-track KYC & protocol upgrades → Gave many users access to their tokens, fueling more selling activity.
4-Low liquidity + whale sell-offs → A few large orders accelerated the decline.
The Pi community remains strong, but current supply shocks are outweighing demand. Until the project reaches full exchange listings and sustainable utility, traders should stay cautious and manage risk carefully.
---------------------------------------------------------------
Now let’s take a look at the PI Token chart on the 15-minute time frame .
The PI Token has formed a descending channel over the past day.
From the perspective of Elliott Wave theory , it looks like PI Token is completing a Double Three Correction(WXY) in the descending channel .
I expect PI Token to start rising as it enters or touches the Potential Reversal Zone(PRZ) again and rise to $0.289(+15%) . In general, a break of the upper line of the descending channel is a good sign for the PI token to rise .
Please respect each other's ideas and express them politely if you agree or disagree.
Pi Network Analysis (PIUSDT), 15-minute time frame.
Be sure to follow the updated ideas.
Do not forget to put a Stop loss for your positions (For every position you want to open).
Please follow your strategy and updates; this is just my Idea, and I will gladly see your ideas in this post.
Please do not forget the ✅' like '✅ button 🙏😊 & Share it with your friends; thanks, and Trade safe.

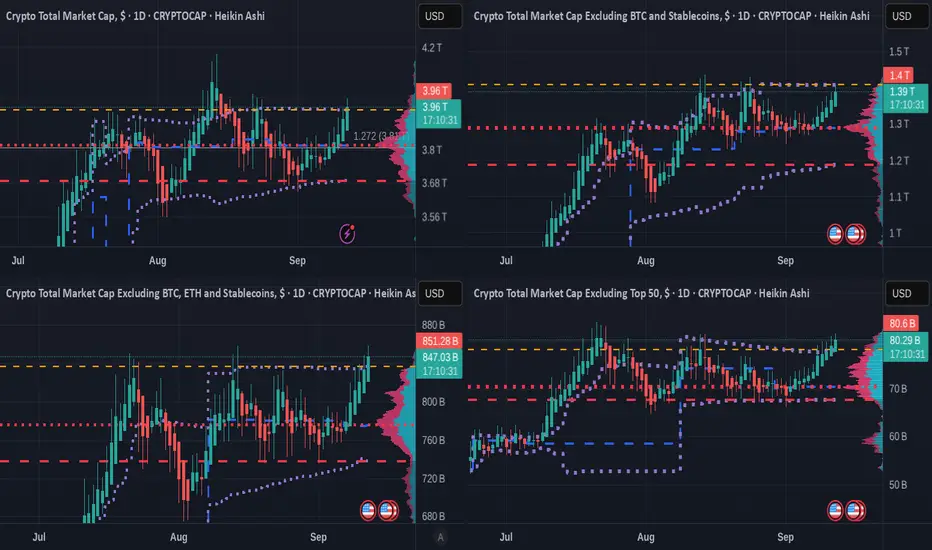
4 x TOTAL Crypto charts showing ALT Season has MomentumTop line - TOTAL Crypto Market Cap - TOTAL 2 (Excluding BTC )
Bottom Line - TOTAL 3 ( Excluding BTC & ETH ) - OTHERS ( Top 125 coins minus Top 50 by market cap )
TOTAL 3 is ALL ALT coins
OTHERS is Mid to Lower Cap ALT coins
These 4 Charts use the VRVP
he Volume Profile Visible Range (VPVR), is a technical analysis indicator on TradingView that displays the distribution of trading volume at different price levels within the currently visible range of a chart.
The Colour Key is below
Value Area High ( VAH ) - Orange Dashed Line
Value Area Low ( VAL ) - Red Dashed line
Point of Control ( POC ) - Red Dotted line
Developing POC - Blue Dashed line
Developing Value Area - Purple Dotted line
These lines can be seen as lines of support / Resistance.
The 2 Upper charts, we see that PA is being held back on the VAH line.
The 2 Lower charts show us that PA has Broken ABOVE the VAH line.
This shows us more Volume of training is happening on the lower Cap ALTS than the higher cap
It is as simple as that
But we should look at the BTC/Dominance chart
BTC.D is on Support and it has produced bounces in the past
We also see on the 2nd chart how we should have already have had the ALT season...so..It maybe short lived. But the dynamics of the market have changed......
So there we have it, The TOTAL charts for ALTS shows us that ALTS are breaking out but this could be Fragile but by no means does it mean they will crash right away.
But be careful, we are in uncharted territory.
TIA Consolidation Ends? Bulls Eye 2.2 First, Then 4.0In my previous analysis, I mentioned that I am bullish on BINANCE:TIAUSDT , expecting the coin to recover at least part of the ground lost since the start of 2024.
So far, we haven’t seen real acceleration to the upside, but the price action is encouraging:
• Dips have been well defended around the 1.5 zone.
• The recent low stands above the July low, suggesting buyers are stepping in earlier.
• Two days ago, price finally managed to break above the falling trendline, a technical step in the right direction.
Putting these elements together, I maintain my bullish outlook. The first soft target for this move is 2.2.
But the real inflection point comes there: if TIA manages to stabilize above 2.2, a level that acted as support in early 2025 and resistance in late July, then the door opens for a much stronger rally. In that case, a reasonable target would be 4.0, with momentum likely to pick up sharply.

Smaller alts, a constructive outlookThe Big Question: Will We Finally See Moves on Alts?
The past month – or rather the past 6 weeks – has been nothing short of frustrating for altcoin traders. Most individual charts looked stagnant, choppy, or simply lacked momentum. But zooming out to the Total chart, the picture is much clearer, and the answer looks like a confident YES .
What the Chart Tells Us
• After the December 2024 top, we witnessed a deep correction, which finally bottomed on 7 April, during the infamous tariff mania .
• From there, an initial leg up developed, reaching resistance around the 300B mark.
• The correction that followed was healthy: it established a higher low, confirming that the bottom was not just a dead cat bounce.
• The next attempt pushed even deeper into resistance, creating a higher high – a strong bullish sign.
• Since the end of July, things have turned even more interesting: the market has been pressing hard into resistance, and we could even argue the formation of a continuation Head & Shoulders setup.
Where We Are Now
At the time of posting, the Total chart is testing resistance at ~310B once again. The more this level gets tested, the weaker it becomes. A breakout from here doesn’t just look possible – it looks almost unavoidable .
What to Expect Next
When that resistance finally breaks, the tension built up over months of sideways action – and the frustration of traders who have been waiting for more than half a year – will likely unleash a strong acceleration.
In my view, we could easily see a 50% rally, taking the Total chart back to the December 2024 highs.
🚀 The stage is set. All that’s missing is the trigger.
WLFI Token Faces Key PRZ – Will the Downtrend End Soon?The World Liberty Financial project with the WLFI token ( BINANCE:WLFIUSDT ) continued its downtrend as I expected in yesterday's idea .
The question is, when will this downtrend of the WLFI token end?
The WLFI token is currently moving near the Potential Reversal Zone(PRZ) , Cumulative Long Liquidation Leverage($0.1576-$0.1500) , and the round number of $1,500 .
In terms of Elliott wave theory , the WLFI token seems to be completing the main wave 3 . The main wave 3 could complete at the PRZ and the lower line of the descending channel (possible).
I expect the WLFI token to rise to at least $0.1816(First Target ) in the coming hours.
Second Target: Upper line of descending channel
Cumulative Short Liquidation Leverage: $0.1905-$0.1845
Stop Loss(SL): $0.1487
Please respect each other's ideas and express them politely if you agree or disagree.
World Liberty Financial Analyze (WLFIUSDT), 15-minute time frame.
Be sure to follow the updated ideas.
Do not forget to put a Stop loss for your positions (For every position you want to open).
Please follow your strategy and updates; this is just my Idea, and I will gladly see your ideas in this post.
Please do not forget the ✅' like '✅ button 🙏😊 & Share it with your friends; thanks, and Trade safe.

Crypto Market Cap (Others) – Ready for Breakout?When it comes to trading or investing, for sure we all want the best return possible. With both BTC and ETH at or very near ATHs, most of us are naturally looking at lower cap alts for opportunities.
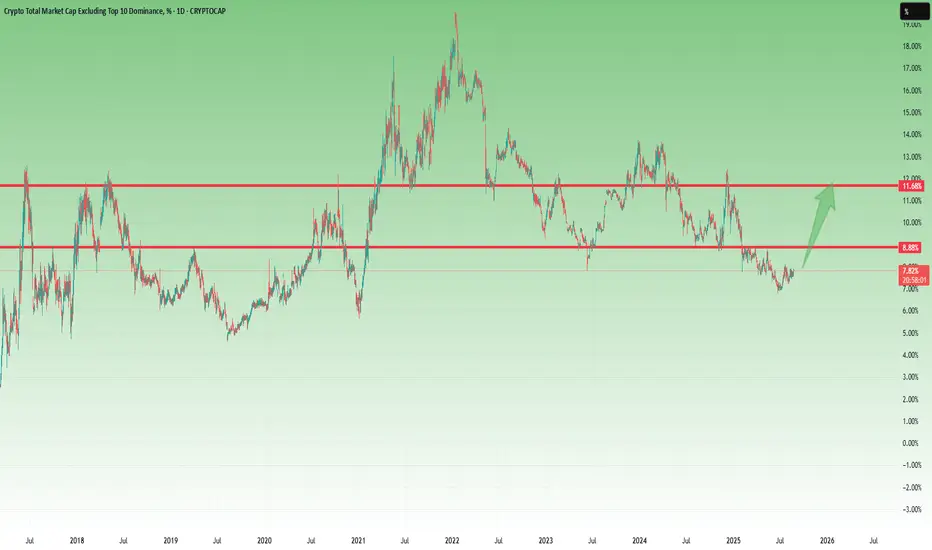
For this reason, let’s analyze the chart for Crypto Market Cap excluding Top 10 and stablecoins.
Note: Although since the 2021 bottom there have literally been hundreds of thousands of new coins launched, I still consider this chart highly relevant.
The recent price action is clear:
• Since the July bottom, “Others” has shown a timid but constructive recovery.
• A higher low was confirmed at the beginning of August.
• A tight consolidation is now pressing against resistance.
On the 2H chart, this consolidation looks very promising, with pressure building for a breakout. Technically, a move above 7.88% dominance could trigger acceleration toward 8.88%, and if the optimism holds, even a medium-term extension toward 12% is possible.
📈 Trading Plan:
Look for coins in the Top 100 (excluding Top 10) that already show bullish chart structures. Combining this with the strong setup in the “Others” chart could be a solid approach to maximize returns in this phase of the market.
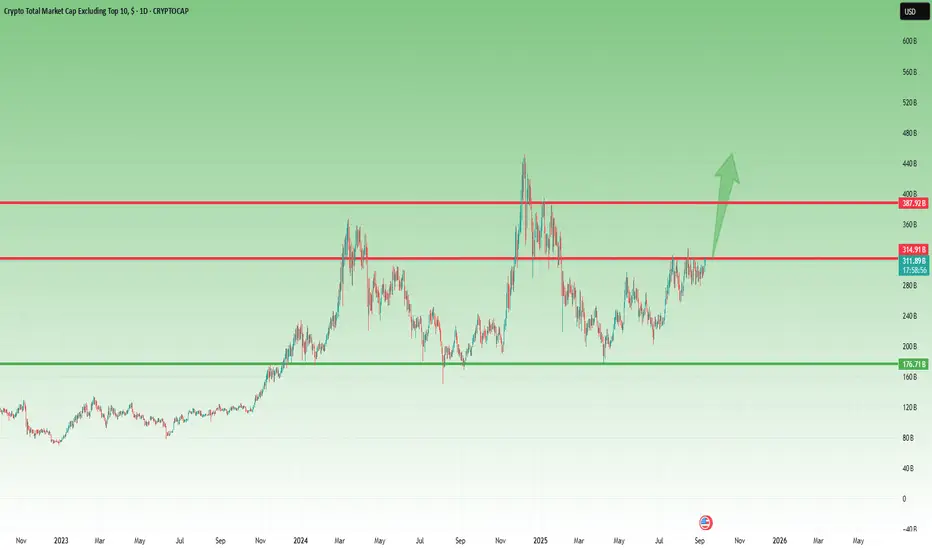
Massive ALTSEASON ahead.The Crypto Total Market Cap (excluding the Top 10) is staging a strong bounce on its 1M MA50 (blue trend-line), which as you see has been closing all 1M candles above it since November 2023!
With the multi-year pattern being a Channel Up, we are experiencing a prolonged Accumulation Phase similar to 2019. That gave rise to a Higher High on the 1.618 Fibonacci extension. This time the accumulation even takes place above the 0.5 Fib.
If the same 1.618 Fib Target is repeated, we are looking at a possible 1.63 Trillion market cap.
-------------------------------------------------------------------------------
** Please LIKE 👍, FOLLOW ✅, SHARE 🙌 and COMMENT ✍ if you enjoy this idea! Also share your ideas and charts in the comments section below! This is best way to keep it relevant, support us, keep the content here free and allow the idea to reach as many people as possible. **
-------------------------------------------------------------------------------
💸💸💸💸💸💸
👇 👇 👇 👇 👇 👇

Investing vs. Speculating in Crypto: Stop Mixing the TwoThe crypto market is in a correction, and every time this happens, I see the same pattern repeat: traders and investors talking about the moon — expecting 10x or 100x — but the moment their coin drops by 10%, they panic. They ask “What’s wrong?” or panic that the project is failing.
This is a misunderstanding of what it means to invest versus what it means to speculate. Let’s clear that up.
🚀 The Investor’s Perspective
If you believe Bitcoin is going to 500,000 USD, do you really care if it dips under 100k before reversing?
If you bought Solana with the vision of 1,000 USD, why should a retest of 150 USD make you nervous?
Investors understand:
Markets never move in a straight line.
Patience is essential — big returns require time.
Short-term corrections don’t change a solid long-term thesis.
If you’re aiming for 5x or 10x, you must accept that it takes months or years, not days.
⚡ The Speculator’s Perspective
Speculators play a different game:
They focus on short-term setups.
They use technical analysis and momentum.
They might even short-sell when the conditions align.
Both are fine — but the problem begins when people think they’re “investors” while acting like speculators every time the market moves against them.
🎯 Targets, Plans, and Patience
Here’s what most forget:
The market isn’t a straight line up designed for your convenience or for your dream Lambo
You need to set a clear target and be patient.
Want 5x on BTC? Or 10x on a strong altcoin? Then you’ll have to wait for it.
If you expect daily gains and can’t handle normal corrections, you’re not investing — you’re speculating without realizing it.
🤡 The Quick 10x Illusion
Yes, you can chase 10x in a day or two with meme coins on DEXes. Sometimes it works, most times it ends with rugs or sudden collapses. That’s not investing. That’s just gambling, and you can’t complain when it goes wrong.
✅ Final Thoughts
Decide who you are:
As an investor, set your targets, trust your thesis, and don’t panic on corrections.
As a speculator, play the short-term moves but accept the inherent risks and use discipline.
Crypto can deliver very big returns — but only if you stop mixing long-term conviction with short-term panic.
Patience and discipline will always beat hype. 🚀
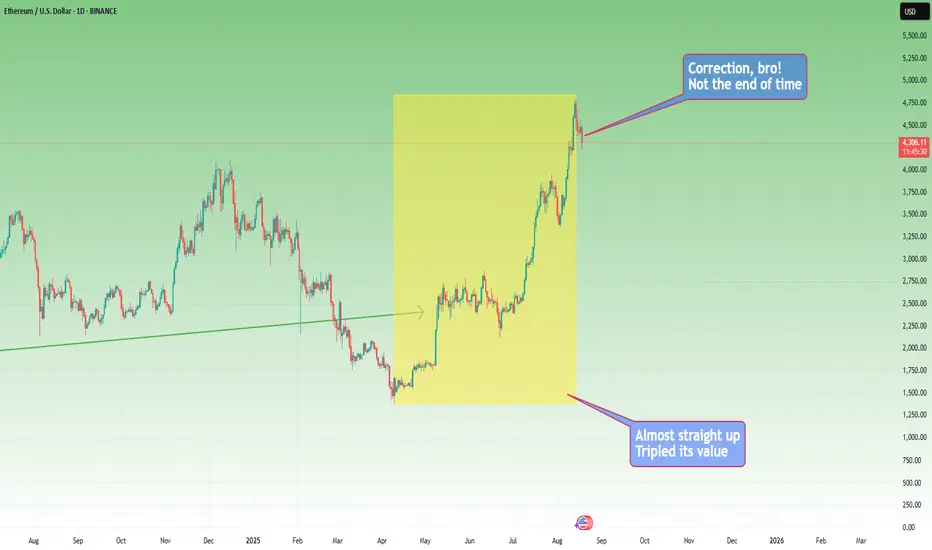
P.S.
Let’s take a concrete example: since April, ETH tripled in value in a nearly straight line. What do you expect — for it to keep rising like that to 25k by the end of the year?
Do you look at your portfolio daily expecting more money every single day?
Think also of those who bought ETH with 10 million dollars, not just 3 ETH for 5k.
Maybe they want to mark profits.
Maybe they need a new yacht:)
Their selling affects the market too — and corrections are part of the bull runs.
STRK Main Trend 12 04 2025Time frame 1 week for clarity.
Descending channel is the main trend.
Descending wedge is a secondary trend.
Showed the mid-term percentage for targeting potential profit within the channel after breaking through the wedge.
The price reached the lower zone of the descending channel of the main trend -96%.
This is conditionally the bottom for similar assets of such liquidity -95-98% . You can even say the minimums of minimums, beyond which there is only a complete scam, which is probably not distributed as an asset. Throughout the history of the formation of the descending channel, the trading volume was supported, many buybacks. The same volume is also pressuring to buy with “discounts”, what was previously poured "investments for billions of dollars" on Twitter during the listing.
Secondary trend, descending wedge and bearish trend break zone.
Time frame 3 days.

Altcoins Recovering: TOTAL3 Bounces from Key Support ZoneIn my previous analysis on TOTAL3, I mentioned that I'm working with two possible bullish scenarios for altcoins. It now seems we're firmly in Scenario #2.
📉 The price dropped exactly into the highlighted support zone, then yesterday we saw a clean recovery and reversal starting right from that area — a textbook technical reaction.
📈 At the time of writing, TOTAL3 sits at $986B, and a break above the $995B–$1T resistance could trigger a new leg up for altcoins.
🎯 Short- and mid-term targets remain:
• $1.08T (recent top)
• $1.15T
• Potential for new all-time highs if momentum builds
✅ As long as price holds above the $920–$930B support zone, bulls remain in control. This keeps the door open for selective altcoin entries — ideally, projects with real structure, strong tokenomics, and clear momentum.

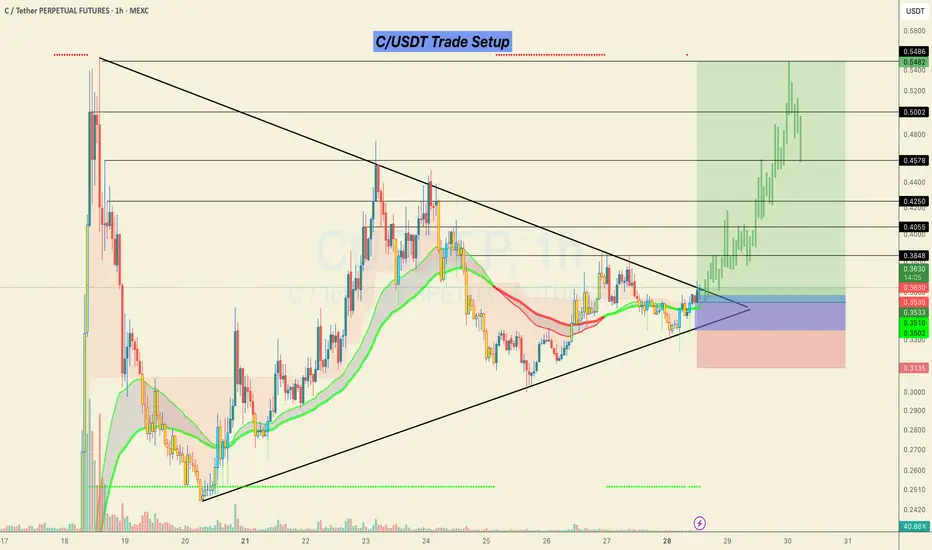
#C/USDT Looks ready for a 50% bullish move.C/USDT Trade Setup 📉
Currently forming a strong breakout structure after a long consolidation inside the triangle.
📌 Accumulation Zone:
0.3350 – 0.3580
🎯 Targets (Black Horizontal Levels):
0.4055
0.4250
0.4578
0.5002
0.5486
🛑 SL: Below 0.3135 (previous structural low)
Price broke out with solid momentum and retested the breakout zone. As long as we hold above the EMAs and the structure remains intact, continuation toward higher levels is likely.
This is a low-risk, high-reward setup as long as the risk is managed properly.
> Not financial advice. Trade at your own risk.
Do hit the like button if you want me to post more of these setups here.
Thank you
#PEACE
Drop Your Token – I’ll Do The AnalysisHey everyone! Hope you’re having an amazing weekend !
Want me to analyze your favorite token ? Just drop your request in the comments using this format:
Request Format
Project Name: Bitcoin
Token Symbol: BTC( BINANCE:BTCUSDT )
Important Notes:
I’ll pick and analyze only the first 10 tokens requested .
One request per person — so choose wisely!
I’ll reply directly under your comment with the analysis.
If you find this helpful, don’t forget to Like ❤️ and Share this post with your friends!
Here’s to your success — health, wealth, and great trades! 🚀

ALGOUSDT Daily Chart Analysis | Continuational patternsALGOUSDT Daily Chart Analysis | Momentum Picks Up on Higher Timeframe
🔍 Let’s break down the latest ALGO/USDT daily chart, highlighting a shift in market structure and key bullish signals.
⏳ Daily Overview
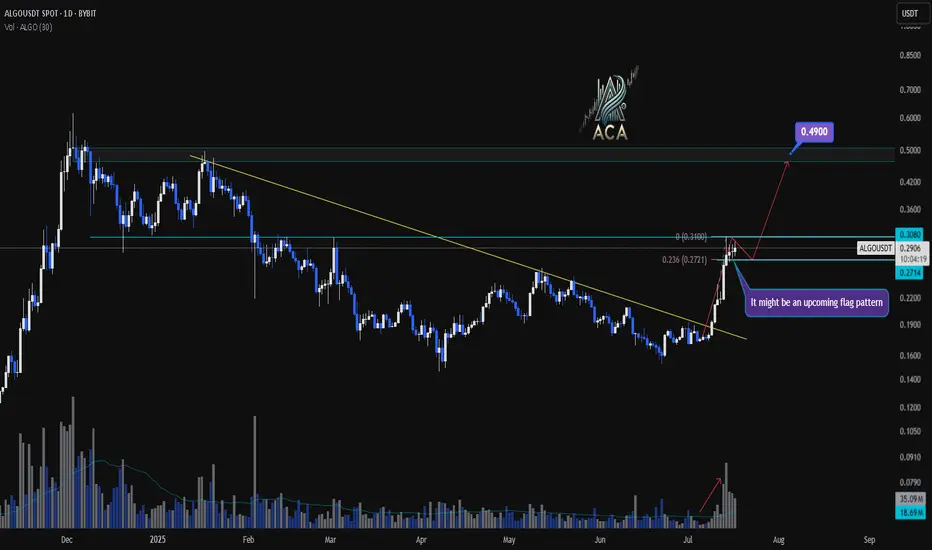
A decisive breakout above the long-standing descending trendline has flipped the narrative for ALGOUSDT. Increased volume during the breakout points to robust bullish momentum, suggesting buyers are regaining control at this multi-month inflection point.
🔔 Flag Pattern & Chart Structure
- Bullish flag pattern is emerging after the recent breakout, as price consolidates in a tight range—a classic continuation formation.
- Former trendline resistance is now acting as support, confirming a notable shift on the higher timeframe.
📐 Fibonacci & Target Levels
- The 0.236 Fibonacci retracement at $0.2771 is providing immediate support, with price consolidating above this anchor level.
- Upside targets:
- First resistance at $0.3080, which aligns with horizontal supply and previous pivot highs.
- If the flag pattern resolves upward, the next Fibonacci extension points to $0.4900, marking a significant confluence and potential for further gains.
📊 Key Highlights
- Strong daily candle and surging volume confirm momentum shift.
- Watch the developing flag pattern for breakout confirmation.
- Major trendline break on the daily signals structural reversal.
- $0.3080 is the immediate target; $0.4900 is the extended objective from the flag/Fibonacci alignment.
🚨 Conclusion
ALGOUSDT is setting up a compelling bullish scenario—keep a close eye on price behavior at the flag and $0.3080 level. A breakout may trigger the next impulsive move toward $0.4900.
$OMNI/USDT – Wait Before You ChaseSEED_DONKEYDAN_MARKET_CAP:OMNI has already exploded with a parabolic breakout, rallying massively after breaking above the falling wedge resistance around $1.63.
Current Situation:
Massive impulse candle from $1.6 to over $4.5
Price retracing after the overextended move
Strong rejection near $3.35
Ideal Entry Zone (wait-for-pullback):
Between $1.47 – $1.63
Aligns with previous resistance and breakout zone
Could act as retest support
Setup After Retest:
Entry: $1.50 – $1.63 range
SL: Below $1.36
Targets: $2.37 → $3.15 → $4.50
Risk-Reward: High if patience wins over FOMO
Patience is key. Don’t chase pumps. Wait for the price to cool off.
DYOR | Not financial advice
#OMNI #Altcoins

AVA/USDT – Long-Term Bullish Reversal in PlayAVA has been trading within a well-defined downward channel for weeks, making consistent lower highs and lower lows. However, price has now broken above the upper boundary of the channel with strong volume and momentum, signaling a potential trend reversal.
Technical Analysis:
Channel Breakout:
Price has successfully closed above the descending trendline (channel top), confirming breakout and bullish intent.
RSI Surge:
RSI has shot past 80, a sign of strong bullish momentum. Short-term pullbacks may occur, but long-term sentiment is shifting.
Higher Lows Forming:
Structure is starting to shift from bearish to bullish, especially with current candle body closings above $0.03016.
Volume Spike:
Notable increase in buying volume, often seen before trend flips in micro caps or small altcoins.
Key Levels to Watch:
Support Zones:
$0.03016 – Key breakout level; should act as support now
$0.02440 – Historical accumulation zone
$0.02100 – Long-term base support
Resistance / Target Zones:
T1: $0.04026 – Local structure and previous consolidation
T2: $0.05550 – Psychological and technical resistance
T3: $0.07971 – Major reversal zone
T4: $0.10185 – Long-term target from macro high
Stoploss:
$0.02400 (close below re-enters channel and invalidates breakout)
Entry Idea:
Accumulation Zone: $0.029–$0.031
This is the ideal area for positioning with minimal risk and a good reward ratio.
Not Financial Advice | DYOR Always

ZBCN/USDT | Breakout from Downtrend Channel | 360%+ Potential !!ZBCN has broken out of a clean falling channel on the 4H timeframe. This setup resembles the earlier rally in May that delivered over 350% upside. We may be setting up for another explosive move, contingent on a successful retest.
Trade Setup:
Entry (on retest): 0.002901 – 0.003021
Stop Loss: 0.00243 (below channel low)
Targets:
0.00375
0.00510
0.00685
Long-term target: 0.01137
Total potential upside: ~360%
Structure Analysis:
Price is now out of the descending channel
Previous move from similar breakout yielded ~357%
RSI climbing with volume surge — momentum shift evident
Watching BTC for macro support
This could be a game-changing entry for medium to long-term holders if the retest holds.
DYOR | Not financial advice

PARTI Setup: Key Reversal Zone Could Spark +50% RallyToday, I want to analyze the Particle Network ( BINANCE:PARTIUSDT ) project for you, which has a chance of increasing by +20% to +50% in the short term .
Let's first take a look at the fundamental state of the Particle Network (PARTI) project .
Particle Network is building a modular Layer-1 blockchain with a focus on Chain Abstraction, aiming to unify user experiences across multiple chains through:
Universal Accounts – Single account across all chains
Universal Liquidity – Access liquidity without bridging
Universal Gas – Seamless cross-chain transactions without gas token concerns
The project has:
Raised $25M+ funding from top-tier investors (Binance Labs, Animoca Brands, Spartan Group)
Integrated with 60+ blockchains and 900+ dApps
Reached over 1.3M testnet accounts and 27,100 daily transactions (Messari Q1 2025 report)
Recently launched UniversalX (a cross-chain DEX) as its flagship dApp
Summary:
Particle Network shows strong fundamentals with innovative tech, a growing ecosystem, and backing from major players in crypto. Long-term success will depend on user adoption of Universal Accounts and dApps like UniversalX.
------------------------------------------------------
Now let's take a look at the PARTI token chart on the daily time frame .
PARTI token is currently trading near Potential Reversal Zone(PRZ) , Monthly Support(2) . There is also a possibility of a Range channel forming, we should wait for the confirmation of the second bottom .
I expect the PARTI token to start rising again from the Potential Reversal Zone(PRZ) and near $0.14 .
Note: Stop Loss(SL)= $0.1177
Please respect each other's ideas and express them politely if you agree or disagree.
Particle Network Analyze (PARTIUSDT), Daily time frame.
Be sure to follow the updated ideas.
Do not forget to put a Stop loss for your positions (For every position you want to open).
Please follow your strategy and updates; this is just my Idea, and I will gladly see your ideas in this post.
Please do not forget the ✅' like '✅ button 🙏😊 & Share it with your friends; thanks, and Trade safe.
