XAUUSD – Bullish Sentiment Stays StrongHello everyone, what’s your view on OANDA:XAUUSD trend?
Last week, gold staged an impressive breakout in the final session, and it is now trading around 3360 USD.
This week, optimism remains strong across the market, with both Wall Street analysts and Main Street investors expecting higher gold prices.
Among 13 Wall Street experts surveyed, 8 (62%) forecast gold will rise, while 5 (38%) see prices moving sideways. None predicted a decline.
On the retail side, 194 Main Street investors participated in a Kitco News poll. 115 (59%) expect gold to climb, 35 (18%) anticipate a drop, and 44 (23%) remain neutral.
I also maintain a bullish outlook. What about you — where do you see XAUUSD heading this week?
Alyanalysis

GBPUSD – Bullish Pattern in Play?Hello everyone, what’s your view on FX:GBPUSD trend?
The pair is currently forming a potential inverse head and shoulders pattern , one of the strongest signals for a new bullish phase.
📌 Price is holding firmly above the key support zone at 1.340 – 1.322.
📌 If this support continues to hold, the potential target lies near 1.3750 , the previous swing high and completion point of the pattern.
The bullish outlook is favored, with buyers maintaining control. This could be a promising opportunity.
Do you think GBPUSD can reach the target of this analysis? Share your thoughts in the comments!

Gold Targets Historic Resistance ZoneHello, what do you think about the trend of OANDA:XAUUSD ?
Gold has just posted a strong rally following the Jackson Hole speech, where Fed Chair Jerome Powell signaled a more dovish stance and left the door open for potential rate cuts in the near future. The U.S. dollar and bond yields eased, creating favorable conditions for gold to climb higher. At present, the precious metal is trading around 3,371 USD and continues its upward momentum.
From a technical perspective, the chart is shaping an ascending triangle pattern with a flat resistance zone in the 3,400–3,450 range and a rising trendline providing support below. This formation typically signals the continuation of an uptrend. Should the price break out and close above this resistance area, higher targets will open up — aligning with my long-term outlook.
A clear breakout above this critical resistance zone is needed to confirm the next directional move.
What about you — how do you see gold’s next move? Share your ideas and thoughts in the comments.
Good luck!

Gold Continues to SurpriseHello everyone, let’s take a look at OANDA:XAUUSD !
Yesterday, gold continued to surprise us, as the metal made a strong recovery on Wednesday, trading around 3,345 USD in the US session after dropping to a three-week low of 3,311 USD earlier.
This recovery occurred as the US Dollar (USD) dropped from a one-week high. Additionally, gold reversed sharply upward as tensions in Ukraine did not ease as expected. The escalating tensions are not just between the US, Russia, and Ukraine, but Europe also wants its influence on the matter. Since Europe is not willing to compromise, a peace agreement seems unlikely to be reached.
From a technical perspective, gold successfully tested the previous resistance at 3,330 USD, turning it into new support, breaking out of the downward trendline. If gold maintains strength above this level, the next key targets to watch are 3,357 and 3,370 USD.
Regarding the trend outlook: Investors are closely watching the minutes from the latest Federal Open Market Committee (FOMC) meeting to gain insights into the US monetary policy direction in the short term.
Fed Chairman Jerome Powell will speak on Friday morning and is expected to update the Fed's monetary policy framework. Powell’s speech could provide a new perspective on internal FOMC support for a potential interest rate cut in September, which could set a new trend for XAU/USD.
Stay tuned with me! Don’t forget to like the post and share your views in the comments.
Good luck!

EUR/USD Rises Following Fed's RemarksHello everyone, glad to meet you again in today's discussion.
The FX:EURUSD exchange rate is surging, breaking above the 1.1700 mark during the U.S. session last Friday. The U.S. dollar weakened against other major currencies following the dovish remarks made by Fed Chair Jerome Powell at the Jackson Hole symposium, which helped fuel the rise of this currency pair.
Looking ahead, I expect the pair to break through the upper trendline and close higher in this region, setting up for a larger rally as outlined in the strategy on the chart.
Do you agree with this outlook? Feel free to share your thoughts.

Latest Gold Price Update👋Hello, what do you think about the trend of OANDA:XAUUSD ?
In the previous sessions, gold regained momentum, and at the time of writing, the precious metal is still trying to maintain its recovery, trading around 3337 USD.
Gold's recent recovery was marked by key economic news, including the PMI and the jobless claims data from the U.S.
Specifically, U.S. economic data showed mixed results, with initial jobless claims higher than expected at 235,000, signaling weakness in the labor market, which could push gold prices higher.
The preliminary PMI for manufacturing came in at 53.3, higher than the previous 49.8 and surpassing the forecast of 49.7, indicating expansion in the manufacturing sector. However, its long-term effects remain to be seen.
The Flash Services PMI came in at 55.4, higher than the forecast of 54.2 but lower than the previous 55.7, indicating growth in services but not as robust.
Overall, while the manufacturing and services sectors show recovery, the weak unemployment data continues to raise concerns about the economy, and gold is seizing the opportunity.
Technically, gold successfully broke through the downward trendline and formed a high at 3350 USD before adjusting. Two new support levels have formed, playing a crucial role for XAUUSD at this point. If the positive momentum continues, resistance targets at 3350 - 3357 and 3370 USD are key levels to watch.
Looking ahead: Another significant event to watch is Fed Chairman's speech at Jackson Hole today. His comments on future interest rates will decide the next move for both gold and the U.S. dollar. Stay alert!
Do you think gold can maintain above the two support levels until the end of the session? Leave your thoughts below 👇

GBPUSD: Bearish Momentum Persists Amid Weak Fundamentals ? FX:GBPUSD continues to show weakness both technically and fundamentally. The price action has shifted clearly from the previous upward channel to a clear downward structure, and sellers are still in control.
From a technical perspective, the pair has failed to hold above key resistance levels and continues to respect the descending trendline. Each retest of the upper boundary has been met with rejection. With this structure intact, the path of least resistance remains downward, targeting the next support level.
On the fundamental side, the US dollar is recovering, while the British pound faces pressure as UK economic indicators, including growth and inflation, point to a downturn. As long as these conditions persist, GBPUSD is unlikely to make a significant recovery.
Unless the descending trendline is broken with conviction, the bearish trend remains dominant, with further declines likely toward lower support zones.

EURUSD Continues to Follow an Uptrend ChannelHello, what do you think about FX:EURUSD ?
EURUSD is still trading within an ascending channel. Although the price has adjusted below the trendline, the uptrend channel remains intact.
Currently, the price is hovering around 1.160, which is our target for yesterday's correction. With the current market conditions, keep an eye on the lower limit of the channel to look for trading opportunities. As long as the channel holds, the long-term outlook for EURUSD remains bullish.
Do you agree with this view? Feel free to share your thoughts in the comments below.
Good luck with your trading!

AUD/USD Continues to Decline in a Downward Price Channel?Hello, what do you think about OANDA:AUDUSD ?
At the time of writing, AUD/USD is still maintaining its bearish momentum, trading within a downward price channel. The "Head and Shoulders" pattern has formed, pulling the pair down to test support around the 0.642 zone.
From an economic data perspective, the pair is dropping as the Australian Dollar faces pressure from weak economic data out of China and global concerns. Additionally, the US Dollar is strengthening due to the Fed's hawkish stance on interest rates, further pressuring AUD/USD.
The support level at 0.6420 is crucial, a break below this level could lead to further declines towards 0.6400 or even the lower limit of the channel.
Keep a close watch for potential trading opportunities and always trade safely.
Good luck with your trades!

EUR/USD - Bears Continue to DominateHello everyone, do you think FX:EURUSD will rise or continue to fall?
The EUR/USD pair continues to face short-term selling pressure today, with the price recently forming significant resistance levels. At the time of writing, the pair is trading around 1.164.
This movement is largely driven by a combination of technical factors and market sentiment, especially concerns about the global economy, including inflation fears and rising U.S. Treasury yields. These factors have added further downward pressure on the EUR/USD pair.
As seen in the chart, the price is struggling to break the resistance but has been unsuccessful so far. The trendline remains intact, and the bearish momentum may continue. As long as the trendline is protected by the bears, the downward targets will accelerate, with the 1.160 level in sight.
What do you think? Will EUR/USD reverse, or will it continue heading towards the next support target? Let me know your thoughts!

Silver Continues to Face Bearish Pressure ? Hello, what do you think about the trend of TVC:SILVER ?
Silver continues to face downward pressure as it trades within a descending channel. Recent price action shows that the metal is testing resistance and struggling to maintain upward momentum. Given the current market dynamics, including a strong US Dollar and global economic concerns, the bearish trend is likely to persist in the short term.
With the bearish factors and technical indicators in place, it’s important to closely monitor price action near the support zone to look for potential shorting opportunities. Be cautious and manage risk effectively.
As long as the trendline remains intact, selling remains the favored strategy.

BTC/USD Bearish Outlook: Key Levels to WatchHello everyone, what do you think about the trend of BITSTAMP:BTCUSD ? Here’s my bearish idea.
BTC/USD is currently under significant selling pressure due to a combination of technical factors, psychological resistance, and market news. Recently, BTC/USD has faced substantial selling pressure after reaching a new all-time high (ATH). As the chart shows, the price has struggled to maintain upward momentum and is now in a clear downtrend. The price is adjusting, testing key support levels, and is likely heading toward intermediate support at 110,000 USD, followed by 106,000 USD. Fibonacci projections also suggest this.
The Federal Reserve's tightening policy, global economic uncertainty, and regulatory concerns, such as government scrutiny over Bitcoin’s environmental impact and calls for tighter crypto regulations in multiple countries, are contributing to the market instability and risk-averse sentiment among investors.
In my personal assessment, Bitcoin is under pressure and may test deeper support levels. In the short term, I expect a correction, but of course, I can’t be certain about the long-term outlook! :D
So, feel free to share your thoughts on BITSTAMP:BTCUSD – I’d love to know what you think!
Good luck!

Latest Gold Price Update – Will the Downtrend Continue?Hello everyone, what do you think about OANDA:XAUUSD ? Will it go up or down?
As per our strategy from yesterday , gold has dropped sharply, currently trading around 3,315 USD, and down more than 300 pips from the previous session.
Gold continues to trade within a narrow range as traders await the next catalyst to drive price action, with the upcoming speech by Fed Chairman Jerome Powell being seen as a potential factor. Additionally, the recent recovery of the TVC:DXY index has also put some pressure on the strength of this precious metal.
From a technical perspective, gold has lost the 3,330 USD support level and remains capped below the descending trendline. The price is moving downward following the Dow Theory wave pattern. If favorable, the first profit-taking target (at the 1.618 level) at the round 3,300 USD mark may be pushed lower by the bears.
What do you think? How will gold move? Keep a close eye on the market to spot opportunities, and remember that trading with the trend is always a good strategy.
Good luck!

How Gold Is Moving TodayHello everyone, what do you think about OANDA:XAUUSD this week—up or down?
Today, gold saw a slight rebound, recovering over 10 USD during the Asian session, yet overall it remains within a downtrend pattern.
Gold has been under selling pressure following the release of the US PPI for July, which rose 0.9% month-on-month, far exceeding the 0.2% forecast. This fueled expectations that the Fed will be more cautious in cutting rates, supporting the US dollar and putting downward pressure on gold in the current phase.
The impact of this news is still lingering, and gold may continue along the current trend. On the short-term chart, gold is moving within a wedge pattern, with a high probability of a breakout as the price approaches the end of the formation. Careful entry timing is advised.
On the downside, support levels at 3,310–3,330 USD are closely watched. For buyers, potential targets are 3,360–3,370 USD.
Which direction do you think gold will break?

Gold Price Analysis: Short-Sell Opportunity?Hello everyone, what do you think about the gold price?
Today, the gold price continues to decrease within the same context, with no new volatility factors introduced since last Thursday. Currently, the trading level is hovering around 3333 USD.
Indicators and the 34 EMA and 89 EMA lines are still signaling a downward trend. A short-sell opportunity arises when the price tests resistance or breaks below the trendline. With Fibonacci levels at 0.5 and 0.618, the downward target could be towards 3,306 USD. If the price stays below key resistance levels, gold may continue its downward movement in the short term.
Trading Strategy: Prioritize short positions while the price remains below the upper trendline. Take Profit: 3,306.
What about you? Do you agree with my view? Feel free to leave your thoughts for further discussion.
Good luck!

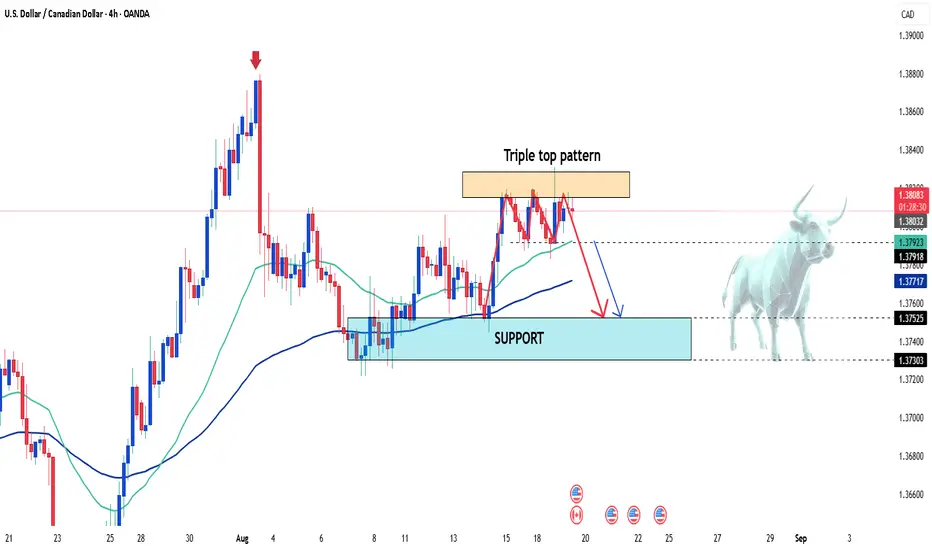
USDCAD Analysis: Triple Top Pattern and Bearish OutlookHello everyone, what do you think about OANDA:USDCAD ?
The USD/CAD pair has formed a Triple Top Pattern, indicating a potential reversal after struggling to break through recent highs. The price has failed to maintain the bullish momentum and has been rejected at key resistance levels. With the market showing signs of a downward trend, we can expect the price to continue to decline towards the support zone, a critical level to monitor.
The next key support level lies around 1.375. If the price continues to stay below the resistance, the likelihood of a drop to this level is high.
Stay alert and trade smart.
Good luck!
USD/CHF Under Downward Pressure - Will it Continue?Hello everyone, it's great to see you again.
OANDA:USDCHF is still under downward pressure after testing the resistance near the main trendline twice without breaking through. The price has been moving within a symmetrical triangle, fluctuating around the 0.805 zone.
The strong decline observed earlier in the chart shows that sellers are still in control. The environment remains favorable for the bears, with the next target for the sellers being the support zone at 0.802 - 0.800.
Do you think USD/CHF will continue to drop? Leave your thoughts in the comments below!

BTCUSDT – Bearish - BreakoutHello everyone, what are your thoughts on BINANCE:BTCUSDT ?
Bitcoin is currently trading around 115,300 USDT after breaking below the ascending trendline. This breakout signals a negative shift, pushing the price out of its previous bullish channel.
On the 4H chart, price action shows that the bears are regaining control. If the price fails to return to the broken support zone, the downtrend could extend towards the next key support at 112,200 USDT.
Any retracement back towards the resistance zone around 117,000 – 117,400 USDT could present a good opportunity for the bears to strengthen their position.
What do you think? Leave your thoughts in the comments below!

GBP/USD Continues Bullish Momentum ? Hello everyone, it's great to see you again.
Today, FX:GBPUSD has shown strong growth above the 1.3550 level and remains on an upward trend in positive territory. The recent weakening of the US Dollar (USD) after the latest data has allowed this pair to continue gaining momentum.
From a technical perspective, GBP/USD has broken the descending trendline and could potentially form a head-and-shoulders pattern. Before the pattern completes, a minor correction is expected. The subsequent bullish move will likely target the 1.374 level.
Let’s wait and see what happens. If you agree with this outlook, don’t forget to leave a like on the post.
Good luck!

EURUSD Holds Bullish Momentum – Next Target 1.177?Hello everyone, what do you think about the trend of FX:EURUSD ?
EUR/USD continues its upward momentum, trading in positive territory around 1.1700 during the end-of-week session. Mixed retail sales and consumer sentiment data from the US have made it difficult for the US Dollar to gain traction, allowing the pair to maintain its position.
The price is moving well within an ascending channel, and after a bounce from support, I expect the bulls to remain in control. The upper limit at 1.177, which also serves as H4 resistance, is my target for this idea.
What do you think about EURUSD? Leave your thoughts in the comments!

Gold Declines Until the End of the SessionHello everyone, what do you think about the trend of OANDA:XAUUSD ?
Gold continues its downward trend into the close of the session, currently settling at 3,335 USD and moving near the final support zone . The precious metal remains under pressure as the US Producer Price Index (PPI) rose by 0.9% in July.
From a technical perspective, the recent news continues to act as a barrier for XAUUSD, with the price moving below both the EMA 34 and EMA 89 and being limited by the trendline.
The price wedge is pushing gold down towards lower price zones, and as mentioned, gold is now testing the final support level (in the short term). If this level continues to break, the next target for sellers could be the round level of 3,300 USD.
What do you think about the trend of XAUUSD? Leave your thoughts in the comments!

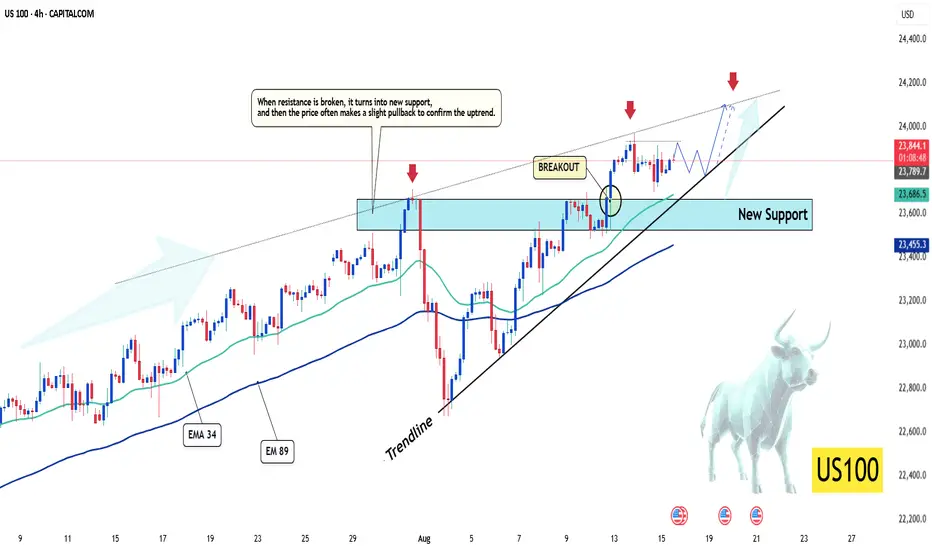
US100 – Bullish Momentum Holds Strong After BreakoutHello, what are your thoughts on CAPITALCOM:US100 ?
The US100 index is trading around 23,852, holding steady after a strong breakout from the previous resistance, now acting as new support at 23,685. This bullish structure is supported by the latest US economic data, which eased investor concerns — with lower inflation readings and recovering corporate earnings, boosting risk appetite.
On the 4H chart, price remains above both the EMA 34 and EMA 89, indicating strong underlying momentum. The recent breakout was followed by a period of consolidation, showing healthy market behavior before the next upward move. As long as price stays above the trendline, buyers maintain full control.
Even if a short-term pullback occurs, the support zone at 23,687 remains a solid base for buyers to re-enter near 24,200.
My outlook is bullish, what do you think? Leave your thoughts in the comments!
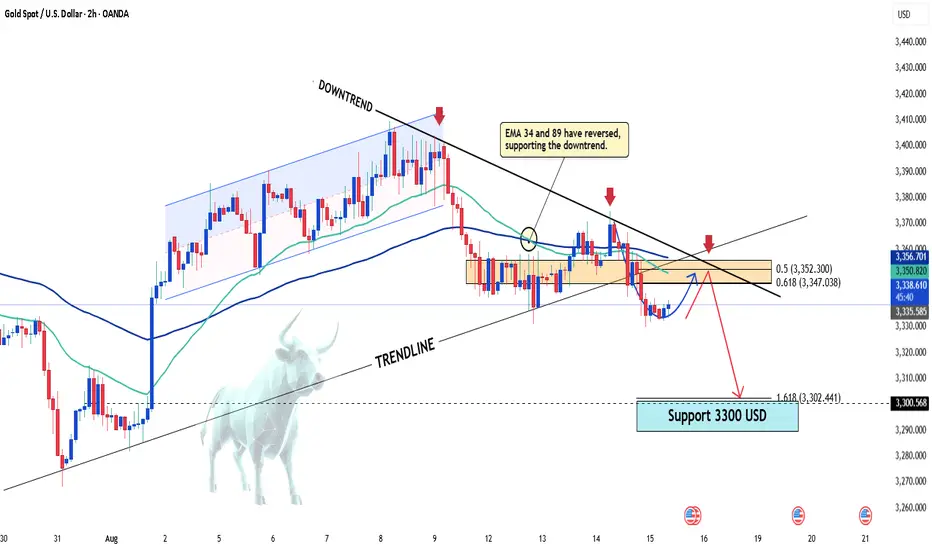
Gold Faces Sharp Decline After Key Data ReleaseHello everyone, what are your thoughts on the current trend of XAUUSD?
Contrary to expectations, gold saw a steep correction yesterday. The precious metal is now trading around 3,340 USD, roughly 30 USD lower than the previous session’s high.
This drop came after yesterday’s economic data release. Both the US Core PPI and PPI m/m surged by 0.9% (well above the 0.2% forecast), signaling significant producer inflation pressure. At the same time, Initial Jobless Claims fell slightly to 224K, better than the 225K forecast.
These figures have strengthened expectations that the Fed will be more cautious about cutting interest rates, which in turn has supported the USD and added downward pressure on XAUUSD after its previous rally.
From a technical perspective, gold has lost the 3,350 USD support level and broken below the old ascending trendline, now moving under a newly formed descending trendline. The EMA 34 and EMA 89 have also reversed, further reinforcing short-term bearish sentiment.
While a corrective bounce could occur, if these bearish factors hold, sellers are likely to remain in control, with the target once again set at 3,300 USD.
Indicators and tools used in my chart:
-EMA 34, EMA 89
-Regression trend
-Fibonacci
-Support and resistance
-Trendline