** Amazon Trend Analysis **Good Day Beautiful People,
Here's a short time analysis for amazon.
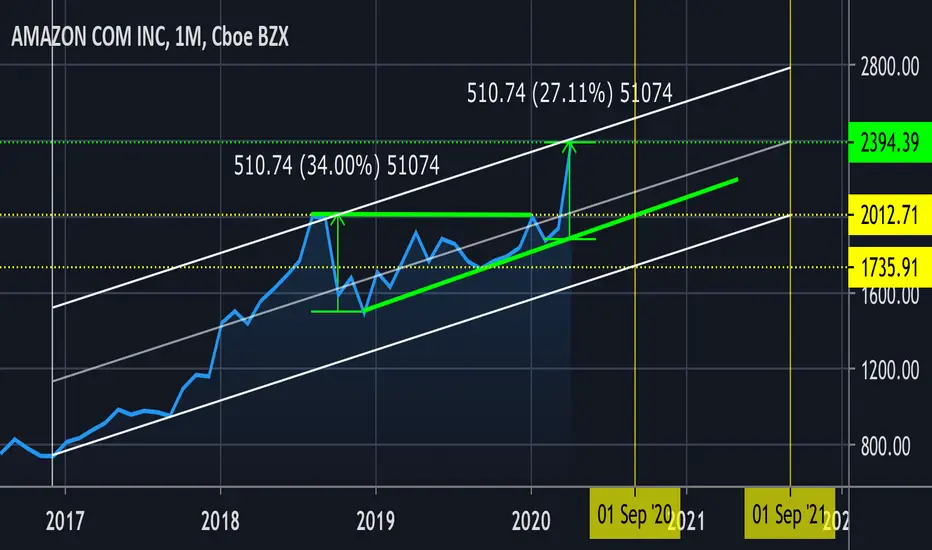
As you can see we have an important resistance at 2419.54$ which I think will soon be reached. An uptrend channel has been formed (you can see the channel better in shorter time frames) and is aiming towards the Resistance line.
We have a break out of a triangle pattern too, so that increases the chance of breaking the resistance line.
After all we have to be patient as always for the future price movements.
I think if the price can break the resistance line (with conformation indeed) it can be a good buying point.
Amazonshort


Gap fill speculative short$AMZN Price action has distributional characteristics and the gap fill looks like a good entry (LPSY in Wyckoff methodology) for a markdown phase. Next hourly candle should confirm or void the idea.

AMZNLooking at Amazon on the monthly chart
If you want to know what parabolic looks like, here is a great example.
Internal indicators:
* RSI heavily over bought and creating bearish divergence
* W%R very over bought and embedded
* Histogram has made a Lower Low that hasn't resolved itself yet and also creating bearish divergence
* OBV is still up and healthy due to the amount of money being poured into this asset.
* Many monthly gaps down in price that still are yet to be filled in
* VPVR is extreme running on single ticks ie not a lot of volume was traded on the move up
* Fib study done off the entire range
My opinion:
Just remember that the top still hasn't been put in yet, so this could still run higher. This is just a reminder that this asset is very over bought and people should be thinking twice about taking a long setups or investing in it long term. From the bottom of the range to the top AMZN has done approximately 18,000% (let that sink in) without a healthy retrace. We also have to take into consideration that AMZN has been in a range for 80% of its existence and has now been trending upwards for 20% of the time. (Investopedia) 80-20 Rule-
The 80-20 rule says markets trend about 20% of the time and spends the other 80% grinding through trading ranges, pullbacks, and other counter-trend action that tests boundaries. Price rate of change rises in trends, attracting the trend trader and falls in trading ranges, attracting the swing trader.
If you like what I do, drop a comment, tell me what you think and don't forget to like and subscribing. Thanks :)
Also don't forget to "plan your trade and trade your plan"


#AMZN expectation for 30/04/2020High Probability for the #AMZN going down to "2311.5" if the price break the 2363.26 However if bread the 2380 then will going up the "2414.05"


Strong bearish Signal | Sell AMZNHello everybody, please follow and support my analysis with a like.
AMZN is giving strong short term bearish signal for today's session. Sell AMZN

Amazon Completed Triangle, Now DownwardsCompleted ascending triangle pattern. Price could be in parallel channel. If so, price can drop to and bounce at the intersections of the yellow lines.
Sept 2020: possibly $2012 or $1735
Sept 2021: possibly $2012 unless price breaks below channel.
Comparison of Rising WedgesTwo rising wedges ATVI and AMZN
ATVI has already undergone a breakdown phase good for a short due to it being at a critical Fibonacci resistance, looking to recover on a long term uptrend
AMZN is quite extended and should pullback

AMZN Rising Wedge ~ BearishAmazon has formed a bearish rising wedge
I have included some fib spirals predicting tops and .236 as a possible bottom
Looks good for a short!
Learnt impulsive and responsive waves from Kinnari_Prajapati, thankyou.

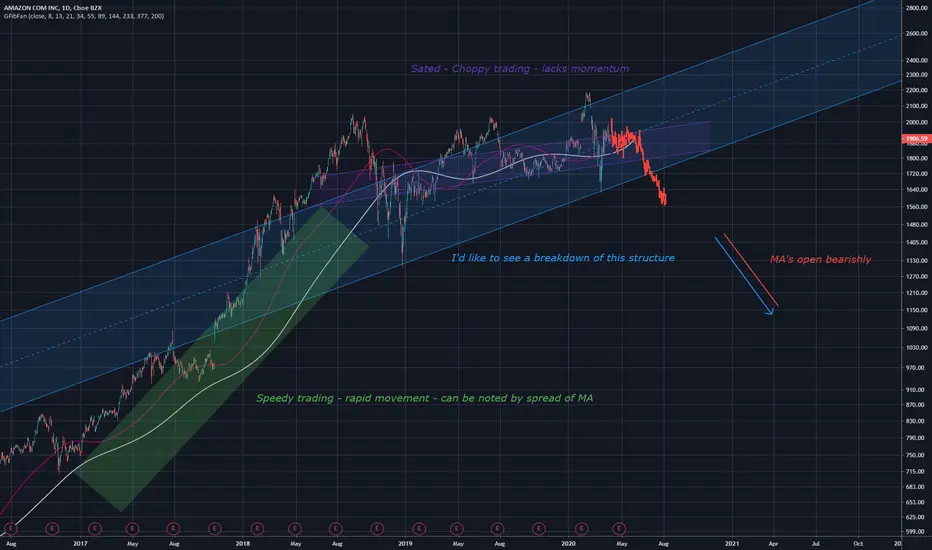
AMZN working hard or hardly working?AMZN has proven itself to has bullish features, but is that momentum slowing down? MA's indicate so, for now, momentum can be seen to be slower than the normal rapid bullish movements that are seen. This momentum will resume once MA's decide on a direction whether it be upwards and continuation of this very weak upward trend or breakdown to begin a new respectable move upward. I would either go long on this or short it.
AMAZON COM INC (AMZN) WeeklyDates in the future with the highest probability for price direction reversals


AMAZON technicaly for expecting is higher bearish market
ENTRY: 1885.00
TP: 1850.00
TP2: 1830.00
TP3: 1800
SL: 1915.00
Chart time frame - 4H
Time for reaching TP - 1-3D
Follow, Like, Share or Comment
Thanks on supporting!
All best!


Joshuas PredictionJosh believes AMZN is going to 1750 for no reason other than his Jewish intuition.
Buy the Rumor, Sell the News, Never Doubt the freakin' Jews

If it breaks that 1854 support then short it till 1823 You can wait for a pullback at 1823 if it happens and then long from there if nothing happens and downtrend continues then you can short till 1817 and 1739

Why amazon jumped ?!Christmas is over, Kwanzaa is just beginning, Hanukkah is just past its midpoint, and retailers are beginning to take stock of their performance during the holiday season. So far, one of the big takeaways this year is that consumers rushed to e-commerce sites to lock down early and last-minute gifts.
Between Nov. 1 and Christmas Eve, U.S. retail sales climbed 3.4% year over year, according to newly released data compiled by Mastercard (NYSE: MA) SpendingPulse. A breakdown shows that online shopping generated the majority of those gains, as e-commerce sales soared 18.8% during the period, compared to a 1.2% increase at brick-and-mortar stores, according to the report. Digital sales accounted for 14.6% of the total retail sales (a new all-time high).
One of the biggest beneficiaries of that trend was no doubt Amazon.com (NASDAQ: AMZN), and its stock is up more than 4% on the news that shoppers flocked to its platform in record numbers this holiday season.


Can AMZN price go down to $570?Hi traders / investors,
We are talking about the stocks market. There are patterns, noise and randomness of course. US stocks market has a bullish bias. However, past performance is not necessarily indicative of future results. We are talking about a game of probabilities and even 1% probability should be considered seriously. So let's have a look at AMZN chart here.
As we all know, AMZN price declined all the way down to $1307 on December 2018. $1307 is now a strong support. Meanwhile, it's a crucial zone for investors. If we see a drop below $1307, we can most likely see a decline all the way down to $507. I know it sounds like a conspiracy theory. But do you think there's 0% probability? This is not math but statistics. So there's no certainty but probability.
Technical Analysis
When we are talking about the technical analysis, what we are really doing is to analyse the past performance of the underlying. This gives us a clue what can happen in the future. There are tons of other factors like news, time, performance, momentum, fear, greed and etc. However, let's just have a look at the chart. As a technical trader, i only look at the charts. To me, news are in the charts. On 4th September 2018, Amazon reached ATH (all time high). 11th July 2019 is the confirmation of a range. Now AMZN is in the range. If you look closely, you can see an ascending and a descending trend lines. We call it triangle. They meet somewhere in the future. In this case, they meet in 2030. Wow, it is a wide range. What we all know is, AMZN price more than likely to test both ascending and descending trend lines. But we can not say when (can we?). As we know the range, why don't we just trade it? If the price goes above the descending trend line, we can short sell the stock (or buy some put options) and if it goes below the ascending trend line, we can long buy (or buy some call options). But in this particular case, if $1307 is broken, i would wait a little bit more. I will think that something is going wrong here.
Conclusion
I'm not saying that we are going down there. However, in case $1307 is broken, more than likely, AMZN to reach $570 level.
Disclaimer: I'm not a professional trader or financial advisor. This is not financial advice.
Trade safe,
Atilla

