AMAZON formed a 1D MA50/100 Bullish Cross. Accumulation ahead.It's been only 1.5 month since our long-term buy call on Amazon (AMZN):
The price rose aggressively after weeks of accumulation within the 1W MA200/300 and as we projected broke out hitting almost the first important long-term Resistance (1W MA50). On August 16 the price was rejected exactly on the 1D MA200 (orange trend-line), which was the point of rejection on the previous Lower High (March 29) of this 2022 correction phase.
The stock rose almost +45% from its June 14 Low, so profit taking was expected. The 0.382 Fibonacci retracement level broke and the price is just above both the 1D MA50 (blue trend-line) and the 1D MA100 (green trend-line). The former crossed today above the latter forming a technical Bullish Cross, the first such formation since December 03 2021. That was a far from ideal pattern as it broke the uptrend's Higher Lows trend-line and basically was at the start of the 2022 correction phase.
This time the Higher Lows trend-line is much lower (currently around $114.40) so on the medium-term we remain on a downtrend, until the 1W MA50 and Lower Highs Zone break. However, it is the first time we have such a strong and long uptrend on the 1W RSI, with its Higher Lows trend-line still intact.
Practically, as long as the 1D MA50/100 hold, we can expect a re-test of the 1D MA200. If they break, there is still a chance of finding Support on the 0.618 Fib. Further selling can be done below the Higher Lows trend-line.
--------------------------------------------------------------------------------------------------------
** Please support this idea with your likes and comments, it is the best way to keep it relevant and support me. **
--------------------------------------------------------------------------------------------------------
Amazonsignals

AMAZON Generational Bottom and buy opportunityAmazon (AMZN) has been trading within the MA300 (red trend-line) and MA200 (orange trend-line) on the 1W time-frame for more than 2 months. In multi-year terms, this is the equivalent of a bottom formation within the Bullish Channel that started after the bottom of the Dotcom crash in September 2001.
More specifically, the 1W MA300 hasn't been touched since January 2009 (bottom of the housing crisis) and the last time a (Higher) Low was formed within the 0.236 - 0.382 Fibonacci retracement levels (Fib Channel applied on the pattern) was within October 2014 - January 2015.
With the 1W RSI rebounding after breaking inside its multi-decade Buy Zone (has done so only another 3 times in 21 years) and the 1W LMACD inevitably about to make a Bullish Cross, this seems like a golden multi-year buy opportunity for Amazon. The Higher High target has been the 0.786 Fibonacci level since late 2018.
--------------------------------------------------------------------------------------------------------
Please like, subscribe and share your ideas and charts with the community!
--------------------------------------------------------------------------------------------------------

Amazon Analysis 17.02.2022Hello Traders,
welcome to this free and educational analysis.
I am going to explain where I think this asset is going to go over the next few days and weeks and where I would look for trading opportunities.
If you have any questions or suggestions which asset I should analyse tomorrow, please leave a comment below.
I will personally reply to every single comment!
If you enjoyed this analysis, I would definitely appreciate it, if you smash that like button and maybe consider following my channel.
Thank you for watching and I will see you tomorrow!

Amazon Analysis 21.01.2022Hello Traders,
welcome to this free and educational analysis.
I am going to explain where I think this asset is going to go over the next few days and weeks and where I would look for trading opportunities.
If you have any questions or suggestions which asset I should analyse tomorrow, please leave a comment below.
I will personally reply to every single comment!
If you enjoyed this analysis, I would definitely appreciate it, if you smash that like button and maybe consider following my channel.
Thank you for watching and I will see you tomorrow!

AMAZON The Triangle's of +100% riseThis chart is for the long-term investors. Being on the 1M (monthly) time-frame, AMZN has been trading within a Triangle (Ascending) since September 2020. This neutral mega-phase, has had many investors questioning whether the overbought state of early 2020 has made the stock lose its bullish dynamics. This pattern comparison with the previous neutral phase puts things into perspective.
As you see the same Triangle pattern was formed from August 2018 to March 2020. On a monthly basis, every candle closed below the Resistance and only when that broke, Amazon started a parabolic rally. In 2021 Triangle we've have two major monthly break-outs but both retraced below the Resistance within the same month, leaving just a candle wick reminding of the failed attempt.
The stock has a tendency of rising more than +100% when such break-outs take place. If you are a long-term trader/ investor, look for a 1M candle close above the Resistance as confirmation of a +100% rally.
* Useful correlation:
As the chart above shows, the LMACD indicates that Amazon is going trough distinct Cycles. Right now it shows that we are closer to a bottom.
--------------------------------------------------------------------------------------------------------
** Please support this idea with your likes and comments, it is the best way to keep it relevant and support me. **
--------------------------------------------------------------------------------------------------------

AMZN |Now is a good time for go long!If you find this technical analysis useful, please like & share our ideas with the community. Coming to the technical analysis of AMZN , I think we are going to see a strong upward movement. If you are going to go long now, make sure to place the stop below the previous support area .
What do you think is more likely to happen? Please share your thoughts in comment section. And also give a thumbs up if you find this idea helpful. Any feedback & suggestions would help in further improving the analysis.
Good Luck!
Disclaimer!
This post does not provide financial advice. It is for educational purposes only! You can use the information from the post to make your own trading plan for the market. But you must do your own research and use it as the priority. Trading is risky, and it is not suitable for everyone. Only you can be responsible for your trading.

AMAZON targeting $4300 once the accumulation is over.Since the Subprime mortgage crisis, Amazon has been repeating a very distinct pattern. After every correction, it gets supported by either the 1W MA100 (green trend-line) or the 1W MA150 (red trend-line) and spends almost a year inside an accumulation zone. Once that's over, it targets the 2.0 Fibonacci extension from the bottom of the correction.
The chart is on the log scale of course, in order to capture and better illustrate these patterns throughout AMZN's immense growth. See how the Accumulation Phases have a similar LMACD pattern every time.
Right now the price has only rebounded on the 1W MA50, three times since March 2021. I believe that as it happened in 2015 and 2020, it needs to hit one MA50 period lower than the first that supported and the next in line is the 1W MA100. Once successfully completed, I expect the price to make again a 2.0 Fib leap which right now is just over $4300.
** Please support this idea with your likes and comments, it is the best way to keep it relevant and support me. **
--------------------------------------------------------------------------------------------------------
!! Donations via TradingView coins also help me a great deal at posting more free trading content and signals here !!
🎉 👍 Shout-out to TradingShot's 💰 top TradingView Coin donor 💰 this week ==> Vergnes
--------------------------------------------------------------------------------------------------------

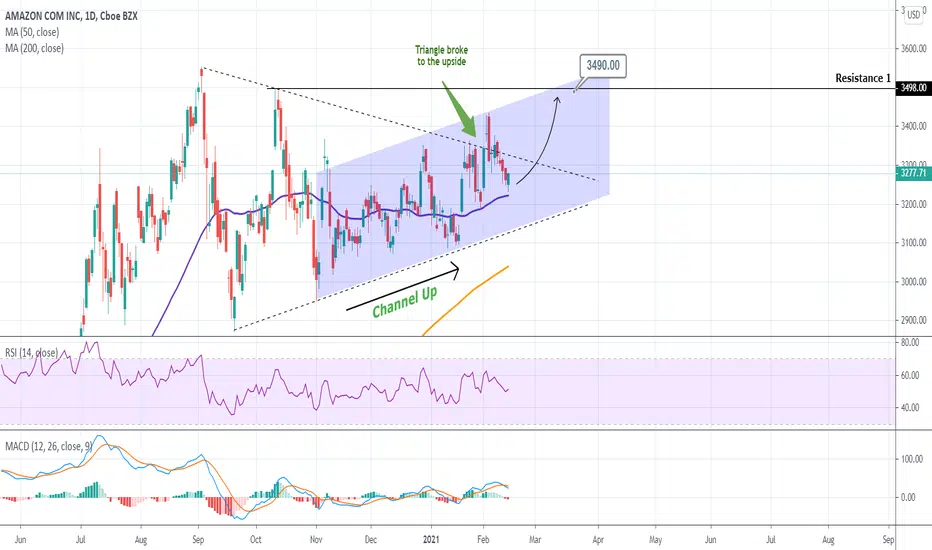
AMAZON Short-term target 3490Pattern: Channel Up on 1D.
Signal: Buy as the price is on the 1D MA50.
Target: 3490 (just below the Resistance 1).
** Please support this idea with your likes and comments, it is the best way to keep it relevant and support me. **
--------------------------------------------------------------------------------------------------------
!! Donations via TradingView coins also help me a great deal at posting more free trading content and signals here !!
🎉 👍 Shout-out to TradingShot's 💰 top TradingView Coin donor 💰 this week ==> TradingView
--------------------------------------------------------------------------------------------------------
AMAZON Buy opportunity or collapse?AMZN has been one of the top high cap performers after the pandemic strike. The recent selling got many late buyers worried but on a quarterly basis it appears to be a strong buy opportunity.
The pattern is a Channel Up on the log scale since March with the following indicators being is Support of a new rally:
* The price is near the Higher Low trend-line
* The MA20/MA50 are about to form a Death Cross. Last time that happened was on March 13 and that was done on the market bottom.
* The RSI is printing a sequence similar to the bottoming sequence of early March.
* The LMACD is close to forming a Bullish Cross.
Last time those indicators aligned, Amazon made a new High on the 1.382 Fibonacci extension. Assuming the same pattern is followed, we are looking at a $3900 target.
Are you a buyer?? Feel free to share your work and let me know in the comments section!
Please like, subscribe and share your ideas and charts with the community!
!! Donations via TradingView coins also help me a great deal at posting more free trading content and signals here !!
Shout-out to TradingShot's top TradingView Coin donor this week ==> billstenzel

S&P with and without AMAZON. What do you make of this?This chart comparison displays the S&P index with AMAZON (left) and without (right). The sole purpose is to highlight the big impact that AMZ has during the recent weekly rally after indices made a bottom.
As you see with AMAZON, S&P has been rising continuously since the March 23 bottom while without the weight of the pandemic-proof stock (since its on-line nature is favored by the lockdown) it is currently exactly on the March 23.
Food for thought on how bad the situation is on traditional companies. What do you think?
** Please support this idea with your likes and comments, it is the best way to keep it relevant and support me. **
