Amazon - A quite boring new all time high!🎈Amazon ( NASDAQ:AMZN ) is simply heading for new highs:
🔎Analysis summary:
For the past couple of months, Amazon has overall just been consolidating. But in the meantime, we witnessed a major bullish break and retest and an expected rally of +50%. Following this quite slow behavior, Amazon will also slowly create new highs.
📝Levels to watch:
$250
SwingTraderPhil
SwingTrading.Simplified. | Investing.Simplified. | #LONGTERMVISION
Amazontrade

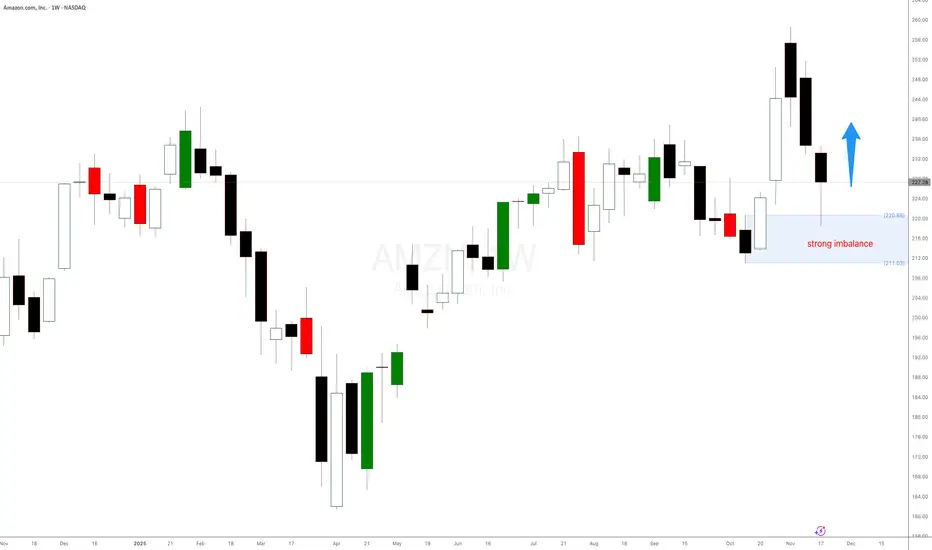
Amazon $AMZN weekly demand level at $221 is holdingAmazon weekly demand level at $221 is holding as expected. Amazon stock is trying to to print a new weekly high. Any long positions should be managed. Waiting for new imbalances and weekly highs.

AMZN: Rebuilding Structure After Sharp RotationOn the 4H chart, AMZN shows a sharp impulsive move followed by a volatile pullback and stabilisation. Price is now rebuilding structure after the rotation, suggesting the market is recalibrating before the next directional phase develops.
Disclosure: We are part of Trade Nation's Influencer program and receive a monthly fee for using their TradingView charts in our analysis.

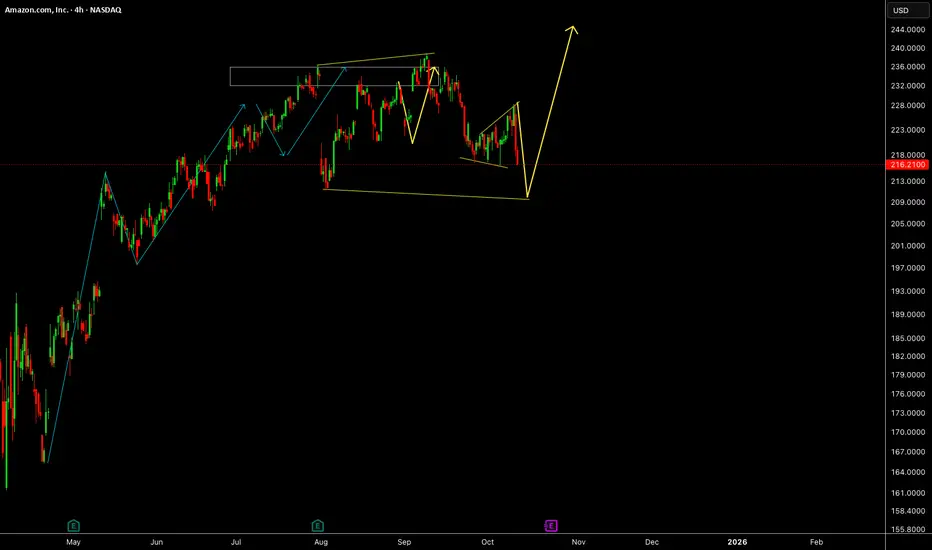
AMZN : What’s Taking Shape?Amazon’s recent recovery has developed into an interesting emerging structure. After the sharp drop and strong rebound, price is now building a potential continuation pattern. Momentum suggests the market may still be preparing for another upward leg once this consolidation phase completes. With the flow tightening, the next decisive move could unfold sooner than expected, making this setup worth monitoring closely.
**Disclosure:** We are part of Trade Nation's Influencer program and receive a monthly fee for using their TradingView charts in our analysis.

AMZN : Mid-Term Bullish Continuation OutlookAmazon is shaping a constructive bullish sequence on the 4-hour timeframe, with recent price action reinforcing renewed upside momentum. The unfolding structure suggests buyers may remain in control as the market progresses into December, keeping the continuation scenario active while the current rhythm holds.
Disclosure: We are part of Trade Nation's Influencer program and receive a monthly fee for using their TradingView charts in our analysis.

Is Amazon exploding again? New weekly demand in controlIs Amazon exploding again? New weekly demand in control at $224. Expecting a decent rally from here in the following days.
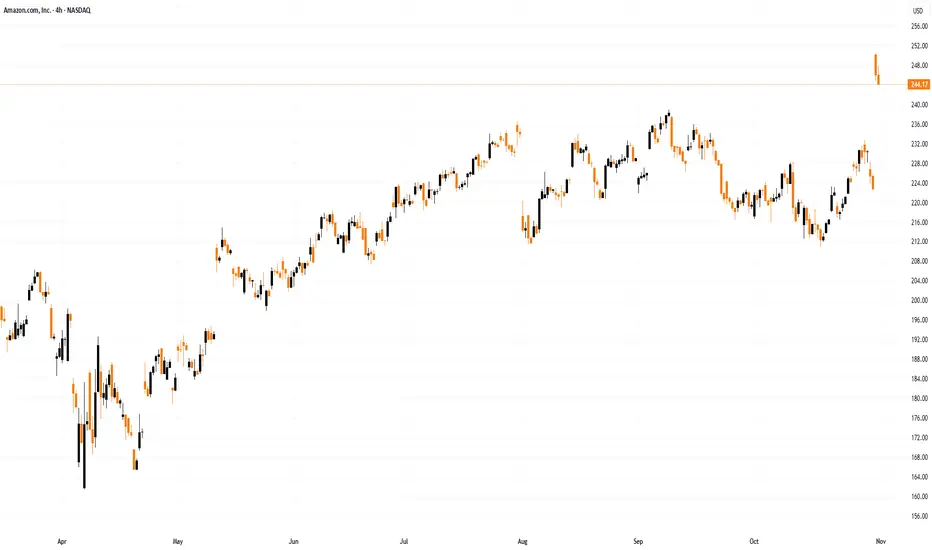
Amazon (AMZN) Shares PlungeAmazon (AMZN) Shares Plunge
As the chart shows, Amazon (AMZN) shares fell to around $222 yesterday, despite trading above $255 at the start of the month.
The price drop is the result of several factors, including:
→ A rating downgrade from Rothschild & Co. Redburn (to “Neutral”). Analysts doubt that Amazon’s massive investments in artificial intelligence will pay off as quickly as its earlier spending on cloud technologies once did.
→ Pressure from the Federal Trade Commission (FTC). A court hearing on accusations that Amazon engaged in anti-competitive practices and overcharged US households (by more than $1bn) has been officially scheduled for February 2027.
Technical Analysis of Amazon (AMZN)
Reviewing the chart from 3 November (when the price climbed above $250 following a strong earnings report), we:
→ used the fluctuations in AMZN’s share price to outline an ascending channel (shown in blue);
→ suggested that the initial reaction to the report might have been overly optimistic and pointed to a potential corrective move.
However, the subsequent decline of more than 13% from the November peak appears too deep to be considered a mere correction – the price is now below where it stood before the report was released. It is reasonable to assume that the surge in AMZN above the psychological $250 level on strong news was used to lock in profits from large long positions, and that market sentiment has since shifted dramatically.
Nevertheless, in the short term, AMZN traders may look for a rebound from the lower boundary of the channel. In the longer run, a bearish breakout from the current channel should not be ruled out – especially if news flow around AI takes a gloomier turn. Today, all eyes are on Nvidia’s (NVDA) earnings report.
This article represents the opinion of the Companies operating under the FXOpen brand only. It is not to be construed as an offer, solicitation, or recommendation with respect to products and services provided by the Companies operating under the FXOpen brand, nor is it to be considered financial advice.

Amazon Raises $15B for AI Expansion — Stock at Key Support ZoneAmazon has launched its first US dollar bond sale since 2022, securing $15 billion to accelerate investments in AI infrastructure. Demand was massive, reaching $80 billion, signaling strong investor confidence in Amazon’s long-term growth story. The funds will support capital expenditures, acquisitions, data-center expansion, and upcoming debt maturities.
This move aligns with a broader trend among tech giants aggressively raising capital to scale AI systems. Meta issued $30 billion earlier, Alphabet raised $25 billion, and Oracle sold $18 billion in September. The surge in funding reflects the rising cost of advanced chips, cloud infrastructure, and high-capacity data centers needed to stay competitive in the AI race.
Amazon, the world’s largest cloud provider through AWS, is increasingly focused on high-performance computing and generative AI models. The new capital gives Amazon more room to expand capacity, boost margins through automation, and strengthen its competitive edge in enterprise AI services.
Amazon’s stock (AMZN) is pulling back from the $258 resistance, forming a corrective move toward a key support area around $232. This level aligns with the structure seen on the weekly chart and acts as a short-term demand zone. A strong bullish reaction here would likely set the stage for a retest of the $258 high, followed by a potential breakout if momentum returns.
If $232 fails to hold, the next major support sits at the ascending trendline zone, which has guided Amazon’s uptrend since early 2023. A deeper correction remains possible, but the broader structure is still bullish as long as price holds above the trendline.
The RSI is cooling off, suggesting the correction is healthy rather than a trend reversal. If Amazon bounces from support, the next major upside target sits between $280 and $300, aligning with long-term Fibonacci extensions.

AMZN : Bulls Taking a Pause Before the Next Leg Up!Amazon’s recent surge has hit a temporary Pause, forming a healthy pullback phase. If structure remains intact, another bullish wave could follow soon. Key levels to watch: 238–240 for a potential continuation setup.
Disclosure: We are part of Trade Nation's Influencer program and receive a monthly fee for using their TradingView charts in our analysis.

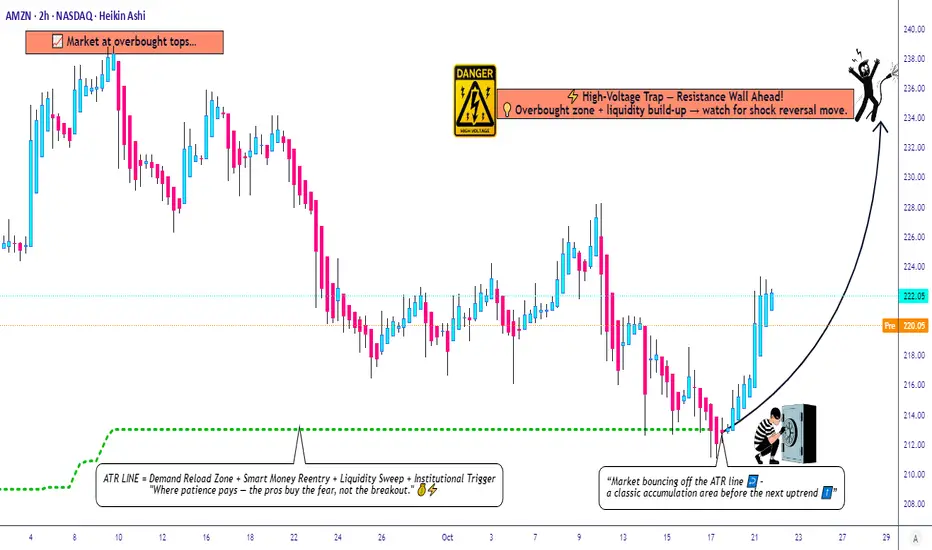
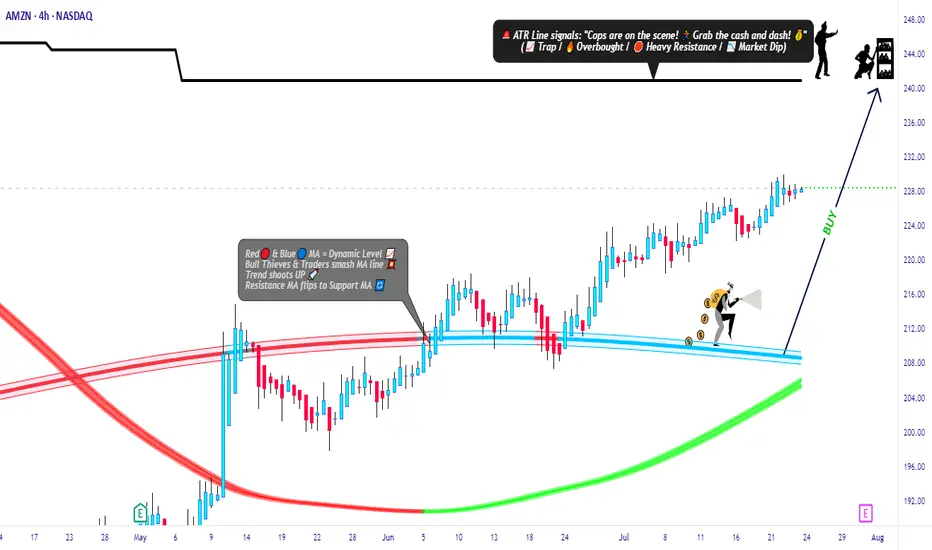
Amazon’s Hidden Pullback Opportunity – Smart Risk, Smart Entry🎯 AMZN: The "Thief's Playbook" — Stealing Profits Like a Wall Street Ninja
📊 Asset Overview
AMAZON.COM INC (NASDAQ: AMZN) — The E-Commerce Titan & Cloud King 👑
Strategy Type: Swing/Day Trade — Bullish Pullback Setup
Confirmation Tool: ATR (Average True Range) ✅
🎭 The "Thief Strategy" Explained
Listen up, Thief OG's! 🦹♂️ This ain't your grandma's single-entry trade. We're using layered limit orders — think of it like setting multiple traps to catch money at different price levels. Professional? Yes. Legal? Absolutely. Stylish? You bet! 😎
🔥 Entry Zones — The Multi-Layer Trap
The Thief's Ladder Entry Method:
You've got options, trader! Pick your poison:
Option 1: Aggressive Single Entry
Jump in at current market price (~$220-$225 zone)
Option 2: The Layered "Thief" Method 🎯
Set multiple buy limit orders to scale in:
Layer 1: $220
Layer 2: $218
Layer 3: $216
Layer 4: $214
Why layer? Because markets don't move in straight lines, baby! This lets you average down if price dips while maintaining a solid risk profile. Add more layers based on your risk appetite! 🍰
🛑 Stop Loss — Protecting Your Loot
Thief's Emergency Exit: $210 🚨
⚠️ IMPORTANT DISCLAIMER:
Dear Ladies & Gentlemen (my fellow Thief OG's), I'm NOT telling you to blindly follow my stop loss. This is MY risk management. YOU manage YOUR money. Trade at your own risk — this is entertainment with charts, not financial advice! 🎲
🎯 Target Zone — Where We Cash Out
⚡ High-Voltage Trap Alert — Resistance Wall Ahead! ⚡
Target Price: $235 🎯💵
Why this target?
💡 This zone shows classic signs of:
Strong resistance from previous price action 🧱
Overbought conditions brewing (RSI warming up) 📈
Liquidity build-up (big money sitting here) 💰
Potential "bull trap" zone → smart money escapes here! 🪤
My advice? When price hits $235, secure your profits! Don't get greedy.
⚠️ ANOTHER DISCLAIMER:
Dear Thief OG's, this is MY target based on MY analysis. You do YOU. Take profits when YOU feel comfortable. Your money, your rules, your risk! 💪
🔗 Related Assets to Watch
Keep an eye on these correlated movers — they can give you early signals for AMZN's direction:
📦 E-Commerce & Tech Giants:
NASDAQ:TSLA (Tesla) — Tech sentiment leader; when tech rallies, AMZN often follows 🚗⚡
NASDAQ:MSFT (Microsoft) — Cloud competitor (Azure vs AWS); inverse correlation sometimes kicks in ☁️
NASDAQ:GOOGL (Alphabet) — Ad spending indicator; strong Google ads = strong consumer spending = bullish for AMZN 🔍
NYSE:WMT (Walmart) — Retail competitor; if WMT struggles, AMZN often benefits 🛒
📊 Market Indices:
NASDAQ:QQQ (Nasdaq 100 ETF) — AMZN is heavily weighted here; QQQ direction = AMZN direction 📉📈
AMEX:SPY (S&P 500 ETF) — Overall market health check; risk-on = AMZN rallies 🇺🇸
💵 Market Sentiment Indicators:
TVC:VIX (Volatility Index) — Low VIX = calm markets = bullish for growth stocks like AMZN 😌
TVC:DXY (US Dollar Index) — Weak dollar = bullish for mega-cap tech stocks 💵📉
The Correlation Play: If you see NASDAQ:QQQ breaking higher + TVC:VIX dropping + tech stocks rallying → high probability AMZN follows the party! 🎉
🧠 Key Technical Points
✅ ATR Confirmation: Volatility is in the "sweet spot" — not too choppy, not too sleepy
✅ Pullback Structure: Classic bullish retracement setting up
✅ Risk-Reward: Solid 2:1+ ratio with layered entries
✅ Volume Profile: Watching for confirmation on breakout
⚠️ Legal Disclaimer — Read This Twice! 📢
THIS IS THE "THIEF STYLE" TRADING STRATEGY — JUST FOR FUN & EDUCATIONAL ENTERTAINMENT! 🎭
I am NOT a financial advisor. This is NOT financial advice. This is a trading idea based on technical analysis, shared for educational and entertainment purposes only.
❌ Do NOT risk money you can't afford to lose
❌ Do NOT trade based solely on this idea
❌ Do your own research (DYOR)
❌ Past performance ≠ future results
✅ Trade responsibly and manage your risk
You are 100% responsible for your own trading decisions. I'm just a chart nerd sharing ideas with the community! 🤓📊
💬 Final Thoughts from Your Friendly Neighborhood Chart Thief
Markets are a game of patience, discipline, and calculated risks. The "Thief Strategy" is about being strategic, not reckless. Set your traps, manage your risk, and let the market come to you! 🕸️💰
Stay sharp, stay profitable, and remember: the best trades are the ones you plan, not the ones you chase! 🏃♂️💨
✨ If you find value in my analysis, a 👍 and 🚀 boost is much appreciated — it helps me share more setups with the community!
#AMZN #Amazon #StockMarket #SwingTrading #DayTrading #TechnicalAnalysis #BullishSetup #LayeredEntry #ThiefStrategy #TradingIdeas #ATR #ResistanceZone #TakeProfit #RiskManagement #NASDAQ #TechStocks #PullbackTrading #PriceAction #SupportAndResistance #TradeSmart
Trade safe, trade smart, and let's get this bread! 🍞💸
AMAZONAMAZON has done exactly what we expected, now we will wait for correction to finish in this week for further upside.
Disclosure: We are part of Trade Nation's Influencer program and receive a monthly fee for using their TradingView charts in our analysis.

Amazon (AMZN) Shares Reach $250 for the First TimeAmazon (AMZN) Shares Reach $250 for the First Time
As the chart shows, Amazon (AMZN) shares rose to a record high on Friday, reaching the $250 mark for the first time. This came after the publication of a strong earnings report:
→ Revenue: $180.2 billion (up 13% year on year).
→ Earnings per share (EPS): actual = $1.95, forecast = $1.56 (a 25% beat).
Investor sentiment was further boosted by the following:
→ AWS (Amazon Web Services) revenue grew by 20% year on year, despite competition from Microsoft Azure and Google Cloud.
→ Amazon issued a confident outlook for the crucial holiday (fourth) quarter.
Technical Analysis of Amazon (AMZN) Chart
When analysing the chart on 24 September, we:
→ used AMZN share price fluctuations to construct an upward channel (shown in blue);
→ noted early signs of weakness.
Subsequently, the price reached a low at point A – where the bulls found support from the lower boundary of the channel and the August low (in fact, there was a false bearish breakout) – and made a successful attempt to resume the uptrend.
The two red candles on Friday suggest that the initial reaction to the report may have been overly optimistic (as confirmed by the RSI indicator). Therefore, it is possible that a corrective move will follow – for example, towards the support area that includes:
→ the median line of the current channel;
→ the previous all-time high of $242;
→ the September high around $238;
→ the 0.382 Fibonacci retracement level of the A→B impulse, around $235.
This article represents the opinion of the Companies operating under the FXOpen brand only. It is not to be construed as an offer, solicitation, or recommendation with respect to products and services provided by the Companies operating under the FXOpen brand, nor is it to be considered financial advice.
AMAZONAMAZON has done what we expected last week, this week we are expecting an up move to start.
Disclosure: We are part of Trade Nation's Influencer program and receive a monthly fee for using their TradingView charts in our analysis.

AmazonAmazon has given us small push up but slow last week, we will expect some more drop this week before a major push up.
Disclosure: We are part of Trade Nation's Influencer program and receive a monthly fee for using their TradingView charts in our analysis.
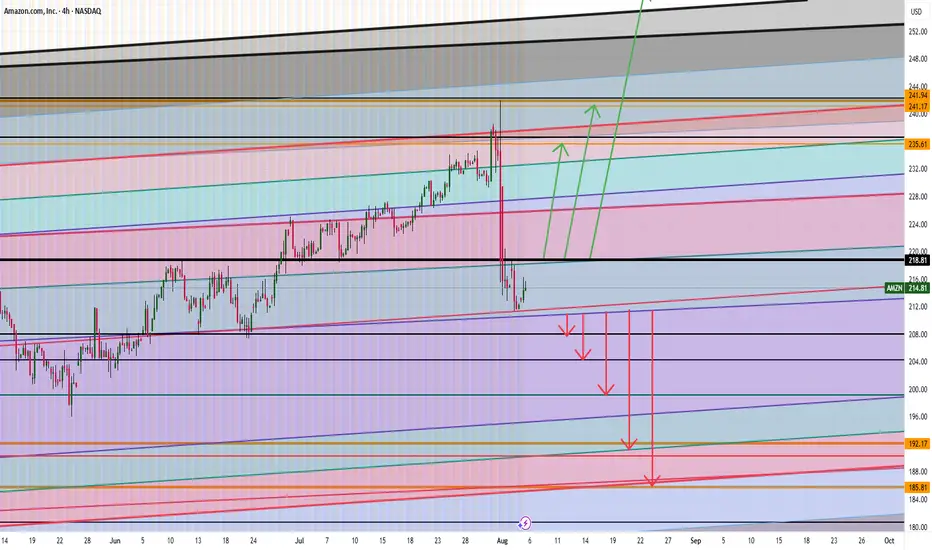
AMAZON ARE WE HEADING TO $258 ? HERE IS THE FULL ANALYSIS Hi Trading fam
So we have Amazon and based on what we are seeing we see two scenarios playing out:
Bullish:
If we can break and hold above 219 then we can see levels of : 235,241,and 258 being hit
Bearish:
If break the low of 210 then we hit 207,204, 199, 190 and then 185
Trade Smarter Live Better
Kris
Amazon (AMZN) Shares Jump Over 4%Amazon (AMZN) Shares Jump Over 4%
Amazon (AMZN) shares were among the top gainers in the equity markets yesterday, rising more than 4% and closing above $235 for the first time since February 2025.
The rally was fuelled by reports that Kuiper – Amazon’s project aimed at providing internet access via a network of low-Earth orbit satellites – has signed a partnership agreement with JetBlue. From 2027, this will allow free Wi-Fi to be offered on board selected aircraft. As a result, Amazon’s project is emerging as a new competitor to Elon Musk’s Starlink.
Technical Analysis of Amazon (AMZN) Chart
Since August, AMZN’s price fluctuations have been forming a bullish structure of higher highs and higher lows (0-A-B-C-D-E-F).
These and other key turning points provide the basis for constructing an upward channel (shown in blue), with the following implications:
→ in the near term, the price could surpass the previous high at point E, extending the bullish structure;
→ the channel median has proved to be an important support level – it held the price during the early August decline and continued to play this role throughout the month.
It is worth noting that AMZN’s upward momentum within the channel is unfolding step by step, making it possible to draw intermediate resistance lines R0, R1, and R2. In this context:
→ they can be viewed as examples of a bullish flag chart pattern;
→ yesterday’s rally with a bullish gap may signal the start of a new growth phase towards the next resistance at R3.
However, on this path, hurdles could come from:
→ the upper boundary of the blue channel;
→ the $230 level, around which a bearish head and shoulders pattern formed in February, marking this year’s high;
→ the psychological level of $250.
This article represents the opinion of the Companies operating under the FXOpen brand only. It is not to be construed as an offer, solicitation, or recommendation with respect to products and services provided by the Companies operating under the FXOpen brand, nor is it to be considered financial advice.

Amazon Market Robbery Blueprint – Swing/Scalp Long Setup🟨💣 “AMZN Market Heist Blueprint – Bullish Robbery in Progress 🚨💼💸” 💣🟨
By Thief Trader – Rob the Market with Precision
🌍 Hello World! Hi, Hola, Ola, Bonjour, Hallo, Marhaba!
🤑💰 Calling all Money Makers & Market Robbers – get ready to execute the next bullish heist on AMAZON.COM, INC (NASDAQ: AMZN), powered by our signature Thief Trading Style™ – where technical precision meets psychological warfare.
🔥 Plan Summary:
Based on our fundamental & technical intel, we’re eyeing a long entry into AMZN. The target? 💥The High-Risk ATR Police Barricade Zone – a zone flooded with liquidity, overbought conditions, fakeouts, and bear traps. It's where most traders get caught – but we walk in with a blueprint.
🟩 Entry Zone – “The Vault Is Wide Open!” 💼📈
🕰 Entry timeframe: 15min / 30min (preferably after confirmation or rejection wick)
💵 Buy Limit Orders: Place multiple layered entries (DCA-style) near recent swing lows/highs. Wait for breakout confirmation; no blind orders before breakout!
Thief Note: This isn’t spray-and-pray – this is sniper-mode. Scope, place, execute.🎯
🛑 Stop Loss – “SL is the Escape Route!”
📍 SL below recent 4H candle wick swing low (around 219.00 – adjust based on your risk/margin size).
Important: Only place SL after breakout; not before. Risk per order must match your lot strategy.
🎯 Target – “Grab the Bag or Escape Before the Alarms!”
💸 Target Zone: 240.00
🧠 Smart robbers know when to bail early – use a trailing SL to lock gains. Exit before reversal or heavy volume shift.
👀 Scalper Alert – “Only One Way – LONG!”
If you’re a quick thief with a fat bag, hit-and-run with a Long scalp. If you’re running lean, swing with the crew. Watch the PA and news timing. Trailing SL = insurance policy.
📊 Why Bullish? Here’s the Background:
🔍 Macro Drivers
💼 COT Report
🌍 Geo-political Influences
🧠 Sentiment Score
📈 Index Correlation
🔮 Intermarket Signals
💹 Institutional Positioning
All lights flashing green for short-to-midterm bullishness, but keep checking real-time updates.
⚠️ Risk Alert – News Triggers Can Blow Your Cover 🚨
🗞 Avoid trading near major news releases – they cause volatility spikes.
🧲 Always protect gains with trailing stops and don’t over-leverage your ammo.
💖 Support the Robbery – Hit BOOST 🔥
Smash that 💥BOOST💥 button if you ride with the Thief Trading Crew!
Let’s build this into the #1 robbery squad on TradingView.
Make money. Protect profits. Trade like a bandit – with a plan. 💼📈🏆
🔔 Stay Tuned for the Next Robbery Mission 🔔
Another heist plan dropping soon. Until then, rob smart, rob safe, and rob rich.
– Thief Trader™ | Rob The Market. Not Your Wallet.
Amazon (AMZN) Shares Rise Ahead of Earnings ReportAmazon (AMZN) Shares Rise Ahead of Earnings Report
Today, 31 July, Amazon is set to release its quarterly earnings after the close of the regular trading session. Available data show that Amazon (AMZN) shares are exhibiting bullish momentum, reflecting positive market expectations:
→ In July, AMZN shares have outperformed the S&P 500 index (US SPX 500 mini on FXOpen);
→ Yesterday, following the end of the regular session, AMZN shares surged by approximately 3% in after-hours trading.
The rise in AMZN comes amid strong earnings reports from other tech giants, such as Microsoft (MSFT) and Meta Platforms (META). For example, MSFT shares rose by more than 8% in post-market trading. Their success has likely fuelled optimism that Amazon’s upcoming report will also impress.
All of this has brought noticeable changes to the technical outlook for the AMZN stock price.
Technical Analysis of the Amazon (AMZN) Chart
Following the release of the previous earnings report, price movements have formed an upward channel, as indicated by the Regression Trend tool. However, in recent days, a series of bearish signals emerged:
→ On Thursday, AMZN broke above the $230 level (marked by an upward arrow), but the session closed well below the highs – a sign of selling pressure;
→ Friday and Monday’s sessions produced candles with small bodies, indicating market indecision;
→ On Tuesday, bears took the lead (marked by a downward arrow), with a relatively long candle closing near the session low.
Thus, the chart gave reason to assume that optimistic sentiments were waning. However, today’s session is likely to open near the $237.30 level, effectively negating the bearish interpretation of the previous five candles and shifting momentum back in favour of the bulls.
In this context:
→ Support could be provided by the $230 level as well as the median of the Regression Trend channel;
→ Key resistance could be found at the previous high of $242.23 and the psychological level of $250.
Whether AMZN can surge to a new all-time high will largely depend on the company’s performance in AI – a theme that remains highly relevant in 2025.
This article represents the opinion of the Companies operating under the FXOpen brand only. It is not to be construed as an offer, solicitation, or recommendation with respect to products and services provided by the Companies operating under the FXOpen brand, nor is it to be considered financial advice.
Amazon I Strong Bullish Outlook Welcome back! Let me know your thoughts in the comments!
** Amazon Analysis - Listen to video!
We recommend that you keep this pair on your watchlist and enter when the entry criteria of your strategy is met.
Please support this idea with a LIKE and COMMENT if you find it useful and Click "Follow" on our profile if you'd like these trade ideas delivered straight to your email in the future.
Thanks for your continued support!Welcome back! Let me know your thoughts in the comments!

AMAZONAMZN needs some more upside before a pullback.
Disclosure: We are part of Trade Nation's Influencer program and receive a monthly fee for using their TradingView charts in our analysis.

AMAZONAMZN is getting ready for another push towards 230 level.
Disclosure: We are part of Trade Nation's Influencer program and receive a monthly fee for using their TradingView charts in our analysis.

Amazon (AMZN) shares jump more than 7%Amazon (AMZN) shares jump more than 7%
As shown in the Amazon (AMZN) share chart, the price surged by over 7% yesterday, breaking above the key psychological level of $200 and closing at its highest point since early March.
The sharp rise in demand was driven by reports of a trade truce between the US and China following talks in Geneva. According to Reuters, the US has decided to lower the “de minimis” threshold on goods from China. This move could help de-escalate a potentially damaging trade war between the world’s two largest economies. For AMZN stock, this is a bullish signal, as Amazon sells a wide range of low-cost Chinese goods.
Technical analysis of Amazon (AMZN) shares
From a bearish perspective, the AMZN price has recovered to the 0.618 Fibonacci retracement level after falling from an all-time high to the early April low. In this context, selling pressure may re-emerge with the intention of resuming the downtrend—especially as most oscillators on the chart are signalling strong overbought conditions.
From a bullish perspective:
→ The pattern of higher highs and higher lows in late April and early May may have outlined the median of an ascending channel;
→ Yesterday’s price surge in AMZN shares may point to the channel’s upper boundary.
Given these conditions, it is reasonable to expect a minor pullback before the Amazon’s stock price resumes its upward trajectory within the blue channel.
This article represents the opinion of the Companies operating under the FXOpen brand only. It is not to be construed as an offer, solicitation, or recommendation with respect to products and services provided by the Companies operating under the FXOpen brand, nor is it to be considered financial advice.

Amazon I Technical & Tariff Analysis Welcome back! Let me know your thoughts in the comments!
** Amazon Analysis - Listen to video!
We recommend that you keep this pair on your watchlist and enter when the entry criteria of your strategy is met.
Please support this idea with a LIKE and COMMENT if you find it useful and Click "Follow" on our profile if you'd like these trade ideas delivered straight to your email in the future.
Thanks for your continued support!Welcome back! Let me know your thoughts in the comments!
