AMC CME Gap's + Price Target of 51.55-51.69When it comes to CME's, common talk is price will re-trace to the gap at one point in time ( Can be sooner or later ). On this chart you'll see the various CME's in AMC but the most significant ones relative to recent price action are 2 CME's
51.55 - 51.69 (#2) 14 Cent Gap
&
38.88 - 38.14 (#1) 74 Cent Gap (Empty box near MA's)
Market open Monday should retrace us to the previous gap mentioned as #1
These CME's are based on Daily t.f. Charts and a couple including the ones mentioned above were fine tuned on 1 hour for accuracy more importantly the 2 above are significant due tp their resistance at these points. This chart is only showing CME's and will continue to track them on a weekly basis here.
Food for thought on options traders,
The squeeze is more likely to happen if you buy the stock and hold rather than trading the option. Put or Call. Doesn't matter
We need a SOLID floor.
Happy Trading everyone and remember,
Scared money don't make no money!
AMC

AMC bull pennant still in playAll things considered, we didn't do to bad today. Next week will be crucial with how things play out with this new covid variant. But the good news is major support levels held and we closed within the pennant. If you see a defined break below these levels, I would be looking for an exit strategy. If it holds, well...hodl.

$AMC $450 THE SQUEEZE IS HERE AND ON THE HORIZON BEFORE JAN 2 If you paper hand you will live with the biggest pain and regret of your life.

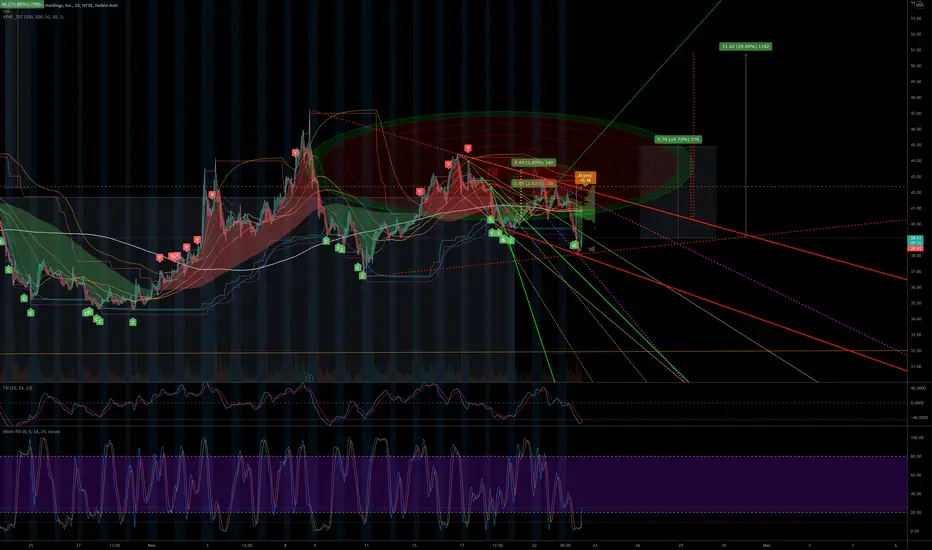
$AMC Algorythmic Scale In & Scale Out - Target $145 Feb 1, '22The pennant setup for the current session is identical in shape to the previous session where $AMC pumped from $20 to $77.
Additionally, the Fib-Trend lines up the price action very well.
Lastly, we have seen thousands of call options open on $AMC for the $145 strike in January 2022.
They are doing price discovery, we can see the most of the buying between $28-$45 with the majority throughout the Wyckoff Accumulation phase I posted about on 07/29, see link below.
From the beginning of this, I told everyone I knew to buy $AMC, they would ask "what do you think it's actually worth?" and I always thought that it was worth $30. Obviously things can change, with AA leadership I hope we see some new innovation on to of just doing what $AMC does best, but that is more of a fundamental discussion for later on. We could also see an economic collapse or margin call change how any of this plays out.

BFLY - SELL OFF BEFORE EARNINGS MONDAY FOR PROFITS? I SEE 10-12+All,
No bad news just a big dip here .. I think minimum we see a 10% move here to retest significant break. I personally believe this stock after ER will go $12+. Would not surprise me AT ALL if hedges etc are seling out here to re buy in down here to make some big profits come ER. Watch for big candles next few days.
see my last post very similar sell off.

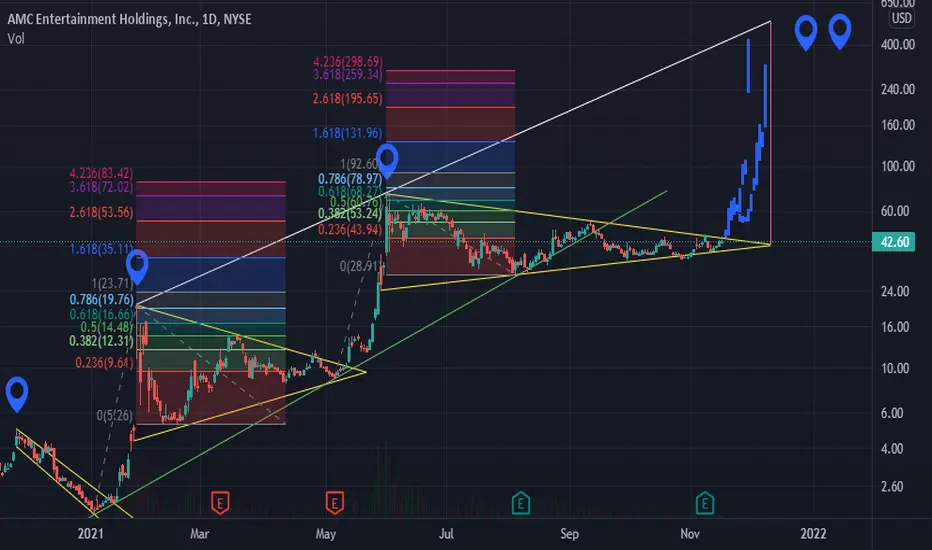
AMC ready to breakout. $AMC Ent HoldgAMC has the potential to hit $455 just on TA alone without a squeeze. Will the next pump trigger margin calls and go beyond $455? idk but AMC is looking like a perfect set up for any investor.

AMC to 40AMC is in a very large symmetric triangle right now. Saw it hit the bottom trendline this morning and I expect it to climb back to the top trend line which should be around the 40 mark.

two scenariostwo scenarios are possible. Which one works best? What do you think? Follow the price movement

Something's brewing with AMCLook at the recent levels of volume. It's the lowest its had in a long period of time. Especially today's volume. Keep in mind that short weeks and around the holidays volume drops with people traveling. I'm loading more in this area. Break out is still in play

VIX going to 16's next bearish wave startingVIX going to 16's next bearish wave starting.
The wave goes up and then back down, VIX reached a top for the up wave and starting to go back down. I expect all VIX related funds to go down next week and new ATH's for the market.
As always in the past VIX has been making new lows since covid started and I expect it to bottom low teens 10-13 which should paint an economical peak 2022-2023

AMC - price is correctingThe price is in a corrective area right now. It can retrace a bit more as marked on the chart.
2 Possibilities :
1. The correction can either be a triangle (in this case, we can see an upside soon).
2. The correction will unfold into a zig zag and we can see more downside, before the price will start to go up again.
In this chart, the second possibility is presented.
The Content is for informational purposes only. You should not construe any such information or other material as legal, tax, investment, financial, or other advice.
Have a beautiful day! :)

bounced ofThe price bounced off the resistance again, which means the bearish trend is strong. We expect a drop to support , and maybe even lower

Big moves are comingFrom a cyclical perspective, and with Heikin Ashi candle sticks, we can see better the cycle of AMC. It forms sort a huge cup and handle on the weekly chart, a reverse h&s in the 1h chart, a neutral RSI in short et midterm charts and a volume divergence where bears have less and less momentum creating higher lows. I don't thing there is going to be a final sell test, but i could see that we stay neutral for a day or 2, and have a strong move up after market maker clean up the options chain. With Fib levels i see this kind of move, plus with Elliott wave we look like we're finishing the a-b-c-d-e bearish pattern (like dave pointed in his video) in the longer term perspective and ready for a reversal very soon. Last thing, there is lots of Gamma in the options chain close to Jan 2022, so it could be triggered around this date. NFA, just my opinion on the stock I love haha! Cheers!


AMC is setting up real well. INVERSE h/S ALERT
we bounced off of macro wedge support and we might be looking for an inverse h.s pattern, this pattern was avaliable to see on the last rally, where we had an inverse h.s triggering the squeeze.
im not expecting an sos stage where we consolidate again at top or ar seen from wyckoff accumulation,
this move would be sufficient
NOT FINANCIAL ADVICE
FOLLOW ME FOR MORE

your 30% is hereafter $GME bull run now is the time for $AMC, now is looking for $50 with a symetric triangle pattern

where will the price break out of it?For a long time, the price has been forming a triangle. where will the price break out of it? What do you think?

WATCH AMC FOR THE END OF THE MONTHAMC is ready to erupt. If you look at the 2 last run ups it was at the end of the month.

AMC this week got be good. Hedgies f , k after SI publicationlesgo amc les go amc.
This week, or we shalt have a skueeze by next month on the 20th.
Likely this week we can have a small inverse h/s but as said. idek xD. it would be good as a trigger and the hf are def capable of doing so.
AMC AMC not financial advice.
this is just for my personal records and gauging how my progress on TA is going.
Feel free to follow and like as I will be uploading further analysis on the algorithms controlling this stock.
allegedly supposedly

$AMC to $200 by December 10th, 2021This is my first time doing technical analysis. The notes explain my thinking (read them from left to right).
I'd love to hear some feedback, whether you agree or disagree, and to hear your predictions as well. Thanks for your time!
*My bad if I didn't format this right, this is my first time posting here as well*
DOGE idk. about you guys. this is definitely my next playDoGE fractal.
NEXT leg up, 500% gains no less.
To the moon baby and beyond
NFA
Will deliver future analysis on this post amc squeeze, so follow me to stay updated.

Why AMC is going to 200$ than any other absurd price?Well, my thesis proposes the formation of a trend line on the primary supply for this reaccumulation cycle.
Thus, we can form a form of support which apparently coincides with the 0.5 fib retracement found on the previous rallies.
This imo is a very very very likely scenario.
I have added extra information within the graph itself for you viewers to look at.
God bless.
NFA
#AMC220
LFG
Like. and, Subscribe for future updates.
Follow my ig for some fun content + crypto and stocks updates
@callmeroshi_
