Will $AMD be affected by $AAPL missed earnings?Few gaps on the NASDAQ:AMD daily chart, with a hard rejection from the highs.. along with massive put premium on (3-17-23)expiration & (6-16-23)expiration. Call premium stands out at $90 strike (1-19-24)expiration, which could symbolize a retest of highs before a plunge.
NASDAQ:AAPL missed earnings but rallied anyway and there are rumors of a rug pull everyone is talking about.. if $aapl tanks can it affect the whole market?
Comment below let me know what you think..
Reasons
AMD High Rejection
AMD Gaps to the down side
AAPL missed earnings
Rug pull rumors
Call/Put Premium size differences and date choices.
AMD

AMD's Strength Fades Quickly, New Lows AheadPrimary Chart: AMD's Downtrend from All-Time Highs (2D Time Frame), Fibonacci Retracements and Projections, Long-Term VWAPs
AMD remains in a severe downtrend at the primary degree.
AMD's price on its most recent rally off the October 13, 2022, low rallied right into trendline resistance and rejected lower. On a linear chart (primary chart above), price pushed through the trendline briefly, setting up a bull trap for those thinking the trend structure might have changed. But price fell back below quickly, a sign of exhaustion and a reinforcement of the very trendline that caused the exhaustion and reversal lower.
Price also failed right at a key 50% retracement (green) of the August 3 to October 13 leg of decline.
AMD broke below a key long-term Fibonacci level (.618 R) at 63. And it fell below its anchored VWAP from 2022 lows.
Now price sits right at a critical multi-year VWAP anchored to 2018 lows (yellow). It looks likely to push below it in the coming days / weeks.
Target 1 lies at prior October 2022 lows (actually, slightly above those prior lows) at $55. This is the most conservative target and mostly likely to be achieved. Target 2.A is $48-$49. Target 2.B is 47.20. Target 3 is $45, shown on Supplementary Chart 1 immediately below. (Each target is a condition precedent to the next lower target. Unless and until a prior target is hit and held on a close, the lower targets are not in effect.)
Current Analysis
AMD remains in a severe downtrend as past analyses have discussed. The history of some key 2022 analyses by SquishTrade is reiterated below in the "Past Analyses" section below. This may help give context to the current analysis.
AMD rallied hard off the mid-October 2022 lows. This rally was mentioned when price was trading down into the mid-October 2022 low. See Supplementary Chart B below (discussing the likelihood of an extremely sharp bear bounce" from a multi-month support zone, and noting that the risk-reward at the time was poor for shorts. Price traded down into the key support zone of $54-$55, and then rallied powerfully into December 2022.
The highs, however, in the $79-$80 range failed right at trendline resistance. On a linear chart (Primary Chart above), price pushed through the down trendline briefly, setting up a bull trap for those thinking the trend structure might have changed. But price fell back below quickly, a sign of exhaustion and a reinforcement of the very trendline that caused the exhaustion and reversal lower.It appears the downtrend at the primary degree has resumed, and even if sharp rallies occur again, as is typical of bear markets, new lows will likely be reached in 2023.
In the process of declining after failing at resistance, AMD cut through a key Fibonacci level of $63. It also broke below a critical anchored VWAP from October 2022 lows.
Price targets are identified in the summary section above. But note that two alternative projections both result in a price target around the $47-$48 range. Both these projections rely on a "measured move" and Fibonacci approach (linear chart). Both these projections are .618 projections of prior major legs of decline. And they end up right near the very long-term VWAP from 2015 (dark blue) which is at $48-$49. Lastly, note that the log chart shown in Supplementary Chart 1 has a key measured-move, 1.00 Fib projection at $45.
Supplementary Chart 1
Past Analyses
AMD's severe downtrend has been discussed in several recent posts in 2022. In May 2022, SquishTrade applied technical analysis to conclude that AMD, which then traded at $94.24, would see more downside in price in the coming weeks and months. A downside projection of $60-$63 was discussed in May 2022, and that was later achieved when price hit $63.34 in September 2022. See the May 2022 post here .
Later, on October 6 2022, SquishTrade provided a more thorough discussion of the technical evidence supporting the continuation of the primary trend downward. See Supplementary Chart A below. Despite substantial rallies in tech stocks, including other chipmakers like NVDA, and large-cap tech stocks like AAPL, nothing has materially changed in the structure. In fact, even if more rallies lie ahead, AMD trend structure will take a lot of work to change.
Supplementary Chart A
When AMD reached a low in mid-October 2022, SquishTrade posted a warning that risk / reward for shorts was poor at the time. Supplementary Chart B. The post noted that AMD's price was near multi-month support and that "an extremely sharp bear bounce could occur at any time. Just look at the prior rallies . . . . Many of these bear rallies rise nearly vertically from the lower line of the channel (called the return line). This is typical of bear rallies. They tend to be some of the strongest rallies that happen in markets, and this bear market has been a fascinating learning experience (even if painful for longer-term investors) as these rallies and declines unfold."
Supplementary Chart B
But despite that major rally that was imminent, nothing had changed with regard to AMD's larger downtrend structure. That remains true now: AMD remains in a severe downtrend that has shown no evidence of structural change.
Another post in October 2022 noted the possibility of the $55 zone of support being significant was also discussed. See Supplementary Chart C. That post, however, was mainly to provide a brief snapshot of AMD's price "at the secular level of trend," which is a multi-year view (longer than a primary trend view which tends to be 9 months to 2 years). The October 30, 2022, post stated: "It's clear that in the intermediate term, bulls need to hold AMD's price above $54-$55 or else the next major level to the downside comes into play." But SquishTrade noted that the level may be retested in the coming weeks to months.
Supplementary Chart C
The time is likely approaching for a retest of that $54-$55 level. The current viewpoint will be discussed below along with reasonable price targets for 2023

AAPL: LAST MAN STANDING / FIB / PREDICTION / MASSIVE CHANNELDESCRIPTION: In the chart above I have provided a detailed MACRO analysis of AAPL laid out in its MASSIVE MONTHLY CHANNEL of 180 - 123.75 that has been held since DECEMBER 2020. Out of 8 massive US market movers AAPL was the only one to hold a positive position at market close on Feb 3.
IMPORTANT LIST OF US MARKET MOVERS: AAPLE, COSTCO, NVIDIA, FACEBOOK, ALIBABA, AMAZON, GOOGLE, AMD
POINTS:
1. Deviation of 6.25 DICTATES SUPPLY & DEMAND POCKET PLACEMENT.
2. Dotted orange vertical lines represent a months time.
3. EMA'S: 45 (BLUE), 100 (YELLOW), 200 (RED).
4. Green dotted vertical lines represent top for AAPL top.
5. Optimal Target: 161.25
6. Notice EMA movement where current placement would signify price action has plenty to give to the upside.
RSI: Common Range for RSI to linger between 50 - 70 despite somewhat overbought territory.
MACD: Notice current uptrend of buying to selling pressure and not the similar trajectory and angle. MACD has yet to ride trend before drop occurs which is highlighted by sphere.
SCENARIO #1: In a BULLISH scenario price action lingers around 155 SUPPORT and we see sideways action OR we see a sudden drop in the coming days but bounce 148.75 SUPPORT without losing upward momentum and confirming a continuation of upward momentum and confirming current setup.
SCENARIO #2: In a BEARISH scenario price action 148.75 & continues with strong downward momentum to 145 and beyond that break uptrend and invalidate setup.
FULL CHART LINK: www.tradingview.com
NASDAQ:AAPL

Nasdaq's fall in the market compared to S&P was strong in 2022Nasdaq's fall in the market compared to S&P was strong in 2022, so the elasticity of the rise will be strong on the contrary.
In addition, if the rise is raised to individual stocks at this point, there is a risk of timing, but if it is on the index ETF, the unit price is sufficiently stable at this point.

AMD Short What a pop on earnings (hurt my soxs position hahaha). However, looks like a great setup for a pullback, hitting 2 lines.

AMD -> The Breakout Happened As PredictedHello Traders,
welcome to this free and educational multi-timeframe technical analysis .
In my last video analysis of AMD, linked below, I explained all the reasons for which I do expect the market to provide further continuation towards the upside and actually breaking above the neckline of the very obvious weekly double bottom.
With todays price action, this is exactly what happened, we are seeing a massive breakout to the upside, which could definitely lead to a significant short covering rally.
I am now just waiting for a small retracement on AMD and bullish confirmation to enter a long to also participate in this very bullish momentum.
Thank you for watching and I will see you tomorrow!
You can also check out my previous analysis of this asset:

AMD CLear path to 95? $AMDNASDAQ:AMD
Taking a look at AMD on the weekly after a nice reaction to earnings
See a beautiful spring followed by a back test of the spring and now we are off to the races after breaking that supply line its been in for quite some time
doesnt look like this thing is going to slow down anytime soon
Looks like buyers are eager to get back into this name.
Cant be many bears left on this name at this point. Intel bad, AMD good? lol
what does everyone think?
Happy Trading

AMKR - Amkor Technology, Inc.Top of my focus list going into the upcoming week. Growth numbers are good, increasing number of funds buying shares, earnings still two weeks away.
On a technical basis, a surge in volume took prices thru some key highs and now we're seeing an orderly consolidation with good looking volume patterns.
Ideally, we get another volume surge that takes us thru last week's highs around 30.50.

AMD uptrend towards $80Possible a pull back on Monday Tuesday, then a uptrend jump with chip upbeat forecast

AMD JAN 20 57/ JAN 27 62 DIAGONAL PUTLOW BASE SET-UP:
AMD has been in a low base since about Dec 22nd and has been consolidating for more than 5 days with lower or equal volume. Overall market conditions are bearish, so downside is probable.
I was planning on using the Dec 28th candle as my entry point back then, but at that moment in time, it did not meet the 5 day consolidation requirement. So I waited a bit more. Turned out to be a small bear rally back to the 20 day on Jan 3rd. I'll be using today as my entry point.
No stops. I will be set up for max loss risking under 2% of my portfolio.
DIAGONAL SPREAD STRATEGY:
How strike prices and expiration dates are selected :
57 is my target point. From Oct 10th to about October 24th we traded in another low base set up (supply and demand zone) and my thesis is that we revisit that area within the next couple weeks or sooner. On the hour chart, I identified a tight downward channel which I used to determine my outlook. I originally was thinking we could visit 57 by Jan 13th, but Jan 20th is more than enough time.
Position management strategies when the stock goes lower :
If this falls lower than my 57 target and stays below 57 by the 20th, I'll close out the entire combo. The week of the 20th I'll watch this if this is below my 57 target to see if it'll run back up to hit the apex of the trade.
Position management strategies when the stock goes sideways :
If this goes sideways, I'll let my 57 strike expire and hold on to my 62 strike until the 27th. I'll be set up for max loss.
Position management strategies when the stock goes higher :
If this goes higher, I'll let it expire worthless and move on to the next trade
Position management strategy at expiration :
At expiration, if this is below my target or at my target I'll close out the entire combo. We we're still above my 57 target, I'll hold on to my 62 strike until the 27 and close it out.

AMD heading toward support areaFor those of you who are following along with me on my little obsession with AMD, the past week was pretty exciting for those who were shorting the stock as the price dropped out of that short-covering rally like a rock for a $9.46 gain.
AMD is now reaching a very uncertain area with 3 support levels to get through and it's actually touched an ascending trend line, so I'm expecting a few bounces to occur. My first short target is the middle of the support area at 59.80, but with hindsight, it should have been 63.62 which is the first support level below the 2-year line. The ultimate target is still 50. It's very possible AMD will make a double-bottom before it gets to 50 so I would look out for that. I'm still bearish at this point.
Disclaimer: I am not a financial advisor, and the above statements are not investment advice. My comments are only intended for educational purposes. You are solely responsible for your own trading decisions.

AMD: Key Reversals, and Short-Covering RalliesAMD has been in a bear market since December 1st, 2022. For those of you who took a short position, you have had to endure three major short-covering rallies. The first short-covering rally which began on December 12th may have made you reconsider your decision to short in the first place, and you probably got out at some point. But when is the best time to get out and possibly go long? Identifying key reversals can be helpful in these situations.
In a bear market, a key reversal is when the price makes a new low but closes on or near the high (the opposite is the case in a bull market). A bar chart can help you see this better. I've placed black arrows under the obvious key reversals on the daily chart. The orange arrow shows a key reversal that may not fit the definition exactly since the price closed just above the middle and not very close to the high.
These rallies only lasted a couple of days each, and since the key reversal can't be identified until the end of the first day, the opportunity to make gains with a long position only lasted one day.
An opportunity to go long has just presented itself on January 6th with a key reversal. I'm expecting a rally on January 9th. The question is, will this rally continue to the upper resistance line, or fizzle out in a day or two and retest the support it bounced off? I'll be watching.
Disclaimer: I am not a financial advisor, and the above statements are not investment advice. My comments are only intended for educational purposes. You are solely responsible for your own trading decisions.

Is AMD's recent rally coming to an end?Perhaps.
AMD has rallied for the past 8 trading sessions. The first session was on January 6 and ended with a key reversal (new low, closed near the high). Today, another key reversal has occurred (new high, closed on the low). This would indicate that AMD is likely to reverse direction and head lower. I'm going to say it will reach 64 by the end of January or sometime in February. I'm usually a bit too optimistic, so I'm giving myself some breathing room.
AMD tends to correlate with Invesco's QQQ ETF which is heavy in technology stocks, so I often check to see if QQQ is leading the way. As it turns out, QQQ had an even more prominent key reversal today. To me, this just confirms what I think is going to happen.
Of course, I could be wrong. Not all key reversals work the way you want them to (see the red dots in November).
We have just reached a 2-year-old support level that may now become a resistance level between 72.80 and 73.75 (the thick blue line and thin black line). I will be watching closely. If AMD doesn't respect the key reversal, it could break through that area and revisit it a few times like it did in November and December.
Disclaimer: I am not a financial advisor, and the above statements are not investment advice. My comments are only intended for educational purposes. You are solely responsible for your own trading decisions.

Intel gets some help from Uncle Sam?Chart shows AMD's market cap rising above Intel just when the bill is pass helping Intel...

NVIDIA and AMD Are Breaking Important Bullish LevelsAMD and Nvidia stocks are breaking higher this week, possibly ready for more gains as the recent corrective pullback to 140 and 60 USD appears completed. More upside here can be positive for cryptos about I talked in our webinar this Monday, here on tradingview.
Grega
I put link below if anyone is interested in recording.
www.tradingview.com

DXY ThoughtsHello Traders!
Do you see AMD?
December moving sideways.
January moving outside the sideways price action.
February may be a run to the high of the accumulation.

Chat GPT ai helps me with AMD vs INTC "Which one is the better buy for growth" was the question asked of me.
I used chat gpt to help. then I ran fundamental, technical, and some macro questions to try to decide.
summary: 2023 may be murky, but both will do well in 2024 and beyond.

Advanced Micro Devices Analysis 23.01.2023Hello Traders,
welcome to this free and educational analysis.
I am going to explain where I think this asset is going to go over the next few days and weeks and where I would look for trading opportunities.
If you have any questions or suggestions which asset I should analyse tomorrow, please leave a comment below.
I will personally reply to every single comment!
If you enjoyed this analysis, I would definitely appreciate it, if you smash that like button and maybe consider following my channel.
Thank you for watching and I will see you tomorrow!
You can also check out my previous analysis of this asset:

AMD First Day of a Breakout?AMD could be on a first day of a breakout. Finally broke out above daily cloud. Could hit 79. Also bb finally curling up.

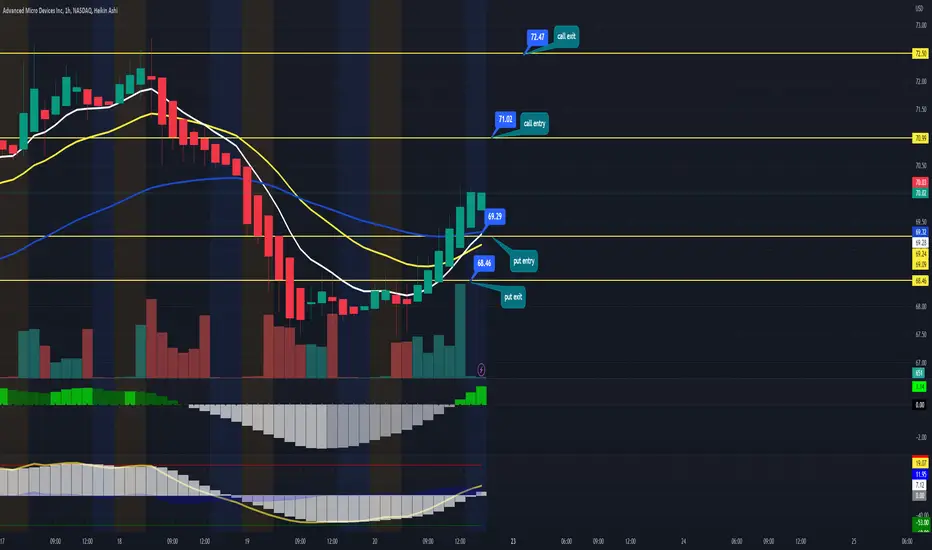
AMD continued momentum$AMD soar last week as market pivots due to inflation data from last week. AMD setup is looking bullish here as it entered the squeeze zone going up.
as you ca see in my chart. I marked some of the potential entry and exit if the stock extend its rally tomorrow. and also the potential entry for puts if
the stocks decides to pull back.
Make sure to set your alerts on those price target so you wont miss the move.
for more details AMD analysis. check out my streams.
Honorable mentions: GOOG AMZN QCOM NVDA DAL BA ( they all have almost similar setup)
=========================================================
Hi and welcome to this free technical analysis . ( mostly momentum play )
I am going to POST where i look for possibly entry and exit for intraday or scalp for trading.
I will try my best to make the idea short and simple as possible.
If you have any questions or suggestions on which stocks I should analyze, please leave a comment below.
If you enjoyed this analysis, I would appreciate it if you smashed that LIKE or BOOST button and maybe consider following my page.
Is AMD running out of gas ????AMD been on a run for a week now and it looking like it's topping oy on the 4hr chart with earning coming up AMD like to run down leading up to earning before it take off so lets see how this will play out over the next few weeks

AMD WEEKLYRULES:
-If price break Point 2, 4, 6, or 8 cancel the setup
-Price needs to break Point 1, 3, 5, or 7 to confirm the setup
When price reach the 100FE(BLUE BOX) it normally does a pullback/retest or reversal
The market can Truncate(fall short)

AMD double-top indicates a fall back to 50 by JanuaryAMD has been trading in a descending channel for the past year. A double-top has just formed near the upper resistance line. This would indicate that the price will go lower shortly. It's possible a triple-top could form before this happens. It's also possible that a cup and handle have formed and the price will break out from the channel. But based on the past pattern cadence and the angle of previous price drops, I expect AMD to hit 50 sometime near the end of December or the beginning of January. I'll be watching closely over the next couple of trading days to confirm.
