AMD - BEARISH - Technical Analysis My technical analysis for AMD and why I am Bearish on the stock
My thought process/indicators:
Price is re-testing the resistance zone of $90
AMD has been in a downtrend since NOV/2021
Price is rejecting the Parallel Channel
TMA-RSI indicator is showing overbought
My trading goal (R:S=2,5)
Wait for the price to break below the 89.44$ resistance zone
Wait for closing 4hr candle before shorting
STOP loss set up higher than the ATR of 5.20
Stop loss target : $92
Set Profit target: $74.50
As always, I am open to suggestions and comments, let me know what you think.
Cheers and happy trading!
AMD

AMD puts Hitting!!! In since $88 from previous post Waiting for the break of Support at $84 and down to $80 we go where I'll get calls. At the moment AMD $86 and $85 puts up 40% and 30%

AMD current target $80 SHORT AMD should reach $80 where I except a bounce up to $93 if we break below $85. Current play $86 puts for 7/29 selling once $80 target is reached. Once $80 is reached I'm buying $81 calls for 2 weeks out.
Current 15 min formation rising wedge waiting for a bounce off bottom trend line.

$AAPL $AMD $QQQ $SPY I OptionsSwing WatchlistAAPL I AAPL is up 20% from its recent bottom in June. It is forming a possible rising wedge pattern on the 4H time frame as it approaches earnings on 07/28.
AMD I We caught the bottom on AMD a couple of weeks ago, now it is time to be cautious as it approaches key resistance near $90-$95. Reports earnings on 08/02.
QQQ I We have a possible bear flag formation on QQQ 4H time frame. $300 is a key support level to hold, below that it can see $290. We have resistance near $310.
SPY I SPY had a hard rejection at the $400 psychological level. We also have a possible bear flag in formation. Support near $385 and $390. Resistance at $400.

Apple Double Topped?We may have seen Apple hit a double-top from May's high of $151, which we hit again today. With a week of earnings, including Apple's earnings on 28th, it could go anywhere. According to their guidance they expected a slowdown, lets see how this plays out for their price.
Per economic data, it fully supports a sell off but these big cap names is what is keeping the markets looking nice even though other stocks are down 90% like Carvana. The market doesn't really reflect the true state of the economy, because if it did, markets would be slashed in half.
Consumer sentiment, PPI, CPI, jobless claims are all worse than expected, but they like to act like we've hit bottom after a 14-year bull market rally.
MACD on the monthly is still very bearish. RSI has room to fall. But, lets see. Today, good news is good, bad news is good and in the face of $90 billion in buy-back from Apple, we can see Apple unrealistically going up.

AMD Short Target $80AMD is in a descending channel it previously bounced off it's lower support and is targeting $88-$90. For the short term I'm buying puts at the $84.50 region for $83 7/22 due to AMD being rejected at this point multiple times as shown by the red circles. I'm holding puts until the support region of $79-$80 is reached.

$AMD headed towards the top of the channel into earnings?AMD could get to the top of the channel around $98 before earnings, which is supposed to be on 8/2/2022. There're some gaps to be filled to the upside and the 50DMA could stay in the way. To me it looks interesting and worth to watch.

AMD and SMH leading the chip chargeThe entire sector is showing the same bullish wolfe wave pattern at the same time that it was reported that Pelosi added 11 million USD in shares of NVDA. There is a daily wolfe wave setup that triggered on July 5 closing day at 75.20. The projected target is calculated by extending a linear line between pivot 1 and 4 and projecting the line. This is represented as the green perforated line, as shown in the chart. The projected target is 118 which is expected to reach this price target before Sept 30 assuming NQ wolfe wave time forecast. Projected targets are defined by identifying the apex of the wolfe wave and projecting a vertical line toward the green perforated projection tgt which is extending from left to right. However, the wolfe wave daily setup for AMD does not have an apex associated with it so the projection of targets should be used with caution.

MU daily wolfe wave SMHThere is a daily wolfe wave setup that triggered on July 1 closing day at 53.65. The projected target is calculated by extending a linear line between pivot 1 and 4 and projecting the line. This is represented as the green perforated line, as shown in the chart. The projected target is 84.69 which is expected to reach this price target before Sept 22. Projected targets are defined by identifying the apex of the wolfe wave and projecting a vertical line toward the green perforated projection tgt which is extending from left to right. Using the customizable gap finder indicator there are sets of gaps along the way toward 84.69.

SHORT AMD!!!AMD has entered into our resistance zone of $79-$80 and is ready to be shorted. However if AMD closes above $80.50 I'll close my short position $79 and $78 puts for 7/22 :)
Key fact to remember is that AMD previously broke out of a broadening formation which it's lower support is acting as it's new resistance

AMD:Bear market rally or turnaround?Advanced Micro Devices
Short Term - We look to Buy at 76.98 (stop at 72.75)
The primary trend remains bearish. We are assessed to be in a corrective mode higher. The daily chart technicals suggests further upside before the downtrend returns. Trend line support is located at 76.00. Dip buying offers good risk/reward.
Our profit targets will be 90.00 and 95.00
Resistance: 90.00 / 110.00 / 125.00
Support: 76.00 / 60.00 / 40.00
Please be advised that the information presented on TradingView is provided to Vantage (‘Vantage Global Limited’, ‘we’) by a third-party provider (‘Signal Centre’) . Please be reminded that you are solely responsible for the trading decisions on your account. There is a very high degree of risk involved in trading. Any information and/or content is intended entirely for research, educational and informational purposes only and does not constitute investment or consultation advice or investment strategy. The information is not tailored to the investment needs of any specific person and therefore does not involve a consideration of any of the investment objectives, financial situation or needs of any viewer that may receive it. Kindly also note that past performance is not a reliable indicator of future results. Actual results may differ materially from those anticipated in forward-looking or past performance statements. We assume no liability as to the accuracy or completeness of any of the information and/or content provided herein and the Company cannot be held responsible for any omission, mistake nor for any loss or damage including without limitation to any loss of profit which may arise from reliance on any information supplied by Signal Centre.

$AMD down trend momentum$AMD has been trending down at a lower level ever since the market continues to pull back. Since then, $AMD picks ups a lot of short interest creating this downward move. The company's earnings have been amazing lately and continues its innovation for computer chips and probably expanding their reach to cloud computing and so on. a lot of big institutional traders seeing a buy, but the uncertain of the current market right now, preventing some traders to hold the stocks for long swing.
The average move of AMD per day is about $4.00-6.00 depending on market conditions and news.
here my price target for $AMD for monday 07/11/22.
============================================================
For calls; buy above $80.15 and sell at 82.14 or above
For puts, buy below 78.18 and sell at 77.40 or below
============================================================
Welcome to this free technical analysis . ( mostly momentum play )
I am going to explain where I think this stock might possibly go the next day or week play and where I would look for trading opportunities
for day trades or scalp play.
If you have any questions or suggestions on which stocks I should analyze, please leave a comment below.
If you enjoyed this analysis, I would appreciate it if you smashed that LIKE button and maybe consider following my channel.

AMD Downside RisksI believe the semiconductor will drop significantly when earnings are released or shortly therefore after. The market complexions remain in danger and the charts are nothing to sneeze at when it comes to market sentiment and various unknown characteristics to global risks. You can find more on the related idea that I've linked below, which also plays into this thesis. Current price is 76.11

EURJPY running at profits of 272 pips currentlyOANDA:EURJPY AMD Liquidity Concept
HTF Bias :
Price range broken below and then retracement above 50% of TR - Strong Bearish trend
Setup Patterns :
potential HTF's POI.
Imbalance/FVG @ 0.62 - 70.5 OTE level.
Buy Side Liquidity
taken out with Liquidity Void.
A-B-C Bearish Reversal
Setup & Entry Pattern (AMD Trading Plan) : SH + BMS + RTO firmly established
with RTO on FVG & Supply Zone/OTE Level

The semiconductors as market baromters!$AMD has been battered and bruised in 2022. The stock is down more than 60% from the highs of last year. Any meaningful bounce in the overall market needs to start from this sector. Watch $AMD and $NVDA as overall barometers of the market. $AMD in particular is quite oversold and may offer a bounce up to $80 if the market gets more constructive during this short trading week. Holding above Friday's low is the first requisite for the active bulls. A break and close below this area will make the overall tape a lot more bearish moving forward.

AMD looking for 50-55 Looking for an extended (C) wave here in (Y) if we see this volume gap break through which is likely imo.

$AMD $TSLA $QQQ $NFLX I OptionsSwing WatchlistAMD 1D I AMD is testing support near our trend. We have a bullish divergence on the RSI and earnings coming up. If $70 holds we can see a relief rally into earnings.
TSLA 1D I Attempting to make a higher low on the daily, but still looks bearish below $685. Support at $660 and $625. Resistance near $685 and $710!
QQQ 1D I QQQ is trying to make a higher low. Possible falling wedge pattern on QQQ. Expecting resistance near $290 and support near $265.
NFLX 1D I Netflix has been consolidating right above $160 for almost a month already. It reports earnings on 07/19 and we have a bullish divergence on the RSI!

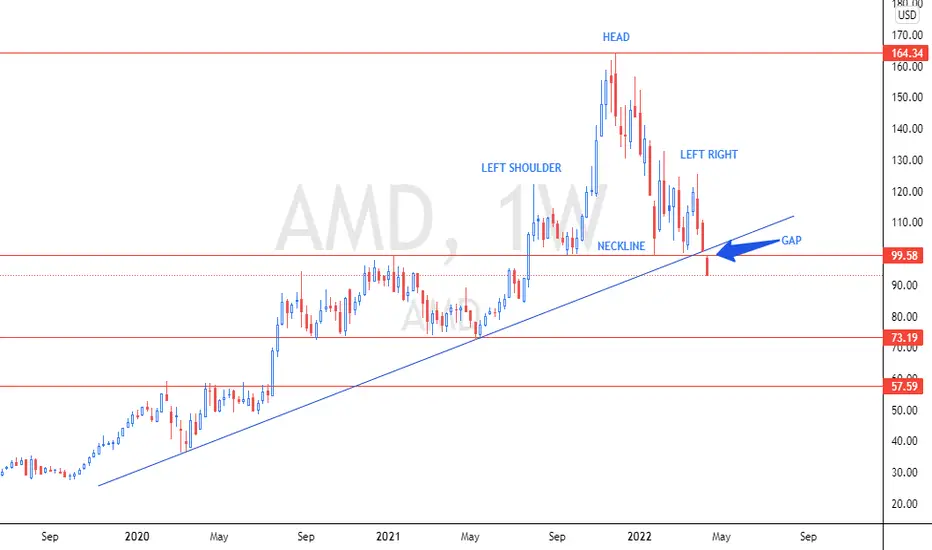
AMD HEAD & SHOULDER POISONED AMD Bears in action, Active Head & Shoulders + Gap + Broken multi-year ascending trendline. Next potential support level acts at $73.19
piling up bad news on semi conductor industryAMD is on a really important zone here. if this breaks, its going to be a disaster for it. we can see 59-60. most of the semi conductor names like AMAT, NVDA or just semi etf SMH are pretty close to 200 weekly moving range. we might see it next week.
MU reported ok numbers for this quarter but their guidance is awful.
• They slashed EPS by 40% and REV by 20% in guidance.
• Operating margins of this quarter are inline but they guided way lower operating margins for next quarter which shows the pressure on their raw materials
and inventory side.
• Operating cash flows for this and next quarter are also a miss but thats not surprising considering their margins going down.
• Also, CEO on call said the demand is weaker for semi’s right now which probably is why semi’s have been getting hit in the last week or so.
The biggest issue i see on MU’s ER is declining mobile sales. They have had y/y declining sales and this might spill over to big names like APPL, QCOM, QRVO and also ad spend companies like APPS, TTD.
If a new leg down starts in the market, chip manufacturers and mobile makers, ad spend and 5G network companies should be on watch.
Also, the demand weakening comment should put a lot of pressure on NVDA and AMD as there will be doubts about them being able to fulfill their guidance with weakening demand. Especially AMD guided way higher last quarter.
TSM put out news friday that majority of their big suppliers are scaling down their chip orders for rest of 2022. this consists of AMD NVDA AAPL cutting from 5-12% of their chips.
please note that this post is not for monday trading, it is intended in general for the next 3-4 months.

$AMD Advanced Micro Devices $AMD has been on a downward spiral printing bearish consolidation patterns after each drop.
The negative earnings report recently didn't help the stock price as you can see it has plummeted to a major support level.
It hasn't shown any signs of reversal yet. If it breaks below $72 it doesn't have much support until $59 area. YIKES!
As most tech stocks, AMD is overvalued in its current price.
The company has initiated a pullback on the consumer PC department (as sales have declined) and acquired a company this year to position growth in AI, apps and robotics.
AMD is well positioned and one of my top tech picks for bear market accumulation, as our world continues to develop in the digital age, AMD is a leader in memory and storage and is modeling change for future growth.
I believe AMD is a solid company that is positioned for new heights.
This is NOT Financial Advice.

AMD in danger at these levelsNASDAQ:AMD
AMD is looking at some substantial downside here.
no support plus some gap fills
its held this line once before but is it strong enough to do it again in this type of market condition ?

Elliott Wave View: Further Downside in AMD ExpectedShort term Elliott Wave view in AMD suggests the decline from 6/6/2022 high is unfolding as a 5 waves impulse Elliott Wave structure. Down from 6/6/2022 high, wave (1) ended at 79.43 and rally in wave (2) ended at 88.61. Internal subdivision of wave (2) unfolded as a zigzag Elliott Wave structure. Wave A of this zigzag ended at 86.38 as the chart below shows. Pullback in wave B ended at 80.23, and final leg wave C ended at 88.62 which also completed wave (2).
Wave (3) lower is in progress with subdivision as an impulse in lesser degree. Down from wave (2), wave ((i)) ended at 85.25 and rally in wave ((ii)) ended at 87.91. The stock extended lower in wave ((iii)) towards 75.48, and rally in wave ((iv)) ended at 78.50. Final leg lower wave ((v)) is expected to complete wave 1, and then the stock should rally in wave 2 to correct cycle from 6/27/2022 high before the decline resumes. As far as pivot at 88.62 high stays intact, expect rally to fail in 3, 7, or 11 swing for further downside. Potential target lower is 100% – 123.6% Fibonacci extension from 11/30/2021 high which comes at 53.5 – 68.7 area.

AMD - another massive downtrendAMD is in a heavy downtrend. It won't get there in a straight line, but I can see $74 as a super strong support and if we break through 64/65 is another strong support and a gap that could be filled. Trade with caution.
