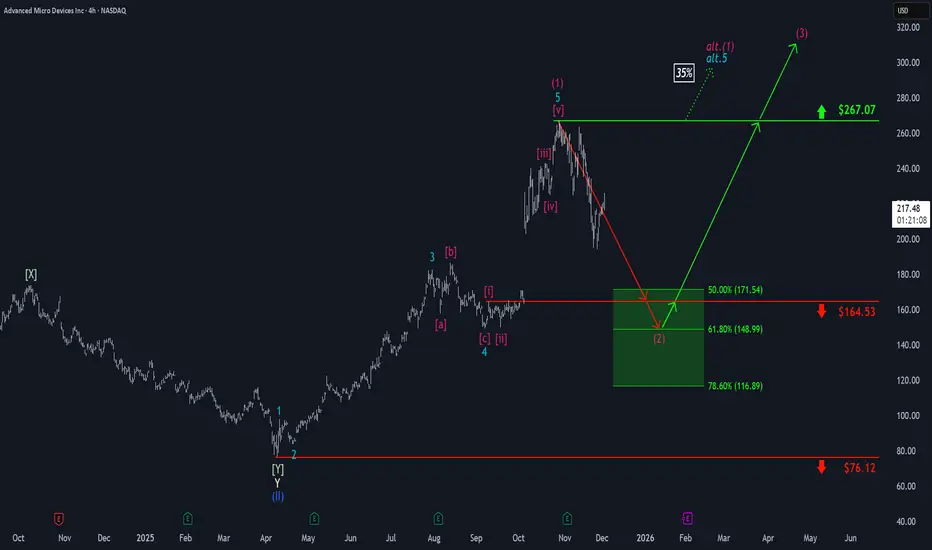
AMD: Short-Term Rebound Before Pullback?At AMD, a rebound has been taking shape recently. If this upward momentum continues in the near term and pushes price decisively above the $267.07 resistance level, we may have to expect a new high for the magenta wave alt.(1) (probability: 35%). However, our primary expectation is for the stock to soon turn lower and to move into our green Long Target Zone between $171.54 and $116.89. Following the low of the magenta wave (2) within this zone, the ongoing upward move should eventually break through the $267.07 resistance.
Amdanalysis
AMD Under Watch ⇌ Sellers Strengthening at Major Supply Zones🔥📉 AMD “ADVANCED MICRO DEVICES INC.” – Bearish Profit Playbook | Thief Layers Deployed 🚨
Hey traders! 😎🔍
Here’s my bearish swing/day-trade playbook on AMD, crafted with a fun + professional thief-style twist while staying within TradingView rules. Let’s break it down 👇💼
📉 Plan: Bearish Outlook Active
Price action remains heavy, momentum cooling off, and sellers showing presence near key zones.
Thief Squad preparing for controlled entries 😎🧤.
🎯 Entry Plan (Thief Layering Strategy)
This setup uses a layered limit-style approach — also known as multiple staggered entries to smooth positions.
📌 Proposed Sell-Limit Layers:
230
220
210
(You can extend layers based on your own system — thief flexibility ALWAYS 😎)
⚠️ Note: These are example layers for illustration, not fixed instructions. Adjust based on your own risk model.
🛑 Stop-Loss (Thief Safety Net)
SL Zone: 240
Dear Ladies & Gentlemen (Thief OG’s) 💼🕶️
This SL is simply my reference point — NOT a rule.
You decide your own SL based on your risk appetite, not mine.
Make money? Then take money… at your OWN risk 💰😄.
🎯 Target Zone
Price has a strong support cluster aligning with:
Moving Averaging acting as dynamic support
Oversold zone building
Trap mechanics likely
So the quick escape target is:
👉 TP: 180
Dear Ladies & Gentlemen (Thief OG’s) 💼😄
My TP is not mandatory — adjust yours as you wish.
Take your profits and leave before the “police” catches our position 🚓💨😆.
🔗 Related Pairs to Watch (Correlation Insights)
These assets often move with similar sentiment due to tech-sector correlation, semiconductor supply chain, and risk-on/off flows:
💻 NVDA (NVIDIA)
Strong semiconductor leader — AMD often shadows NVDA’s volatility and sector direction.
📱 QQQ (NASDAQ 100 ETF)
AMD is inside the NASDAQ index. When QQQ sells off, AMD typically follows the broader tech flow.
🌐 SMH (Semiconductor ETF)
Tracks the entire chip sector. Helps understand overall industry strength or weakness.
⚡ TSLA (Tesla)
Not directly connected, but both ride similar high-beta risk cycles. Weak tech sentiment can drag TSLA and AMD simultaneously.
Watching these helps confirm momentum, risk appetite, and sector-wide signals 📊🔍.
🧠 Additional Notes
This setup is for educational, fun, strategy-style illustration purposes.
NOT forcing a fixed entry, SL, or TP on anyone.
Trade smart. Manage risk. Thief style = creativity + discipline ✨😎
✨ “If you find value in my analysis, a 👍 and 🚀 boost is much appreciated — it helps me share more setups with the community!”

AMD: Wave [iv] Low AMD shares have recently gained upward momentum as anticipated, confirming the low of wave in magenta. In light of this, we have added a new resistance level at $223.50 to the chart. The primary outlook is for the stock to continue completing the magenta five-wave sequence to the upside, thereby finishing the larger magenta wave (1). Afterward, wave (2) is expected to pull price back toward support at $164.53. Alternatively, AMD could see a direct sell-off, which would bring the alternative wave alt.(2) to an early conclusion. In this scenario, wave alt.(1) would already be complete, with a probability of 27%.

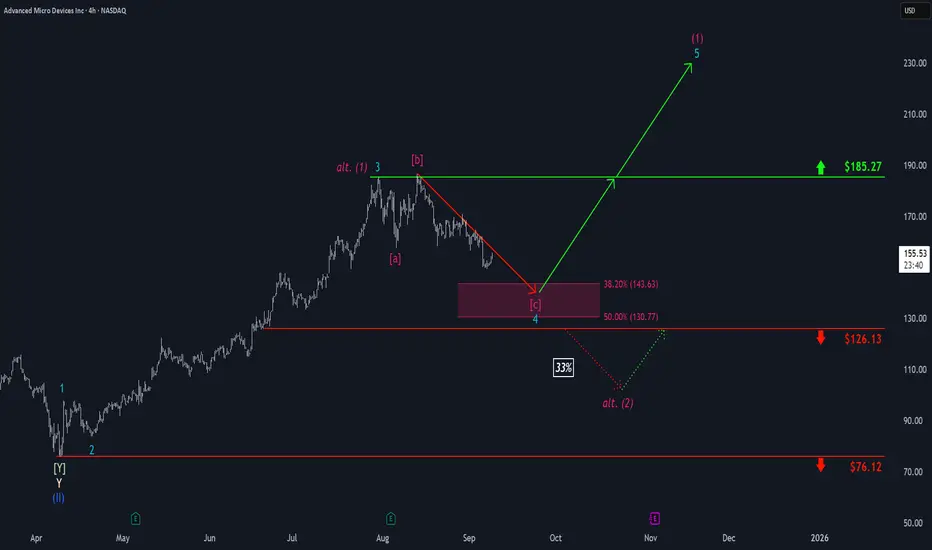
AMD: Drawing Closer...Step by step, AMD has been drawing closer to our magenta Target Zone between $143.63 and $130.77, which remains a favorable range for long entries. Prices should establish the low of turquoise wave 4 within this zone before reversing higher to resume the ongoing upward impulse—initially breaking above resistance at $185.27 and targeting the peak of magenta wave (1). However, we see a 33% chance that magenta wave alt. (1) has already completed, with a quicker low for wave alt. (2) likely to form below support at $126.13. Due to this alternative scenario, potential long trades within the magenta zone could be protected with a stop either 1% below the lower boundary of the zone or at the $126.13 level.
AMD $160C – Tactical Bounce Trade You Don’t Want to Miss
# ⚡ AMD Weekly Mean-Reversion Setup (Sept 7, 2025)
### 🔍 Market Snapshot
* **Price:** \~\$151.14
* **Technicals:** Daily RSI 28.4 → Deeply oversold 📉 | Weekly RSI 54.1, falling
* **Options Flow:** Strongly bullish (C/P = 2.13) ⚡
* **Volatility:** Low (VIX \~15), gamma low → cheap premium
* **Timeframe:** 5-day weekly expiry
---
### 🎯 Trade Idea: Tactical Bounce Play
* **Instrument:** AMD
* **Direction:** CALL (Mean-reversion)
* **Strike:** \$160
* **Expiry:** 2025-09-12
* **Entry:** \$0.77 (mid/ask)
* **Profit Target:** \$1.54 (+100%)
* **Stop Loss:** \$0.31 (-40%)
* **Size:** 1 contract (small % account, scale per risk rules)
* **Confidence:** 65%
---
### ⚠️ Key Risks
* Prior week -10% drop & heavy distribution → counter-trend risk
* Full payoff requires \~\$9 move in 5 days → moderate probability
* Concentrated \$150 puts can act as support or accelerate downside
* Weekly theta decay → exit by Thursday, avoid Friday gamma ⚡
* News/macro shock risk → use small sizing
---
### 🔑 Trade Rationale
1. Daily RSI extreme → plausible 3–5 day bounce
2. High call flow @ \$160 → short gamma/short-term buying interest
3. Low VIX → cheap premium relative to potential move
---
### ⚙️ Execution Notes
* Enter at open, limit \$0.77
* Stop at \$0.31, take partial profit at +50% (\$1.16), full at +100% (\$1.54)
* Cut if price drops below \$148–\$149 on heavy volume
---
📊 **Summary:** Tactical, defined-risk mean-reversion play. Not a trend reversal — small allocation, event-driven weekly call.
\#AMD #OptionsTrading #WeeklySetups #TradingView #MeanReversion

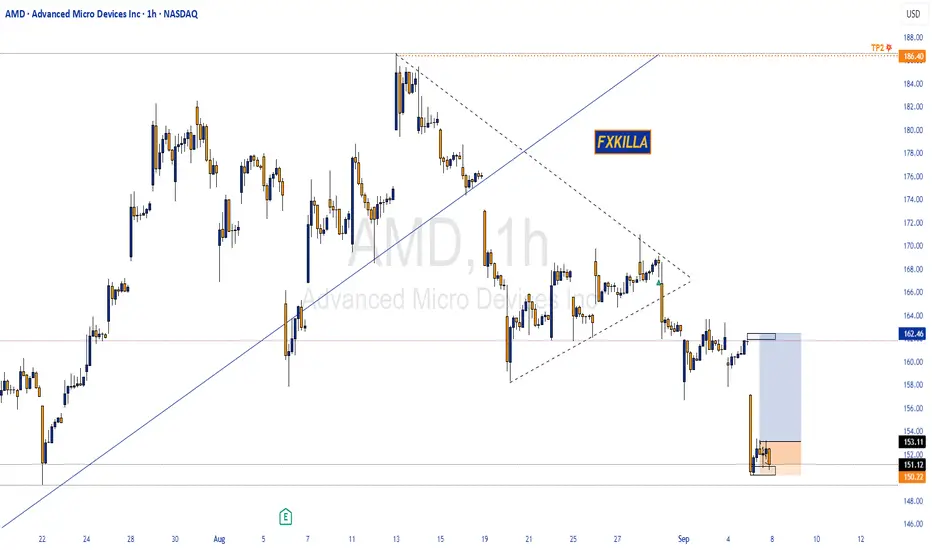
AMD HIGH PROBABILTY SETUP SOON !!!🚨 AMD HIGH PROBABILITY BUY SETUP 🚨
* Here We Can See Clearly The Next Potential Move For AMD Coming Hours/Days.
* Keep Your Eyes Close On Your Trading Positions.
* Happy PIP Hunting Traders.
FXKILLA
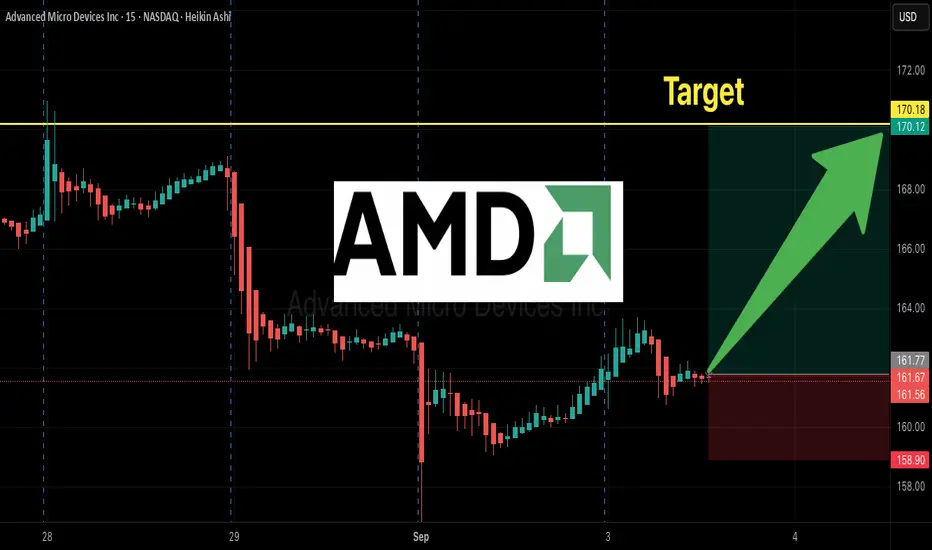
AMD Weekly Call Play – $170 Strike Ready to Explode?
## 🔥🚀 AMD Weekly Options Setup (Sep 3, 2025) 🚀🔥
💎 **High-Risk, High-Reward Call Play!** 💎
### 📊 Market Consensus
* 📈 **Bias:** Moderately Bullish (short-term upside skew).
* 🏦 **Flow:** Institutional heavy call buying (C/P = **2.19**) at \$170 strike.
* 📊 **RSI:** Weekly strong (70.8), Daily weak (43.2) → divergence ⚠️.
* ⏰ **Risk:** Only 2 DTE → Gamma & Theta decay **very high**.
---
### 🎯 Trade Setup
* 🏦 **Instrument:** AMD Weekly Call (Exp 09/05)
* 🚀 **Strike:** \$170
* 💵 **Entry:** \$0.59
* 🛑 **Stop Loss:** \$0.30 (≈50%)
* 🎯 **Target:** \$1.18 (+100%)
* 📅 **Exit Rule:** Close **by Thursday EOD** (don’t hold into Friday gamma).
* 📏 **Size:** 1 contract (keep it small)
* 📈 **Confidence:** 65%
---
### ⚠️ Key Risks
* ⏳ Time decay → Premium can evaporate fast.
* 📉 Weak daily momentum → Possible pullback.
* 🕒 Slippage & spreads → Use **limit orders**.
---
## 📌 Tags (TradingView + SEO Boost)
\#AMD #OptionsTrading #WeeklyOptions #CallOptions #SwingTrade #Breakout #TechStocks #RiskReward #StockMarket #TradingSetup #GammaRisk #ThetaDecay #MomentumTrading
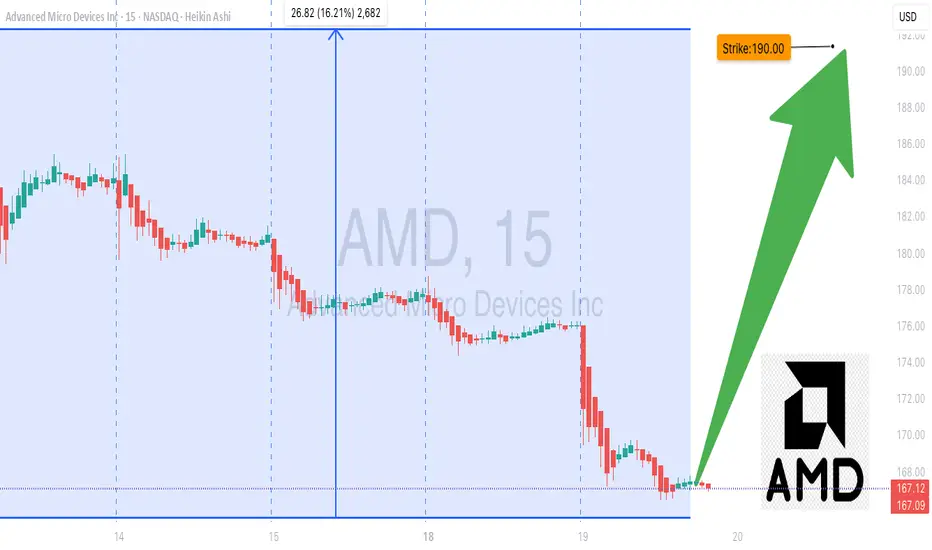
AMD Options Alert: $190 Call Ready to Pop!
# 🚀 AMD Weekly Options Analysis (Aug 19, 2025) 🚀
### **Market Snapshot**
📊 **Daily RSI:** 56.3 ⬇️ (Neutral)
📈 **Weekly RSI:** 85.1 ⬇️ (Potential Reversal ⚠️)
📉 **Volume:** Weak institutional activity (0.6x last week)
🔥 **Options Flow:** Call/Put ratio 1.21 → Moderate Bullish
✅ **Volatility:** Favorable (VIX < 15)
💡 **Overall Bias:** Moderate Weekly Bullish
---
### **Model Breakdown**
| Report | Trend | Volume | Options Flow | Bias |
| -------------------- | ------------------ | ------- | ------------ | ------------------- |
| **Grok/xAI** | NEUTRAL | WEAK 📉 | BULLISH 🔥 | Moderate Bullish 👍 |
| **Gemini/Google** | NEUTRAL/Bearish ⚠️ | WEAK 📉 | BULLISH 🔥 | Neutral/Bearish 🤔 |
| **Claude/Anthropic** | NEUTRAL/Bearish ⚠️ | WEAK 📉 | BULLISH 🔥 | Moderate Bearish 👎 |
| **Llama/Meta** | NEUTRAL ⚠️ | WEAK 📉 | BULLISH 🔥 | Moderate Bullish 👍 |
| **DeepSeek** | NEUTRAL ⚠️ | WEAK 📉 | BULLISH 🔥 | NEUTRAL 🤷 |
✅ **Consensus:**
* Weak volume = concern 🚨
* Low VIX = favorable for options 💎
* RSI signals mixed; overbought caution ⚠️
---
### **💥 Trade Recommendation 💥**
**Strategy:** Cautious Naked Call
* 🎯 **Instrument:** AMD
* 💰 **Strike:** \$190
* 🗓️ **Expiry:** Aug 22, 2025
* 💵 **Entry Price:** \$0.70
* 🎯 **Profit Target:** \$1.05 (50%)
* 🛑 **Stop Loss:** \$0.35
* ⏰ **Entry Timing:** Market Open
* 📈 **Confidence:** 65%
⚠️ **Key Risks:**
* ⏳ Accelerated time decay (3-day expiry)
* 📉 Weak volume may trigger profit-taking
---
### **Trade JSON**
```json
{
"instrument": "AMD",
"direction": "call",
"strike": 190.00,
"expiry": "2025-08-22",
"confidence": 0.65,
"profit_target": 1.05,
"stop_loss": 0.35,
"size": 1,
"entry_price": 0.70,
"entry_timing": "open",
"signal_publish_time": "2025-08-19 09:51:08 UTC-04:00"
}
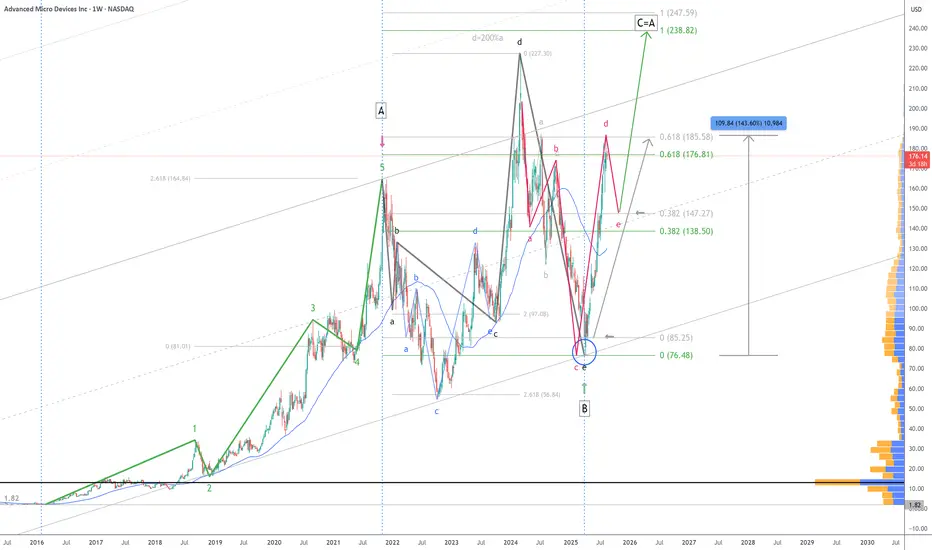
$AMD Analysis: Perfect Hit & One of Many Scenarios! 8/18/2025NASDAQ:AMD hits the 61.8% target of major wave A - up nearly 144% gain in 3 months! 👌
📈 A pause near $148 could complete the red NT (abcde) structure before a potential continuation toward C=A target at $236 or $247
One of many paths... let’s see how it unfolds!
Cheers!
#ElliottWave #AMD #TechnicalAnalysis
AMD Ready to Break Higher – $190 Calls Flashing Opportunity!
# 🚀 AMD Weekly Options Analysis (2025-08-17) – Don’t Miss Out!
### 🔎 Market Overview
AMD’s weekly options landscape shows **strong bullish sentiment**: high call volume and supportive sentiment suggest traders expect upward movement, though some caution arises from declining short-term indicators.
---
### 📊 Key Model Insights
* **Call/Put Ratio:** 2.03 → strong bullish flow
* **Weekly RSI:** 87.8 → extremely bullish momentum
* **Daily RSI:** 59.1 → short-term downward trend, caution advised
* **Volume:** 0.8x last week → declining institutional participation
* **Gamma Risk:** Low → favorable for entering near-term options
---
### 📌 Agreement & Disagreement
* **Agreement:** All models confirm **moderate-to-strong bullish sentiment** due to options flow and low VIX environment.
* **Disagreement:** Some models flag **weak volume**, raising caution, while others remain confident in ongoing bullish trends.
---
### 📊 Recommended Trade
* **Direction:** CALL (Long)
* **Strike:** \$190.00
* **Expiry:** 2025-08-22
* **Entry Price:** \$0.70 (midpoint)
* **Stop Loss:** \$0.35 (50% of premium)
* **Profit Target:** \$1.40 (100% gain)
* **Entry Timing:** Market Open
* **Confidence:** 65%
---
### ⚠️ Key Risks
* Weak volume → reduced institutional conviction
* Declining daily RSI → potential short-term reversals
* Monitor news/events → can affect volatility or price
---
📊 **TRADE DETAILS JSON**
```json
{
"instrument": "AMD",
"direction": "call",
"strike": 190.00,
"expiry": "2025-08-22",
"confidence": 0.65,
"profit_target": 1.40,
"stop_loss": 0.35,
"size": 1,
"entry_price": 0.70,
"entry_timing": "open",
"signal_publish_time": "2025-08-17 09:30:00 EDT"
}
``

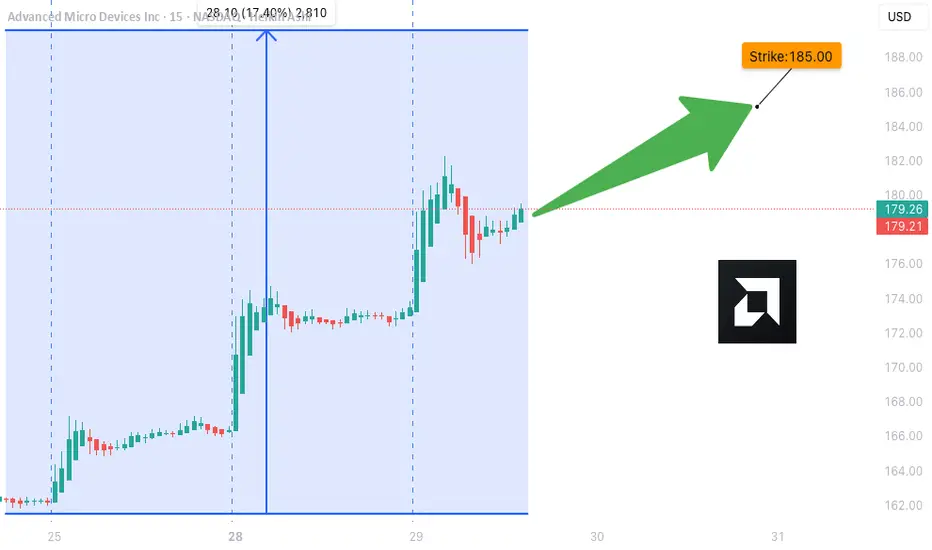
AMD One-Day Call Opportunity – Quick Gains Ahead!🚀 AMD \$185 Call – One-Day Bullish Sprint
**Sentiment:** 🟢 *Strong Short-Term Bullish*
* **Daily RSI:** 64.2 📈
* **Weekly RSI:** 88.4 📈
* **Call/Put Volume:** Favoring calls strongly
* **Volume:** Weak (0.8× last week) → watch for support
* **Gamma Risk:** HIGH ⚡ — 1-day expiry
---
### 📊 **Consensus Snapshot**
✅ Majority of models: bullish momentum
⚠️ Weak volume + high gamma → strict risk management required
💡 Entry timing and discipline are critical
---
### 🎯 **Trade Setup**
* **Type:** CALL (Single-leg)
* **Strike:** \$185.00
* **Expiry:** 2025-08-15
* **Entry:** \$2.61 (mid-market)
* **Profit Target:** \$3.90 (+50%)
* **Stop Loss:** \$1.30 (–50%)
* **Confidence:** 70%
* **Trade Size:** 1 contract
* **Entry Timing:** Market open
---
💬 *High-momentum, short-term expiry play — monitor volume and be ready to exit quickly.*
📌 *Not financial advice. DYOR.*
---
**#AMD #OptionsTrading #CallOptions #DayTrading #StocksToWatch #GammaRisk #OptionsFlow #TradingSignals**

AMD Calls Flying Off the Shelves — Don’t Miss Out!🚀 AMD Weekly Options Alert (Aug 12, 2025)**
**Bias:** 🔥 **BULLISH** — Strong flow, high RSI, institutional backing
📊 **Quick Stats:**
* **Call/Put Ratio:** 2.31 → heavy call buying 📈
* **Daily RSI:** 60.4 ✅ bullish momentum
* **Weekly RSI:** 87.1 🚀 extreme strength
* **Volume:** 1.1× last week — institutional participation confirmed
* **VIX:** 15.0 → low volatility, stable premiums
* **DTE:** 3 | **Gamma Risk:** Moderate | **Time Decay:** Accelerating
💡 **Trade Setup:**
* **Type:** Naked CALL
* **Strike:** \$182.50
* **Expiry:** Aug 15, 2025
* **Entry:** \$0.69
* **PT:** \$1.38 (+100%)
* **SL:** \$0.34
* **Confidence:** 80%
⚠ **Risks:**
* 3 DTE = fast-moving gamma swings
* Semiconductor sector news could shift momentum
* RSI high — watch for intraday pullbacks
---
**📈 TL;DR:**
High RSI + bullish flow + strong volume = momentum play. Manage gamma risk, aim for quick profit.
\#AMD #OptionsTrading #CallOptions #WeeklyOptions #BullishBreakout #OptionsFlow #TradingSetup #TechnicalAnalysis #MomentumTrading #StockMarket #OptionsAlert

AMD Gamma Squeeze Potential?### 🚀 AMD Bulls or Trap? | \$175C Trade Setup Before Expiry!
**⚠️ High Gamma, Mixed Sentiment – Time-Sensitive Play**
📉 **Weekly RSI**: 70.4 (falling)
📈 **C/P Ratio**: 2.07 (bullish bias)
🔁 **Volume**: 1.2x weekly avg
📊 **Model Sentiment**:
* **Grok/xAI**: Bullish (Call accumulation 📈)
* **Claude/DeepSeek**: Bearish (Institutional selling 🚨)
* **Gemini**: Cautious Bearish
* **Llama**: Neutral / Wait & See
📌 **Suggested Trade**
🔵 **Call**: AMD \$175C (Aug 8 Exp.)
🎯 **Entry**: \$0.66
🛑 **Stop**: \$0.33
💰 **Target**: \$1.25
📆 **DTE**: 1
🔥 **Gamma Risk**: High – requires fast execution
🧠 **Confidence**: 65%
🧠 Watch for sharp moves. Mixed model sentiment = **great volatility** = **great opportunity** (with tight risk mgmt).
💬 *Would you take this trade?*
👇 Drop your thoughts in the comments!

AMD Shares Decline Despite Strong Earnings ReportAMD Shares Decline Despite Strong Earnings Report
Yesterday, following the close of the stock market, Advanced Micro Devices released a strong quarterly earnings report:
→ Earnings per share came in at $0.48 (roughly in line with forecasts);
→ Revenue reached $7.68 billion (versus expectations of $7.41 billion).
At the same time, CEO Lisa Su stated: “We’re well positioned to deliver significant growth in the second half.”
However, despite the solid performance and optimistic outlook, AMD shares declined in after-hours trading, falling below $165.
The decline in AMD’s share price following a strong report may be attributed to excessively high expectations and the stock's overbought condition ahead of the announcement.
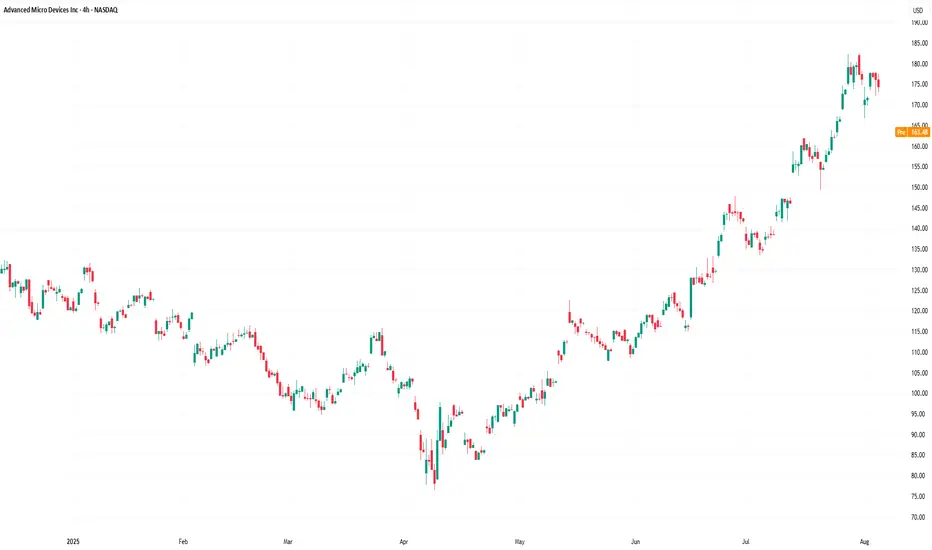
Technical Analysis of the AMD Stock Chart
Since April 2025, price fluctuations have formed an ascending channel (highlighted in blue). In July:
→ the price broke above the upper boundary of this channel, moving sharply higher (marked in purple);
→ the RSI indicator remained above the 50 level throughout.
We can assume that investors were following the meteoric rise of Nvidia (NVDA) shares and were betting that the ongoing AI boom would enable AMD to deliver extraordinary results. However, these hopes were not fully realised — the classic case of "buy the rumour, sell the fact".
As a result, AMD shares may open today with a bearish gap. From a technical standpoint, this suggests that the price is returning to the limits of the blue ascending channel, where the midline and lower boundary may act as support levels. The psychological support level at $150 also appears significant.
This move may be interpreted as a correction — and once the excessive optimism accumulated in July dissipates, bulls may attempt to resume the upward trend, supported by fundamentally strong data.
This article represents the opinion of the Companies operating under the FXOpen brand only. It is not to be construed as an offer, solicitation, or recommendation with respect to products and services provided by the Companies operating under the FXOpen brand, nor is it to be considered financial advice.
AMD Don't Miss Out
### 🚀 \ NASDAQ:AMD Bullish Reversal Play — Weekly Options Setup
**🔥 Institutional Flow + RSI Momentum + Volume Surge = Opportunity**
---
📊 **Model Consensus Summary (Grok, Claude, Gemini, Llama, DeepSeek):**
* **🟢 Weekly RSI:** Climbing ⬆️ — confirms trend
* **🔴 Daily RSI:** Slight dip = caution, but **volume overrides**
* **💰 Call/Put Ratio:** 2.00 → **Big Money** loading calls
* **📈 Volume Spike:** 1.7x last week → institutional confirmation
* **🧠 AI Sector Tailwind:** Adds strong narrative fuel
---
### 🎯 Trade Setup – 5D Weekly CALL
| 🧾 Entry | 🎯 Target | 🛑 Stop Loss | 🎲 Risk/Reward | 📅 Expiry |
| -------- | --------------------------- | ------------ | --------------- | ---------- |
| \$4.40 | \$6.75 (TP1) / \$9.00 (TP2) | \$2.60 | 1:1.78 / 1:3.46 | 2025-08-08 |
**📌 Strike:** \$180.00
**🎯 Strategy:** Naked CALL (single-leg)
**⏰ Entry:** Market open
**✅ Confidence:** 75%
**⚠️ Risk Flag:** Short-term volatility from daily RSI dip
**🔍 SL based on 40% drawdown tolerance**
---
### 📣 TL;DR
> **“Smart money is early. Momentum is building. AMD could break out hard.”**
> 🔸 Weekly RSI + Volume + Calls = Setup
> 🔸 Short-dated play for aggressive profits
> 🔸 Tight stop, wide upside
---
### 💡 Tag It:
\#AMD #OptionsTrading #WeeklySetup #TradingSignals #AIStocks #InstitutionalFlow #RSI #CallOptions #MomentumPlay #TradingView #SwingTrade

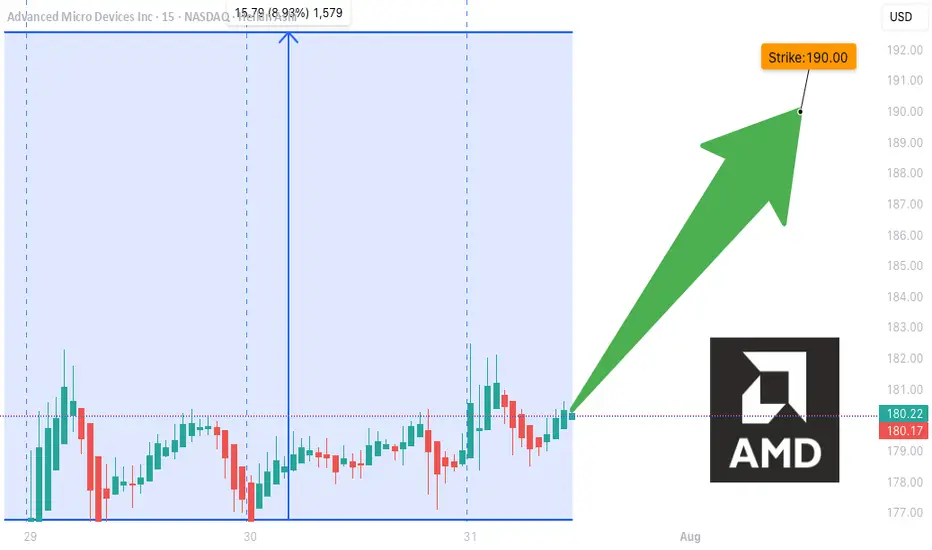
AMD WEEKLY TRADE SIGNAL (7/31/25)
### 🚀 AMD WEEKLY TRADE SIGNAL (7/31/25)
📈 **MARKET SNAPSHOT**
🟢 Daily RSI: **86.0** 🔥
🟢 Weekly RSI: **80.4**
📊 Volume: 🔺 1.5x (Institutional surge)
💬 Call/Put Ratio: **1.90**
🌪 Gamma Risk: **HIGH (1DTE)**
🧠 Sentiment: **Extremely Bullish** across all models
---
💥 **TRADE IDEA**
📍 Ticker: **\ NASDAQ:AMD **
📈 Direction: **CALL (LONG)**
🎯 Strike: **\$190.00**
💵 Entry: **\$0.51**
🎯 Target: **\$0.90** (+75%)
🛑 Stop Loss: **\$0.30**
📆 Expiry: **Aug 1 (Friday)**
📊 Confidence: **85%**
⏰ Entry: Market Open (Time-sensitive!)
---
🧠 **STRATEGY CONTEXT**
✅ Bullish momentum from AI sector hype
✅ Institutional call buying volume spiking
⚠️ 1DTE = High Gamma Risk = TRADE FAST OR DON’T TRADE
⚠️ Manage decay & exit early if momentum stalls
---
📌 Signal Posted: 2025-07-31 @ 12:17 PM ET
\#AMD #OptionsAlert #AITrade #WeeklyOptions #TradingViewViral #1DTE #GammaSqueeze
AMD Weekly Trade Alert (2025-07-29)
**🔥 AMD Weekly Trade Alert (2025-07-29) 🔥**
💹 *Momentum Confirmed. Calls Loaded. Let’s Ride.*
📈 **Key Bullish Signals**
✔️ Daily RSI: **83.2** (Rising)
✔️ Weekly RSI: **79.9** (Rising)
✔️ Call/Put Ratio: **2.03** 🧨
✔️ Volatility: Low (VIX = 15.2)
⚠️ Volume Weak (0.9x) – But not a dealbreaker.
---
**🎯 TRADE SETUP**
🔹 **Ticker**: \ NASDAQ:AMD
🔹 **Strategy**: Weekly Naked Call
🔹 **Strike**: \$185C
🔹 **Entry**: \$0.66
🔹 **Profit Target**: \$1.32 (100%)
🔹 **Stop Loss**: \$0.33
🔹 **Expiry**: 2025-08-01
🔹 **Size**: 3 Contracts
🔹 **Confidence**: 75%
---
**🧠 WHY THIS WORKS**
🔋 Momentum → STRONG
💰 Institutions are loading up calls
🧘 VIX = calm
⚡ Short gamma risk = fast payoff or cut
---
📢 **Watchlist it. Trade it. Exit fast.**
💬 Comment “🔥AMD” if you’re in.
🔁 Repost if you see \$190 coming.
\#AMD #OptionsTrading #CallOptions #TradingView #WeeklySetup #MomentumPlay #BullishSignal #MarketMomentum
AMD in cross section of 2 important levelsAMD is at the crosssection of 2 important
trend lines
1. from Jun22 lows to sep23 lows and Aug 24 lows,
breaking down in Dec24.
2. The channel from Mar24.
I hope the price comes down to 133 levels.

AMD Clears Resistance, Eyes $147.8 on Bullish ReboundAMD broke above $139.8, making the primary trend bullish. A pullback to this level can provide a discount to join the bull market, with a target at $147.8.

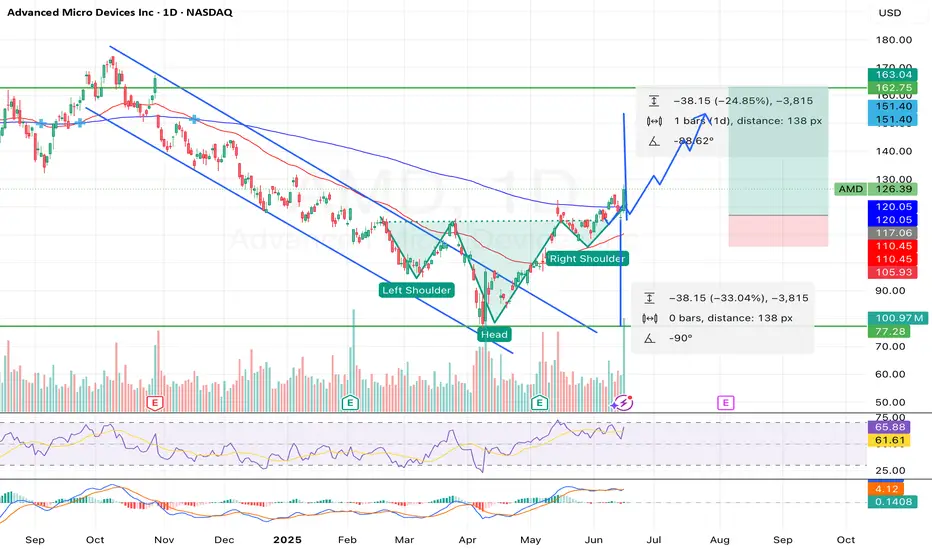
Breakout Alert: AMD Head & Shoulders Points to $160+Overview
Name: Advanced Micro Devices, Inc.
Ticker Symbol: AMD
Exchange: NASDAQ
Founded: 1969
Headquarters: Santa Clara, California, USA
CEO: Lisa Su (as of 2025)Sector: Technology / Semiconductors
About
AMD is a leading semiconductor company known for its high-performance computing and graphics solutions. It competes with Intel and NVIDIA in the CPU, GPU, and data center markets. Its product line includes Ryzen (desktop/laptop CPUs), EPYC (server CPUs), and Radeon (GPUs), with strong expansion in AI and custom silicon for next-gen applications.
Fundamentals
Earnings: AMD reported strong Q1 2025 earnings with a beat on both revenue and EPS, supported by explosive demand in the AI and data center segments.Revenue: $6.52B, up 21% YoY
Outlook: The company raised guidance for the second half of 2025 as it expects to benefit from the AI chip boom and new product rollouts.
Technicals (4H Chart)
Inverted Head and Shoulders pattern confirmed with neckline breakout around ~$117
Breakout from Falling Channel aligning with bullish reversal structure
Price surged past resistance with strong volume, currently at $126.39 (+9.71%)
RSI at 65.88, approaching overbought but not signaling weakness
MACD bullish crossover, confirming momentum
Short-term target range: $145–$150, with extended projection up to $162.75
📌 Support Levels: $117, $111.50📈 Target Price (TP): $162.75 (based on pattern breakout height projection)
💡 My Take
AMD just pulled off a textbook bullish reversal — inverted head and shoulders breakout combined with a falling channel exit. With strong macro trends in AI hardware and data center expansion, this move feels well-supported fundamentally and technically.
The clean neckline breakout and explosive candle suggest continuation. I am expecting a potential consolidation around $130–$135ish before next leg to $150+. If momentum holds, $162+ is possible before August.
💼 Position
Type: AMD 145 Call
Expiry: July 03, 2025
Quantity: 15
Average Cost Basis: $.038
Date Purchased: June 12, 2025
Last Price: $0.47
Total % Gain/Loss: +23.4%
I entered after the neckline break and riding the wave. AMD’s setup is too clean to ignore — high conviction play.
Big move for AMD monday inverted H&S greatly confirmed 150USD!!!The pattern have been greatly confirmed for me and i will sell my amd this week at 150 USD and i will wait at july when a drop will occurs to rebuy and i will cumulate more stock or more profits in cash.
The information and publications are not meant to be, and do not constitute, financial, investment, trading, or other types of advice or recommendations.
Thank you!
Subcribe TSXGanG! (For real chart)

AMD: Short-term Upward PotentialAMD has continued to face downward pressure, preventing further progress in green wave . While this wave still has room to rise, its top should form below resistance at $141.16. Once wave completes, wave should follow—finishing the larger green impulse to the downside and completing the corrective structure of blue wave (II). This move is expected to conclude in our blue Long Target Zone between $62.82 and $35.19. That said, we continue to monitor a 30% alternative scenario: it suggests that wave alt.(II) has already bottomed at $76.12. In that case, AMD wouldn’t visit the blue zone but instead break out directly above the resistances at $141.16 and $174.98—marking the beginning of wave alt.(III).
📈 Over 190 precise analyses, clear entry points, and defined Target Zones - that's what we do.

Chipmaker Stocks DeclinesChipmaker Stocks Declines
According to the charts, semiconductor stocks underperformed the broader equity market yesterday. While the S&P 500 index (US SPX 500 mini on FXOpen) fell by around 2.2%, the drop was far steeper across the chip sector:
→ The bullish semiconductor ETF (SOXL) declined by 15%;
→ Nvidia (NVDA) shares fell by 6.9%;
→ Advanced Micro Devices (AMD) dropped by 7.3%.
In other words, chipmaker stocks dragged down the broader market, raising concerns ahead of the upcoming earnings season.
Why Are Chip Stocks Falling?
The decline stems from corporate assessments of how the escalating global trade war and new tariffs could impact future performance.
According to media reports:
→ AMD expects to face tariffs of up to $800 million on exports to China;
→ For Nvidia, similar levies could exceed $5 billion.
Technical Analysis – Nvidia (NVDA)
The price continues to fluctuate within a downward channel, previously identified in our analysis:
The lower boundary of the channel is acting as support, helping the price close near its opening level yesterday (forming a Doji candle on the daily chart).
Technical Analysis – AMD
A similar picture is emerging on the AMD chart:
The $96 level now appears to be a key resistance zone.
In Summary
All eyes are on today’s earnings report from chipmaker TSMC (TSM), which could significantly influence the currently bearish sentiment in the sector.
This article represents the opinion of the Companies operating under the FXOpen brand only. It is not to be construed as an offer, solicitation, or recommendation with respect to products and services provided by the Companies operating under the FXOpen brand, nor is it to be considered financial advice.
