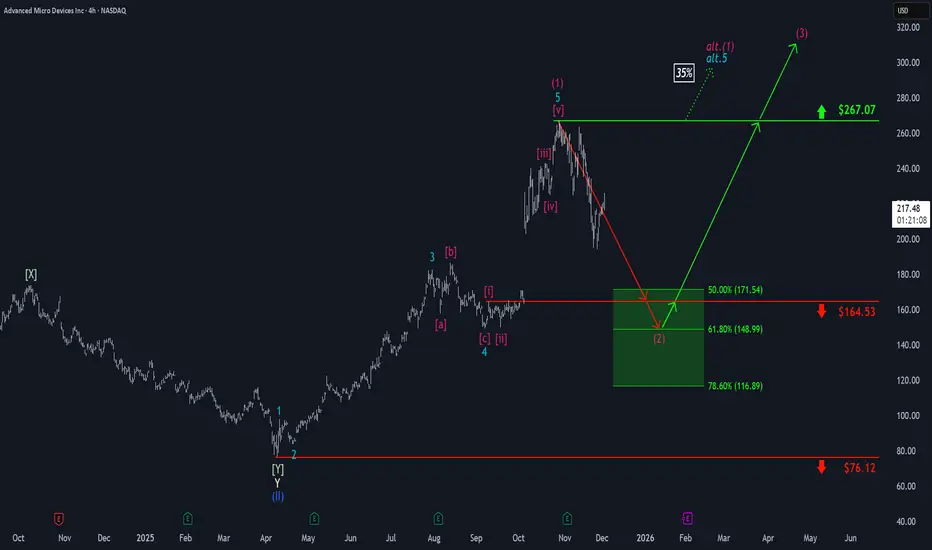
AMD: Short-Term Rebound Before Pullback?At AMD, a rebound has been taking shape recently. If this upward momentum continues in the near term and pushes price decisively above the $267.07 resistance level, we may have to expect a new high for the magenta wave alt.(1) (probability: 35%). However, our primary expectation is for the stock to soon turn lower and to move into our green Long Target Zone between $171.54 and $116.89. Following the low of the magenta wave (2) within this zone, the ongoing upward move should eventually break through the $267.07 resistance.
Amdprediction
Amd - Here comes the massive reversal!🩻Amd ( NASDAQ:AMD ) is starting to reverse:
🔎Analysis summary:
Starting back in mid 2025, Amd retested a major confluence of support and rallied about +200%. All of this was expected and the rally ended with a retest of a significant trendline. Eventually, after some back and forth, Amd will then create a short term retracement.
📝Levels to watch:
$250
SwingTraderPhil
SwingTrading.Simplified. | Investing.Simplified. | #LONGTERMVISION

AMD Under Watch ⇌ Sellers Strengthening at Major Supply Zones🔥📉 AMD “ADVANCED MICRO DEVICES INC.” – Bearish Profit Playbook | Thief Layers Deployed 🚨
Hey traders! 😎🔍
Here’s my bearish swing/day-trade playbook on AMD, crafted with a fun + professional thief-style twist while staying within TradingView rules. Let’s break it down 👇💼
📉 Plan: Bearish Outlook Active
Price action remains heavy, momentum cooling off, and sellers showing presence near key zones.
Thief Squad preparing for controlled entries 😎🧤.
🎯 Entry Plan (Thief Layering Strategy)
This setup uses a layered limit-style approach — also known as multiple staggered entries to smooth positions.
📌 Proposed Sell-Limit Layers:
230
220
210
(You can extend layers based on your own system — thief flexibility ALWAYS 😎)
⚠️ Note: These are example layers for illustration, not fixed instructions. Adjust based on your own risk model.
🛑 Stop-Loss (Thief Safety Net)
SL Zone: 240
Dear Ladies & Gentlemen (Thief OG’s) 💼🕶️
This SL is simply my reference point — NOT a rule.
You decide your own SL based on your risk appetite, not mine.
Make money? Then take money… at your OWN risk 💰😄.
🎯 Target Zone
Price has a strong support cluster aligning with:
Moving Averaging acting as dynamic support
Oversold zone building
Trap mechanics likely
So the quick escape target is:
👉 TP: 180
Dear Ladies & Gentlemen (Thief OG’s) 💼😄
My TP is not mandatory — adjust yours as you wish.
Take your profits and leave before the “police” catches our position 🚓💨😆.
🔗 Related Pairs to Watch (Correlation Insights)
These assets often move with similar sentiment due to tech-sector correlation, semiconductor supply chain, and risk-on/off flows:
💻 NVDA (NVIDIA)
Strong semiconductor leader — AMD often shadows NVDA’s volatility and sector direction.
📱 QQQ (NASDAQ 100 ETF)
AMD is inside the NASDAQ index. When QQQ sells off, AMD typically follows the broader tech flow.
🌐 SMH (Semiconductor ETF)
Tracks the entire chip sector. Helps understand overall industry strength or weakness.
⚡ TSLA (Tesla)
Not directly connected, but both ride similar high-beta risk cycles. Weak tech sentiment can drag TSLA and AMD simultaneously.
Watching these helps confirm momentum, risk appetite, and sector-wide signals 📊🔍.
🧠 Additional Notes
This setup is for educational, fun, strategy-style illustration purposes.
NOT forcing a fixed entry, SL, or TP on anyone.
Trade smart. Manage risk. Thief style = creativity + discipline ✨😎
✨ “If you find value in my analysis, a 👍 and 🚀 boost is much appreciated — it helps me share more setups with the community!”

Breaking; Advanced Micro Devices, Inc. (AMD) Is Up 7%The price of Advanced Micro Devices, Inc. (AMD) spike 7% in early market trading on Thursday as the stock broke from a bullish flag pattern.
In another news that served as a catalyst, AMD, Cisco and HUMAIN to invest in a joint venture and serve as its exclusive technology partners, deepening their multi-year strategic collaboration announced in May during U.S. President Donald J. Trump's visit to the Kingdom of Saudi Arabia.
The joint venture plans to deploy up to 1 GW of AI infrastructure by 2030, with the shared ambition to expand capacity to multiple gigawatts, as a key pillar of HUMAIN's overall ambitions.
With the RSI at 44, the stock is more than able to break through highs and claim the $300 resistance.
Financial Performance
In 2024, Advanced Micro Devices's revenue was $25.79 billion, an increase of 13.69% compared to the previous year's $22.68 billion. Earnings were $1.64 billion, an increase of 92.15%.
About AMD
Advanced Micro Devices, Inc. operates as a semiconductor company worldwide. It operates in three segments: Data Center, Client and Gaming, and Embedded. The company offers artificial intelligence (AI) accelerators, x86 microprocessors, and graphics processing units (GPUs) as standalone devices or as incorporated into accelerated processing units, chipsets, and data center and professional GPUs; and embedded processors and semi-custom system-on-chip (SoC) products.

Amd - Here comes the major reversal!👺Amd ( NASDAQ:AMD ) is reversing right now:
🔎Analysis summary:
Over the course of the past couple of months, we witnessed a very expected rally on Amd of about +250%. But right now, Amd is retesting a major resistance trendline. If we actually see bearish confirmation in the near future, the next bearmarket will start quite soon.
📝Levels to watch:
$250
SwingTraderPhil
SwingTrading.Simplified. | Investing.Simplified. | #LONGTERMVISION

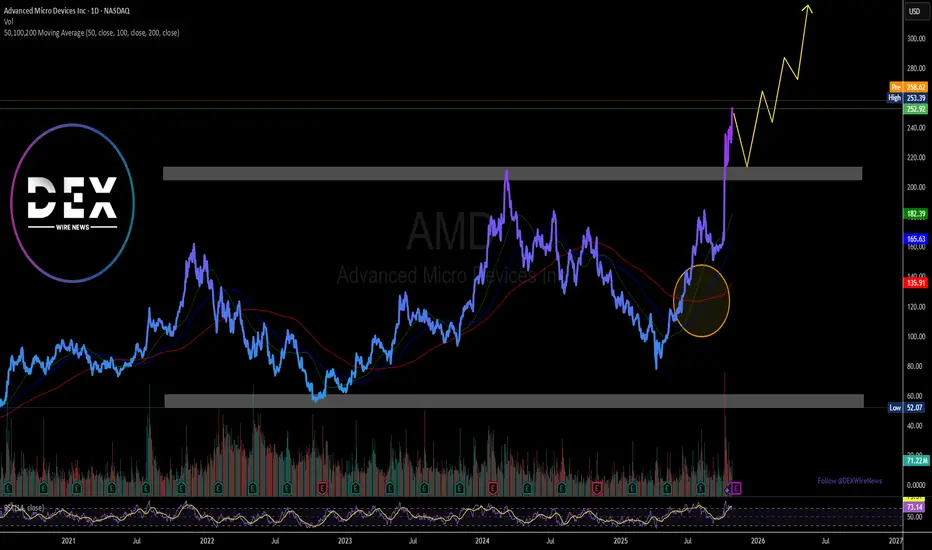
Advanced Micro Devices, Inc. (AMD) Gearing For A BreakoutThe share price of Advanced Micro Devices, Inc. (NASDAQ: NASDAQ:AMD ) is setting sail for a 50% breakout albeit market condition is overbought.
Sitting with an RSI of 73, Advance Micro Devices (AMD) shows continuous bullish momentum with the daily price chart indicating a golden cross pattern- this is an interception between the 50day-MA and the 200-day MA indicating bullish momentum building.
In another news, - Advance Micro Devices (NASDAQ: AMD) today announced the completion of the agreement to divest the ZT Systems U.S.-headquartered data center infrastructure manufacturing business to Sanmina (NASDAQ: SANM).
About AMD
Advanced Micro Devices, Inc. operates as a semiconductor company worldwide. It operates in three segments: Data Center, Client and Gaming, and Embedded. The company offers artificial intelligence (AI) accelerators, x86 microprocessors, and graphics processing units (GPUs) as standalone devices or as incorporated into accelerated processing units, chipsets, and data center and professional GPUs; and embedded processors and semi-custom system-on-chip (SoC) products, microprocessor and SoC development services and technology.
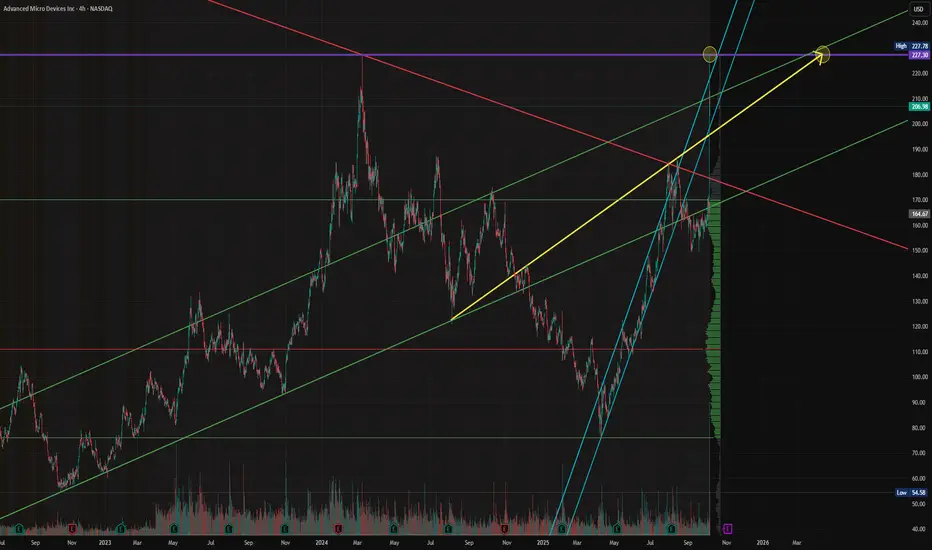
$AMD - Advanced Micro Device - $227.30 RetestNASDAQ:AMD continues its 2025 recovery rally — now clearing $200 and targeting the $227–$240 macro resistance zone.
After reclaiming the $165 structure break, AMD has re-entered its long-term ascending channel and is showing renewed strength in the AI-chip cycle.
Holding above $190 keeps this setup intact for continuation.
#AMD #AIStocks #Semiconductors #NASDAQ #BreakoutTrading #MyMIWallet
Advanced Micro Devices | AMD | Long at $126.00Advanced Micro Devices NASDAQ:AMD may be the sleeping giant in the semiconductor / AI space. While all eyes on NVidia NASDAQ:NVDA , earnings for NASDAQ:AMD grew by 800% over the past year... and are now forecast to grow 40% per year. Any other company would be soaring right now (like NVidia), but that company is getting all the attention. And, to me, this means opportunity for the future. The cashflow is likely to grow tremendously for
NASDAQ:AMD into 2027 and beyond, which may inevitably reward investors with dividends.
From a technical analysis perspective, NASDAQ:AMD just entered my historical simple moving average zone. This area (currently $108-$126) is where I will be gathering shares. Something tremendous would have to change regarding the fundamentals of this company (like a scandal) for the overall thesis to change. There may be some near-term price pains as NVidia gets all the focus, but to meet demand in the semiconductor and AI space, NASDAQ:AMD is poised to fulfill that roll in the future.
Target #1 = $158.00
Target #2 = $175.00
Target #3 = $188.00
Target #4 = $205.00

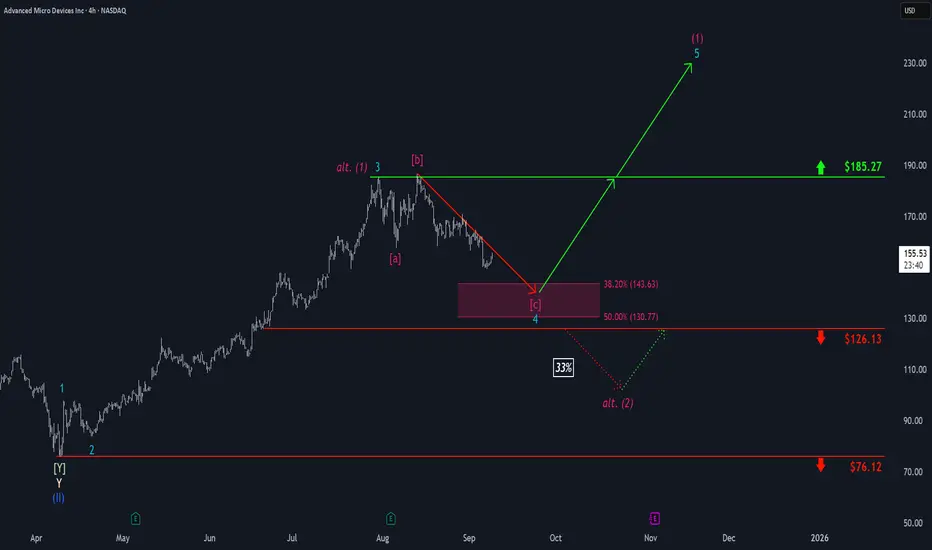
AMD: Drawing Closer...Step by step, AMD has been drawing closer to our magenta Target Zone between $143.63 and $130.77, which remains a favorable range for long entries. Prices should establish the low of turquoise wave 4 within this zone before reversing higher to resume the ongoing upward impulse—initially breaking above resistance at $185.27 and targeting the peak of magenta wave (1). However, we see a 33% chance that magenta wave alt. (1) has already completed, with a quicker low for wave alt. (2) likely to form below support at $126.13. Due to this alternative scenario, potential long trades within the magenta zone could be protected with a stop either 1% below the lower boundary of the zone or at the $126.13 level.
AMD $160C – Tactical Bounce Trade You Don’t Want to Miss
# ⚡ AMD Weekly Mean-Reversion Setup (Sept 7, 2025)
### 🔍 Market Snapshot
* **Price:** \~\$151.14
* **Technicals:** Daily RSI 28.4 → Deeply oversold 📉 | Weekly RSI 54.1, falling
* **Options Flow:** Strongly bullish (C/P = 2.13) ⚡
* **Volatility:** Low (VIX \~15), gamma low → cheap premium
* **Timeframe:** 5-day weekly expiry
---
### 🎯 Trade Idea: Tactical Bounce Play
* **Instrument:** AMD
* **Direction:** CALL (Mean-reversion)
* **Strike:** \$160
* **Expiry:** 2025-09-12
* **Entry:** \$0.77 (mid/ask)
* **Profit Target:** \$1.54 (+100%)
* **Stop Loss:** \$0.31 (-40%)
* **Size:** 1 contract (small % account, scale per risk rules)
* **Confidence:** 65%
---
### ⚠️ Key Risks
* Prior week -10% drop & heavy distribution → counter-trend risk
* Full payoff requires \~\$9 move in 5 days → moderate probability
* Concentrated \$150 puts can act as support or accelerate downside
* Weekly theta decay → exit by Thursday, avoid Friday gamma ⚡
* News/macro shock risk → use small sizing
---
### 🔑 Trade Rationale
1. Daily RSI extreme → plausible 3–5 day bounce
2. High call flow @ \$160 → short gamma/short-term buying interest
3. Low VIX → cheap premium relative to potential move
---
### ⚙️ Execution Notes
* Enter at open, limit \$0.77
* Stop at \$0.31, take partial profit at +50% (\$1.16), full at +100% (\$1.54)
* Cut if price drops below \$148–\$149 on heavy volume
---
📊 **Summary:** Tactical, defined-risk mean-reversion play. Not a trend reversal — small allocation, event-driven weekly call.
\#AMD #OptionsTrading #WeeklySetups #TradingView #MeanReversion

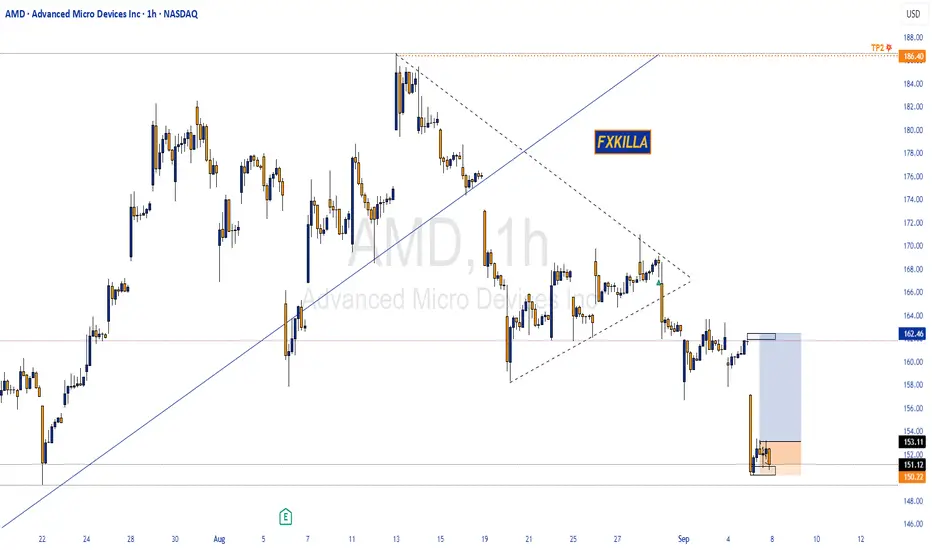
AMD HIGH PROBABILTY SETUP SOON !!!🚨 AMD HIGH PROBABILITY BUY SETUP 🚨
* Here We Can See Clearly The Next Potential Move For AMD Coming Hours/Days.
* Keep Your Eyes Close On Your Trading Positions.
* Happy PIP Hunting Traders.
FXKILLA
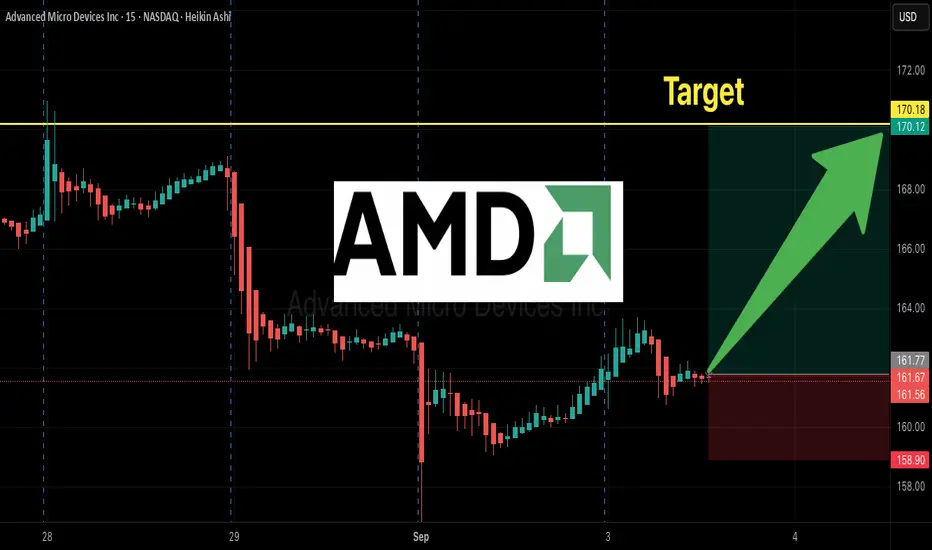
AMD Weekly Call Play – $170 Strike Ready to Explode?
## 🔥🚀 AMD Weekly Options Setup (Sep 3, 2025) 🚀🔥
💎 **High-Risk, High-Reward Call Play!** 💎
### 📊 Market Consensus
* 📈 **Bias:** Moderately Bullish (short-term upside skew).
* 🏦 **Flow:** Institutional heavy call buying (C/P = **2.19**) at \$170 strike.
* 📊 **RSI:** Weekly strong (70.8), Daily weak (43.2) → divergence ⚠️.
* ⏰ **Risk:** Only 2 DTE → Gamma & Theta decay **very high**.
---
### 🎯 Trade Setup
* 🏦 **Instrument:** AMD Weekly Call (Exp 09/05)
* 🚀 **Strike:** \$170
* 💵 **Entry:** \$0.59
* 🛑 **Stop Loss:** \$0.30 (≈50%)
* 🎯 **Target:** \$1.18 (+100%)
* 📅 **Exit Rule:** Close **by Thursday EOD** (don’t hold into Friday gamma).
* 📏 **Size:** 1 contract (keep it small)
* 📈 **Confidence:** 65%
---
### ⚠️ Key Risks
* ⏳ Time decay → Premium can evaporate fast.
* 📉 Weak daily momentum → Possible pullback.
* 🕒 Slippage & spreads → Use **limit orders**.
---
## 📌 Tags (TradingView + SEO Boost)
\#AMD #OptionsTrading #WeeklyOptions #CallOptions #SwingTrade #Breakout #TechStocks #RiskReward #StockMarket #TradingSetup #GammaRisk #ThetaDecay #MomentumTrading
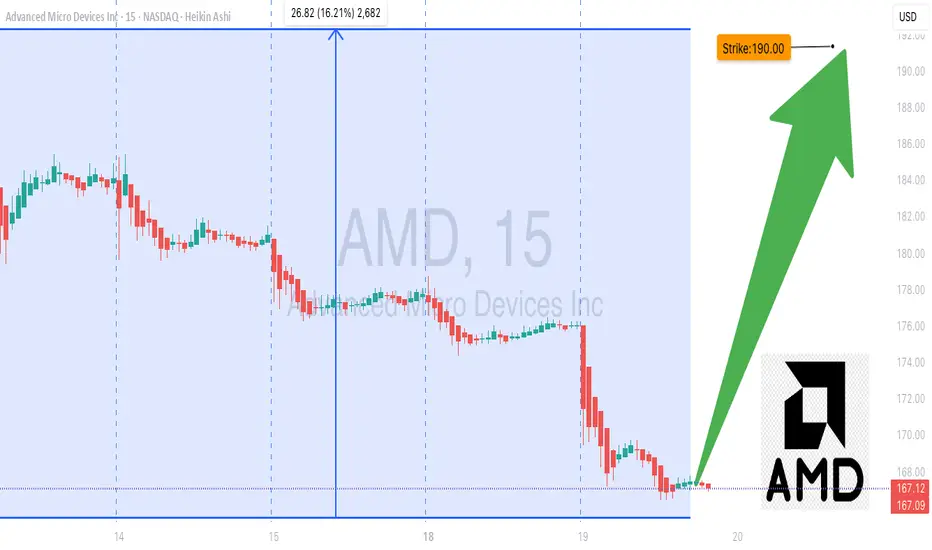
AMD Options Alert: $190 Call Ready to Pop!
# 🚀 AMD Weekly Options Analysis (Aug 19, 2025) 🚀
### **Market Snapshot**
📊 **Daily RSI:** 56.3 ⬇️ (Neutral)
📈 **Weekly RSI:** 85.1 ⬇️ (Potential Reversal ⚠️)
📉 **Volume:** Weak institutional activity (0.6x last week)
🔥 **Options Flow:** Call/Put ratio 1.21 → Moderate Bullish
✅ **Volatility:** Favorable (VIX < 15)
💡 **Overall Bias:** Moderate Weekly Bullish
---
### **Model Breakdown**
| Report | Trend | Volume | Options Flow | Bias |
| -------------------- | ------------------ | ------- | ------------ | ------------------- |
| **Grok/xAI** | NEUTRAL | WEAK 📉 | BULLISH 🔥 | Moderate Bullish 👍 |
| **Gemini/Google** | NEUTRAL/Bearish ⚠️ | WEAK 📉 | BULLISH 🔥 | Neutral/Bearish 🤔 |
| **Claude/Anthropic** | NEUTRAL/Bearish ⚠️ | WEAK 📉 | BULLISH 🔥 | Moderate Bearish 👎 |
| **Llama/Meta** | NEUTRAL ⚠️ | WEAK 📉 | BULLISH 🔥 | Moderate Bullish 👍 |
| **DeepSeek** | NEUTRAL ⚠️ | WEAK 📉 | BULLISH 🔥 | NEUTRAL 🤷 |
✅ **Consensus:**
* Weak volume = concern 🚨
* Low VIX = favorable for options 💎
* RSI signals mixed; overbought caution ⚠️
---
### **💥 Trade Recommendation 💥**
**Strategy:** Cautious Naked Call
* 🎯 **Instrument:** AMD
* 💰 **Strike:** \$190
* 🗓️ **Expiry:** Aug 22, 2025
* 💵 **Entry Price:** \$0.70
* 🎯 **Profit Target:** \$1.05 (50%)
* 🛑 **Stop Loss:** \$0.35
* ⏰ **Entry Timing:** Market Open
* 📈 **Confidence:** 65%
⚠️ **Key Risks:**
* ⏳ Accelerated time decay (3-day expiry)
* 📉 Weak volume may trigger profit-taking
---
### **Trade JSON**
```json
{
"instrument": "AMD",
"direction": "call",
"strike": 190.00,
"expiry": "2025-08-22",
"confidence": 0.65,
"profit_target": 1.05,
"stop_loss": 0.35,
"size": 1,
"entry_price": 0.70,
"entry_timing": "open",
"signal_publish_time": "2025-08-19 09:51:08 UTC-04:00"
}
AMD Ready to Break Higher – $190 Calls Flashing Opportunity!
# 🚀 AMD Weekly Options Analysis (2025-08-17) – Don’t Miss Out!
### 🔎 Market Overview
AMD’s weekly options landscape shows **strong bullish sentiment**: high call volume and supportive sentiment suggest traders expect upward movement, though some caution arises from declining short-term indicators.
---
### 📊 Key Model Insights
* **Call/Put Ratio:** 2.03 → strong bullish flow
* **Weekly RSI:** 87.8 → extremely bullish momentum
* **Daily RSI:** 59.1 → short-term downward trend, caution advised
* **Volume:** 0.8x last week → declining institutional participation
* **Gamma Risk:** Low → favorable for entering near-term options
---
### 📌 Agreement & Disagreement
* **Agreement:** All models confirm **moderate-to-strong bullish sentiment** due to options flow and low VIX environment.
* **Disagreement:** Some models flag **weak volume**, raising caution, while others remain confident in ongoing bullish trends.
---
### 📊 Recommended Trade
* **Direction:** CALL (Long)
* **Strike:** \$190.00
* **Expiry:** 2025-08-22
* **Entry Price:** \$0.70 (midpoint)
* **Stop Loss:** \$0.35 (50% of premium)
* **Profit Target:** \$1.40 (100% gain)
* **Entry Timing:** Market Open
* **Confidence:** 65%
---
### ⚠️ Key Risks
* Weak volume → reduced institutional conviction
* Declining daily RSI → potential short-term reversals
* Monitor news/events → can affect volatility or price
---
📊 **TRADE DETAILS JSON**
```json
{
"instrument": "AMD",
"direction": "call",
"strike": 190.00,
"expiry": "2025-08-22",
"confidence": 0.65,
"profit_target": 1.40,
"stop_loss": 0.35,
"size": 1,
"entry_price": 0.70,
"entry_timing": "open",
"signal_publish_time": "2025-08-17 09:30:00 EDT"
}
``

AMD One-Day Call Opportunity – Quick Gains Ahead!🚀 AMD \$185 Call – One-Day Bullish Sprint
**Sentiment:** 🟢 *Strong Short-Term Bullish*
* **Daily RSI:** 64.2 📈
* **Weekly RSI:** 88.4 📈
* **Call/Put Volume:** Favoring calls strongly
* **Volume:** Weak (0.8× last week) → watch for support
* **Gamma Risk:** HIGH ⚡ — 1-day expiry
---
### 📊 **Consensus Snapshot**
✅ Majority of models: bullish momentum
⚠️ Weak volume + high gamma → strict risk management required
💡 Entry timing and discipline are critical
---
### 🎯 **Trade Setup**
* **Type:** CALL (Single-leg)
* **Strike:** \$185.00
* **Expiry:** 2025-08-15
* **Entry:** \$2.61 (mid-market)
* **Profit Target:** \$3.90 (+50%)
* **Stop Loss:** \$1.30 (–50%)
* **Confidence:** 70%
* **Trade Size:** 1 contract
* **Entry Timing:** Market open
---
💬 *High-momentum, short-term expiry play — monitor volume and be ready to exit quickly.*
📌 *Not financial advice. DYOR.*
---
**#AMD #OptionsTrading #CallOptions #DayTrading #StocksToWatch #GammaRisk #OptionsFlow #TradingSignals**

Amd - New all time highs will follow!🪠Amd ( NASDAQ:AMD ) rallies even much further:
🔎Analysis summary:
After Amd perfectly retested a major confluence of support a couple of months ago, we saw a textbook reversal. This retest was followed by a rally of more than +100% in a short period of time. But considering all the bullish momentum, Amd is far from creating a top formation.
📝Levels to watch:
$200
SwingTraderPhil
SwingTrading.Simplified. | Investing.Simplified. | #LONGTERMVISION

AMD Calls Flying Off the Shelves — Don’t Miss Out!🚀 AMD Weekly Options Alert (Aug 12, 2025)**
**Bias:** 🔥 **BULLISH** — Strong flow, high RSI, institutional backing
📊 **Quick Stats:**
* **Call/Put Ratio:** 2.31 → heavy call buying 📈
* **Daily RSI:** 60.4 ✅ bullish momentum
* **Weekly RSI:** 87.1 🚀 extreme strength
* **Volume:** 1.1× last week — institutional participation confirmed
* **VIX:** 15.0 → low volatility, stable premiums
* **DTE:** 3 | **Gamma Risk:** Moderate | **Time Decay:** Accelerating
💡 **Trade Setup:**
* **Type:** Naked CALL
* **Strike:** \$182.50
* **Expiry:** Aug 15, 2025
* **Entry:** \$0.69
* **PT:** \$1.38 (+100%)
* **SL:** \$0.34
* **Confidence:** 80%
⚠ **Risks:**
* 3 DTE = fast-moving gamma swings
* Semiconductor sector news could shift momentum
* RSI high — watch for intraday pullbacks
---
**📈 TL;DR:**
High RSI + bullish flow + strong volume = momentum play. Manage gamma risk, aim for quick profit.
\#AMD #OptionsTrading #CallOptions #WeeklyOptions #BullishBreakout #OptionsFlow #TradingSetup #TechnicalAnalysis #MomentumTrading #StockMarket #OptionsAlert

AMD Gamma Squeeze Potential?### 🚀 AMD Bulls or Trap? | \$175C Trade Setup Before Expiry!
**⚠️ High Gamma, Mixed Sentiment – Time-Sensitive Play**
📉 **Weekly RSI**: 70.4 (falling)
📈 **C/P Ratio**: 2.07 (bullish bias)
🔁 **Volume**: 1.2x weekly avg
📊 **Model Sentiment**:
* **Grok/xAI**: Bullish (Call accumulation 📈)
* **Claude/DeepSeek**: Bearish (Institutional selling 🚨)
* **Gemini**: Cautious Bearish
* **Llama**: Neutral / Wait & See
📌 **Suggested Trade**
🔵 **Call**: AMD \$175C (Aug 8 Exp.)
🎯 **Entry**: \$0.66
🛑 **Stop**: \$0.33
💰 **Target**: \$1.25
📆 **DTE**: 1
🔥 **Gamma Risk**: High – requires fast execution
🧠 **Confidence**: 65%
🧠 Watch for sharp moves. Mixed model sentiment = **great volatility** = **great opportunity** (with tight risk mgmt).
💬 *Would you take this trade?*
👇 Drop your thoughts in the comments!

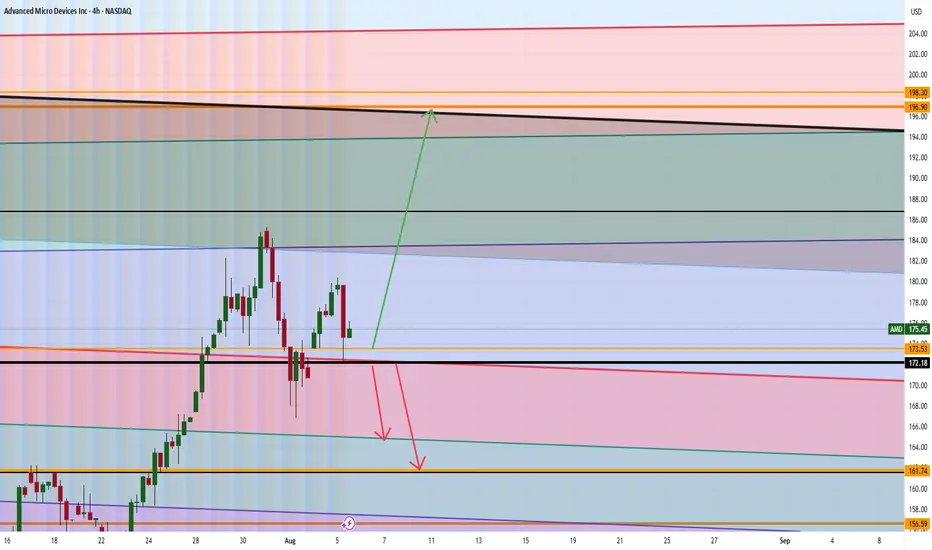
AMD Analysis Are WE GOING TO $199? Good morning trading fam
Currently we a strong bull run for AMD on the Monthly time frame.
Currently if we can hold above 172 then we will see a nice run up to 196-199 territory or higher.
If we break below the 172 we can a quick short down to the orange level we marked out.
Happy Trading
Trade Smarter Live Better
Kris
AMD Don't Miss Out
### 🚀 \ NASDAQ:AMD Bullish Reversal Play — Weekly Options Setup
**🔥 Institutional Flow + RSI Momentum + Volume Surge = Opportunity**
---
📊 **Model Consensus Summary (Grok, Claude, Gemini, Llama, DeepSeek):**
* **🟢 Weekly RSI:** Climbing ⬆️ — confirms trend
* **🔴 Daily RSI:** Slight dip = caution, but **volume overrides**
* **💰 Call/Put Ratio:** 2.00 → **Big Money** loading calls
* **📈 Volume Spike:** 1.7x last week → institutional confirmation
* **🧠 AI Sector Tailwind:** Adds strong narrative fuel
---
### 🎯 Trade Setup – 5D Weekly CALL
| 🧾 Entry | 🎯 Target | 🛑 Stop Loss | 🎲 Risk/Reward | 📅 Expiry |
| -------- | --------------------------- | ------------ | --------------- | ---------- |
| \$4.40 | \$6.75 (TP1) / \$9.00 (TP2) | \$2.60 | 1:1.78 / 1:3.46 | 2025-08-08 |
**📌 Strike:** \$180.00
**🎯 Strategy:** Naked CALL (single-leg)
**⏰ Entry:** Market open
**✅ Confidence:** 75%
**⚠️ Risk Flag:** Short-term volatility from daily RSI dip
**🔍 SL based on 40% drawdown tolerance**
---
### 📣 TL;DR
> **“Smart money is early. Momentum is building. AMD could break out hard.”**
> 🔸 Weekly RSI + Volume + Calls = Setup
> 🔸 Short-dated play for aggressive profits
> 🔸 Tight stop, wide upside
---
### 💡 Tag It:
\#AMD #OptionsTrading #WeeklySetup #TradingSignals #AIStocks #InstitutionalFlow #RSI #CallOptions #MomentumPlay #TradingView #SwingTrade

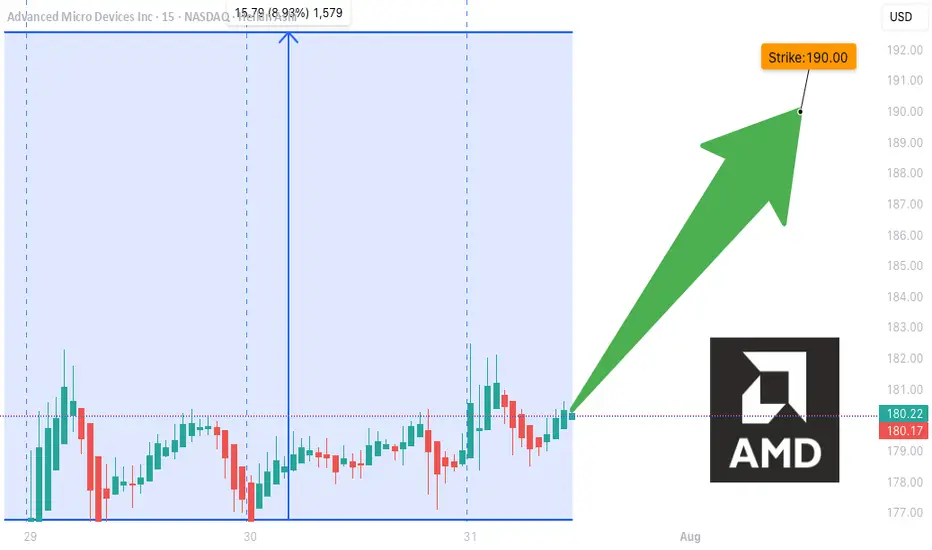
AMD WEEKLY TRADE SIGNAL (7/31/25)
### 🚀 AMD WEEKLY TRADE SIGNAL (7/31/25)
📈 **MARKET SNAPSHOT**
🟢 Daily RSI: **86.0** 🔥
🟢 Weekly RSI: **80.4**
📊 Volume: 🔺 1.5x (Institutional surge)
💬 Call/Put Ratio: **1.90**
🌪 Gamma Risk: **HIGH (1DTE)**
🧠 Sentiment: **Extremely Bullish** across all models
---
💥 **TRADE IDEA**
📍 Ticker: **\ NASDAQ:AMD **
📈 Direction: **CALL (LONG)**
🎯 Strike: **\$190.00**
💵 Entry: **\$0.51**
🎯 Target: **\$0.90** (+75%)
🛑 Stop Loss: **\$0.30**
📆 Expiry: **Aug 1 (Friday)**
📊 Confidence: **85%**
⏰ Entry: Market Open (Time-sensitive!)
---
🧠 **STRATEGY CONTEXT**
✅ Bullish momentum from AI sector hype
✅ Institutional call buying volume spiking
⚠️ 1DTE = High Gamma Risk = TRADE FAST OR DON’T TRADE
⚠️ Manage decay & exit early if momentum stalls
---
📌 Signal Posted: 2025-07-31 @ 12:17 PM ET
\#AMD #OptionsAlert #AITrade #WeeklyOptions #TradingViewViral #1DTE #GammaSqueeze
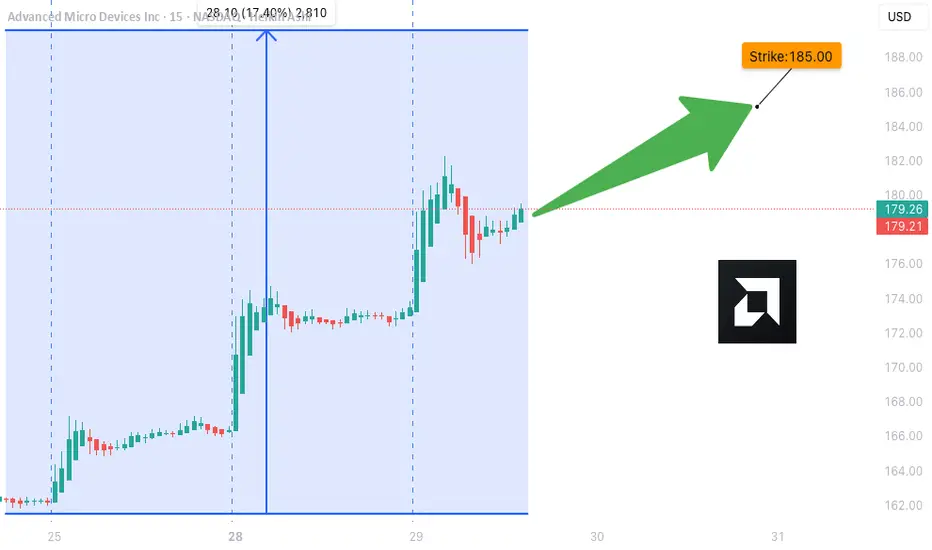
AMD Weekly Trade Alert (2025-07-29)
**🔥 AMD Weekly Trade Alert (2025-07-29) 🔥**
💹 *Momentum Confirmed. Calls Loaded. Let’s Ride.*
📈 **Key Bullish Signals**
✔️ Daily RSI: **83.2** (Rising)
✔️ Weekly RSI: **79.9** (Rising)
✔️ Call/Put Ratio: **2.03** 🧨
✔️ Volatility: Low (VIX = 15.2)
⚠️ Volume Weak (0.9x) – But not a dealbreaker.
---
**🎯 TRADE SETUP**
🔹 **Ticker**: \ NASDAQ:AMD
🔹 **Strategy**: Weekly Naked Call
🔹 **Strike**: \$185C
🔹 **Entry**: \$0.66
🔹 **Profit Target**: \$1.32 (100%)
🔹 **Stop Loss**: \$0.33
🔹 **Expiry**: 2025-08-01
🔹 **Size**: 3 Contracts
🔹 **Confidence**: 75%
---
**🧠 WHY THIS WORKS**
🔋 Momentum → STRONG
💰 Institutions are loading up calls
🧘 VIX = calm
⚡ Short gamma risk = fast payoff or cut
---
📢 **Watchlist it. Trade it. Exit fast.**
💬 Comment “🔥AMD” if you’re in.
🔁 Repost if you see \$190 coming.
\#AMD #OptionsTrading #CallOptions #TradingView #WeeklySetup #MomentumPlay #BullishSignal #MarketMomentum
AMD TRADE ALERT (07/24)
🚨 AMD TRADE ALERT (07/24) 🚨
Options flow is screaming bullish 📈
🧠 Key Insights:
• Call/Put Ratio: 1.80 (🔥 heavy call bias)
• RSI: Daily 75.5 / Weekly 77.2 = strong momentum
• Volume = weak ⚠️ but sentiment remains bullish
• High gamma risk = explosive potential near expiry
💥 TRADE IDEA
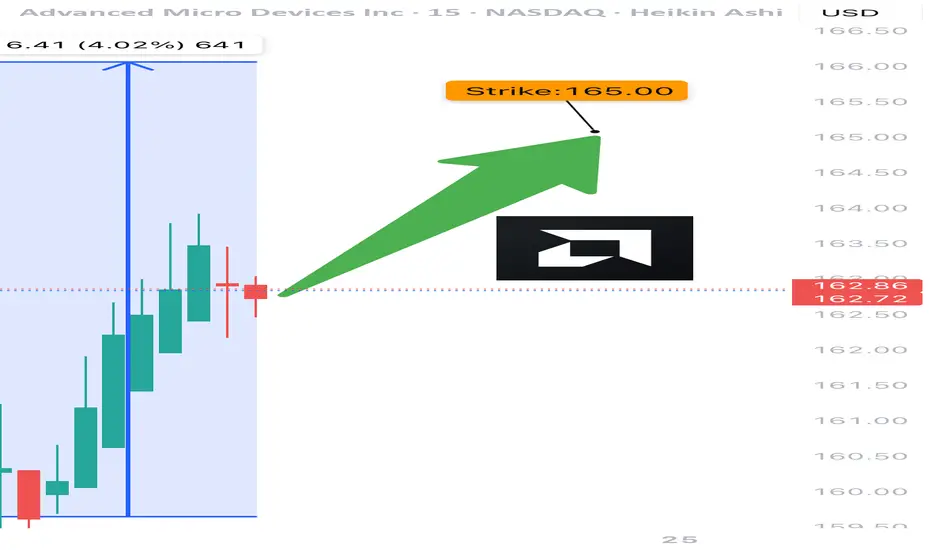
🟢 Buy AMD $165 Call exp 7/25
💰 Entry: $0.80
🎯 Target: $1.60
🛑 Stop: $0.48
📊 Confidence: 75%
⚠️ Quick expiry = fast moves. Monitor closely.
#AMD #OptionsFlow #UnusualOptionsActivity #TradingView #OptionsTrading #BullishSetup #TechStocks #DayTrading #GammaSqueeze #OptionAlerts