Is the AMD Run Over?My intuition tells me it's not. I think the Fed will be able to keep the stock market afloat for another 2-3 months (unless CoronaVirus goes really beserk), and AMD will reach new highs in the $55-$60 range as indicated by my completely arbitrary, diagonal line.
Amdshort

AMD. Make a moveGraph is showing a lot of bearish indicators. Cant say for sure when it will correct but due to the low volume, we can expect at least a correction at $40.

P/E of 251 it's totally normal :-)We have reached levels of Dotcom with revenue growth cut by half. I think it's time to sell.

AMD One of the first stocks I tradedA falling wedge has sparked a bull run on AMD, with a PT of 100 I think this is entirely plausible. Bullish MACD, 0.91 Pearsons R value and HUGE volume. Possible short term reversal at mirror level but I’m confident this bull run will continue. Various other chart patterns are present including a bump and run, and a broadening ascending wedge, which may lead to a breakdown in the long term.

AMD - Overbought and Downgraded TodayAMD is severely overbought.
It was downgraded in price this morning saying that fundamentals are overvalued.
Red boxes are down gaps to fill.
Ready for shorts or Puts. - BEAR FOOD
Looks for plenty of time to enter safe and exit safe here.
Competitor NVDA is looking stable, so probable that funds seeking chip coverage (not ETF) will go to NVDA not stay in AMD before Xmas.
I am not active in AMD currently. May be this morning, but if someone needs an updated chart PM me.
Thank you for liking, commenting, throwing up a chart, following, or viewing.
I am not a financial advisor. My comments and reviews are based on what I do with my personal accounts.
Disclosure - I am long MARA, GBTC, BTCUSD, GDX, VIXY.
Short SPY and AAPL.


Short or Time to take profit on AMD?TD Sequential showing a green 9 and stock price is also close to fib resistance level.

Bye bye AMD Round 2Working into the 37-43 range for the first time since 2006 where a massive trend reversal occurred. High chance it is about to have major trend reversal in this range. For perspective, this is a stronger trend reversal zone than the first bye bye AMD setup linked below.
Zones are general exit/entry areas, lines are levels of interest for reversal spots.
Red zone is good shorting area. Purple dotted line is stop loss for any shorts in this range.
Yellow zone are the more conservative targets if setup starts to play out.
Green zone is the more extreme target for shorts.
Naturally, yellow and green zones are also major buy zones for longs with profit targets near or above the red short zone.


AMD showing WeaknessAs explained in the Chart
Abbreviations;
NS= No supply
DW= Demand Wave
RFSB= Resistance from Supply Bar
SFDB support from Demand Bar
SLK= Stop Loss killer
SLKB= Stop Loss Killer Bottom
DB= Demand Bar
EVRB= effort vs Result Bottom
My Mentors and Inspiration
Volume Analysis - Oleg Alexandrov
Money and risk Management - Dmitriy Lavrov-


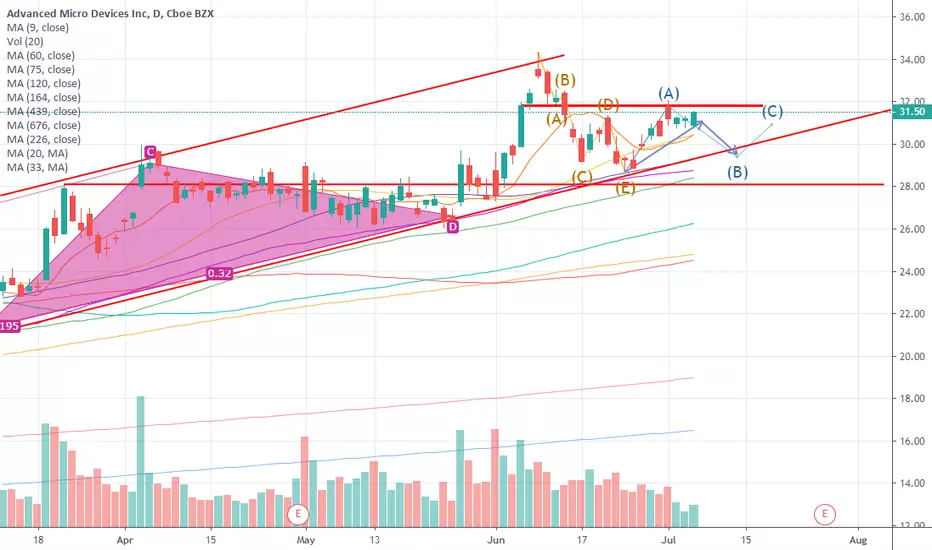
$AMD PUT (Advanced Micro Devices) Harsh rejection every time it touched pink resistance. Will this time be different?

AMD
Good Morning,
The markets took me by storm yesterday and I was not expecting it to react as it did to the rate cuts. Nonetheless, the following weeks will bring volatility back to the market which is great for option traders.
I did a quick and dirty of of AMD and decided to hedge my position to the downside. I should have done this yesterday but I didn't move quick enough. Looking at the fib levels, we can see a nice 5% gap from where we are now to the the next retracement. I am doing a short put option to try and capture this downside and re-coup some of my losses.
In addition, I noticed that since December 2018 it is not uncommon for AMD to deviate out of the channel by 8% before finding its way back to the technical levels. So keep and eye on this, but also be cognizant that we could see another October 2018. Happy trading.
Yours in Mastery,
Khalil

AMD, Your Time is UpBearish Divergence continuing to print on the daily. Price increasing, but steady decline in volume. Where are the buyers at to keep it going? I see a rising wedge primed for a nice drop to the 61.8 and then lower. I counted the waves, and I would be looking for some kind of flat correction to form. AMD needs to breathe a bit as a correction is always needed for continued growth. I am not a financial adviser and do not hold any AMD, this is not a buy or sell signal, this is strictly informational and for myself to look back on. Stay safe out there, everybody! Please consider dropping me a follow.


Daily AMD stock price forecasting analysis05-JUL
Price trend forecast timing analysis based on pretiming algorithm of Supply-Demand(S&D) strength.
Investing position: In Falling section of high risk & low profit
S&D strength Trend: In the midst of a rebounding trend of upward direction box pattern price flow marked by limited falls and upward fluctuations.
Downward trend coming soon.
Today's S&D strength Flow: Supply-Demand(S&D) strength flow appropriate to the current trend.
read more: www.pretiming.com
D+1 Candlestick Color forecast: RED Candlestick
%D+1 Range forecast: 2.9% (HIGH) ~ 0.8% (LOW), 0.5% (CLOSE)
%AVG in case of rising: 3.1% (HIGH) ~ -1.0% (LOW), 1.7% (CLOSE)
%AVG in case of falling: 1.7% (HIGH) ~ -2.6% (LOW), -2.0% (CLOSE)
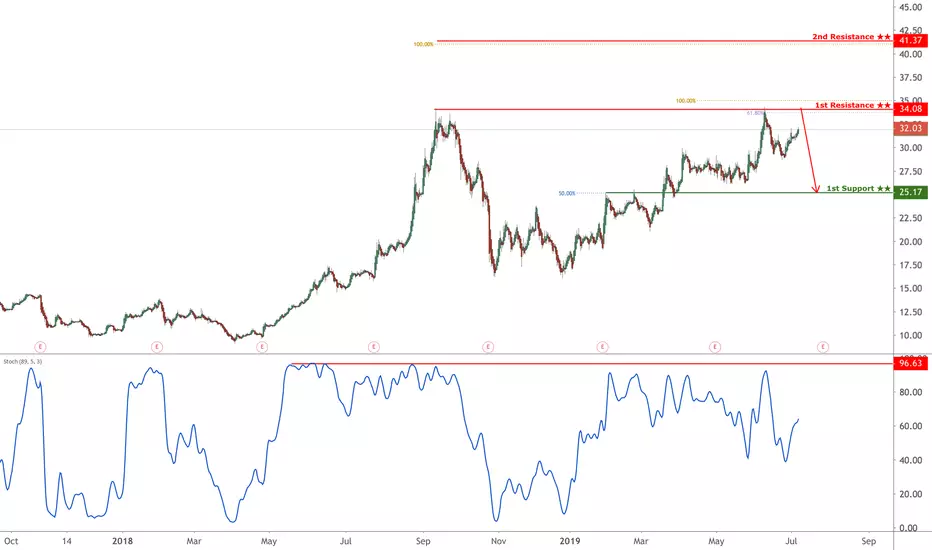
AMD reversed from resistance, potential drop!
AMD reversed off its resistance at 34.08 where it could potentially drop further to 25.17.
Trading CFDs on margin carries high risk.
Losses can exceed the initial investment so please ensure you fully
understand the risks.
Daily AMD forecast timing analysis by Supply-Demand strength24-Jun
Investing strategies by pretiming
Investing position about Supply-Demand(S&D) strength: In Falling section of high risk & low profit
Supply-Demand(S&D) strength Trend Analysis: About to begin a rebounding trend as a downward trend gradually gives way to slowdown in falling and rises fluctuations
Today's S&D strength Flow: Supply-Demand strength has changed from a strong selling flow to a suddenly strengthening buying flow.
View a Forecast Candlestick Shape Analysis of 10 days in the future: www.pretiming.com
(You can easily create a trading plan.)
D+1 Candlestick Color forecast: RED Candlestick
%D+1 Range forecast: 1.6% (HIGH) ~ -0.2% (LOW), 0.3% (CLOSE)
%AVG in case of rising: 3.3% (HIGH) ~ -1.0% (LOW), 1.8% (CLOSE)
%AVG in case of falling: 1.7% (HIGH) ~ -2.6% (LOW), -2.0% (CLOSE)
Price Forecast Timing Criteria: Price forecast timing is analyzed based on pretiming algorithm of Supply-Demand(S&D) strength.
AMD forecast timing analysisStock investing strategies
Read more: www.pretiming.com
Investing position about Supply-Demand(S&D) strength: In Falling section of high risk & low profit
S&D strength Trend Analysis: In the midst of a downward trend of strong downward momentum stock price flow marked by temporary rises and strong falls.
Today's S&D strength Flow: Supply-Demand(S&D) strength flow appropriate to the current trend.
D+1 Candlestick Color forecast: RED Candlestick
%D+1 Range forecast: 1.4% (HIGH) ~ -2.0% (LOW), -0.7%(CLOSE)
%AVG in case of rising: 3.4% (HIGH) ~ -1.0% (LOW), 1.9% (CLOSE)
%AVG in case of falling: 1.6% (HIGH) ~ -2.7% (LOW), -2.0%(CLOSE)
Stock Price Forecast Timing Criteria: Stock price forecast timing is analyzed based on pretiming algorithm of Supply-Demand(S&D) strength.

AMD, short to 28.94 after market opening.AMD show big volumes on sell and small one on purchasing also there is a lot of closing at bulls candles (it show x-volume indicator).I mark a strong resistance as red color level its 28.32 and 28.04. Transit level is 30.84 (its means there is no big player on it and level can be free going by price).
Levels thanks to X-Lines indicator. Volumetric analys with X-volume. I wait your quastions and likes. Follow me;)
