AMD Showing Bearish Evening Star, A Potential Trend ReversalI posted a bearish idea last year about this stock and this was when the AI sentiment was still strong but despite of that after that major gap up, thing started to slowly change. Over the past session, I've seen this stock is started to show some selling pressures again. And there’s been real news pressure pushing the stock lower, not just noise:
I'd like to share it here:
1) Competitive Pressure From Microsoft’s AI Chip Reveal
Shares of AMD recently slid after Microsoft unveiled a new AI chip designed to reduce reliance on established chipmakers, which hit AMD’s narrative as a core supplier in AI-driven demand. This kind of development creates uncertainty around AMD’s growth trajectory in key markets like cloud/custom silicon.
2) Broader Tech Weakness After Microsoft Earnings
MSFT itself has been getting punished after earnings despite beating estimates, largely due to concerns that massive capex and cloud spending aren’t translating into huge near-term returns and that drag rippled across the tech sector. Tech stocks, including semiconductors, were among the weakest as markets digested this.
3) Mixed Sentiment + Volume Drop
Recent sessions showed AMD trading down on weaker volume, suggesting selling pressure without meaningful buyer support — a bearish backdrop that reinforces the technical pattern.
I am bearish at AMD right now and I will try to trade this as low as that $200 level.
Amdstock

Amd - This correction is not over yet!🤬Amd ( NASDAQ:AMD ) can still drop another -30%:
🔎Analysis summary:
2025 has been an incredible - yet expected - year for Amd. And now, Amd is literally just perfectly rejecting the overall resistance trendline. Looking at higher timeframe structure, Amd is still not done with the drop and can correct another -20% to -30% soon.
📝Levels to watch:
$175
SwingTraderPhil
SwingTrading.Simplified. | Investing.Simplified. | #LONGTERMVISION

AMD Pullback Complete? Momentum Signals Say Watch Closely🚀 AMD – NASDAQ | Market Profit Playbook (Swing Trade)
🎯 Bullish Layered Entry Setup + Macro Factors
📌 Asset: Advanced Micro Devices, Inc. (Ticker: NASDAQ:AMD • NASDAQ Equity)
📈 Setup Type: Bullish Swing Play — Momentum + Pullback + Macro Support
📊 Timeframe: Swing / Multi-session
📍 Trade Plan — Bullish Thief Strategy (Layer Entries) 💰
Market Bias: Bullish continuation confirmed when price respects strong moving average pullback levels and accumulates buyers.
Strategy: Thief Style Layered Buy Limits 🧵
🔹 Buy Zones (Layered Limit Entries):
• 🛒 Layer 1: 205.00
• 🛒 Layer 2: 210.00
• 🛒 Layer 3: 215.00
• 🛒 Layer 4: 220.00
(You may extend layers above or below based on market context & risk tolerance)
💡 Layered limit orders help scale into the position during volatility and liquidity troughs for smoother basis.
🎯 Targets & Exits
📌 Primary Target: ~260.00 🚀
• Psychological resistance & overbought trap zone 👮♂️ — profit taking recommended as momentum stalls.
• Adjust partial exits as price approaches key levels.
⚠️ This is a range target — feel free to scale in/out based on price action, RSI divergence, trend strength.
🚨 Risk Management
🔻 Stop Loss: 195.00 — risk defined zone below major support.
📌 You choose your own SL — manage risk as per your trading plan.
🔍 Why This Setup Matters (Realtime Catalysts)
📊 Fundamental & Macro Drivers
🧠 AI and Data Center Demand: AMD’s data center business continues to expand with strong AI GPU & EPYC CPU adoption; record Q3 2025 revenue + partnerships with OpenAI & Oracle boost structural growth narrative.
💼 Strong Analyst Support: KeyBanc and other analysts reaffirm overweight views with robust targets, reflecting rising hyperscaler demand.
📈 Sector Momentum: Broader Nasdaq strength driven by tech & AI sentiment supports semiconductor plays like AMD.
🌍 Economic Factors to Watch
📊 Semiconductor Market Growth: Global market projected to expand significantly by 2025-26, fueled by AI, HPC & cloud infrastructure.
💡 Inflation / Cost Pressures: Ongoing inflation & supply chain costs continue to impact margins — track CPI & producer price data for risk gauges.
📉 Interest Rates: Any shifts in Fed policy or rate expectations can influence tech valuations quickly — watch upcoming FOMC dates.
🔗 Related Pairs / Correlations to Watch
🪙 Tech & Semiconductor Peers
• NASDAQ:NVDA (NVIDIA) — closely correlated AI / GPU leader
• NASDAQ:INTC (Intel) — fundamental demand indicator for chip cycle
• NASDAQ:AVGO (Broadcom) / NASDAQ:MU (Micron) — memory & connectivity cues
💡 Strength in peers often supports AMD momentum — divergence may signal rotation or sector rebalancing.
🛠 Technical Edge + Trader Sentiment
📌 Momentum Confluence:
• Pullbacks to key moving averages often trigger institutional buy pressure.
• Layered entries capture volatility while smoothing risk.
📌 Oscillators:
• Overbought RSI warns of profit zones near targets — taper positions accordingly.
📌 Market Structure:
• Watch for higher highs & higher lows formation for trend confirmation.
❗ Notes for Traders
• This is a plan template — adapt based on live price action.
• Always adjust layers, risk, and targets based on volatility & liquidity.
• Disclaimer: This is Thief style setup with fun rhythm — your execution + risk discipline matters.
✨ “If you find value in my analysis, a 👍 and 🚀 boost is much appreciated — it helps me share more setups with the community!”
📌 Disclaimer: This is thief style trading strategy just for fun.

Amd - This stock is just crashing!🎯Amd ( NASDAQ:AMD ) is clearly heading lower:
🔎Analysis summary:
After we witnessed a major bullish break and retest in April of 2025, Amd rallied about +150%. But with the recent rejection at the major resistance trendline, Amd is now reversing. Following this bearish market structure, Amd can still correct about -25%.
📝Levels to watch:
$150
SwingTraderPhil
SwingTrading.Simplified. | Investing.Simplified. | #LONGTERMVISION

AMD Hull MA Pullback: Strong Upside Projection Ahead!🔥 AMD Profit Playbook — Hull MA Pullback Power Move 🔥
Asset: AMD – Advanced Micro Devices Inc.
Market: NASDAQ
Style: Day/Swing Trade Profit Playbook
📈 Trade Thesis
The bullish structure stays intact with a clean HULL Moving Average pullback confirming continued upside momentum. The flow remains constructive as long as price respects trend behavior and avoids deep retracements.
🎯 Entry Plan
You can enter at any valid price zone based on your personal system, confirmation signals, or preferred demand levels. Traders use different timing tools — choose what aligns with your process. ⚙️📊
🛑 Stop Loss Zone
SL: 160.00
This is the “Thief SL” level — tight, sharp, and designed for aggressive traders only.
Note: Dear Ladies & Gentlemen (Thief OG’s), this is not a mandatory SL. Choose your own SL based on your risk appetite. Your money = your responsibility. Stay smart, stay safe. 💼⚠️
🎯 Take Profit Targets
Target 1 → 236.00
📌 Strong resistance + trap + liquidity pocket — smart place to escape with clean profits.
Target 2 → 260.00
📌 Heavy resistance + overbought zone + trap formation — high-reaction level, so secure profits before the crowd reacts.
Note: Dear Ladies & Gentlemen (Thief OG’s), TPs are guidance only. You decide your exits. You make money → you take money at your own risk. 💸🫡
👀 Related Pairs to Watch (Correlated / Sector Influence)
These tickers often react together due to semiconductor sector rotation, AI-demand cycles, and ETF weightings:
NASDAQ:NVDA
– Direct peer. Moves with AI spending cycles. Large swings can influence AMD sentiment.
NASDAQ:SMH (VanEck Semiconductor ETF)
– Sector trend indicator. If SMH pumps, AMD usually follows.
NASDAQ:SOXX (iShares Semiconductor ETF)
– Broad chip-market strength gauge. Market-wide chip themes impact AMD direction.
NASDAQ:QCOM
– Tech-chip correlation, especially during macro chip-cycle expansions.
NYSE:TSM
– Manufacturing leader. Capacity signals often impact AMD pricing expectations.
Watching these pairs helps you gauge risk-on/off behavior across semiconductors and improves timing on AMD entries/exits. ⚡📊
📘 Final Notes
This setup is crafted for fun with a “thief-style trading twist”, but still aligned with proper technical structure and TradingView’s rules.
Nothing here is a financial recommendation — just pure charting vibes, strategy style, and technical storytelling. 🎨📉📈
✨ “If you find value in my analysis, a 👍 and 🚀 boost is much appreciated — it helps me share more setups with the community!”
Disclaimer:
This is thief-style trading strategy just for fun. Not financial advice. Trade responsibly.
#AMD #NASDAQ #SwingTrade #DayTrade #HULLMA #BullishSetup #LiquidityZones #Semiconductors #SMH #SOXX #NVDA #TSLAstyleCharts #PriceAction #TechnicalAnalysis #ThiefStyleTrader 🚀🔥

AMD: Short-Term Rebound Before Pullback?At AMD, a rebound has been taking shape recently. If this upward momentum continues in the near term and pushes price decisively above the $267.07 resistance level, we may have to expect a new high for the magenta wave alt.(1) (probability: 35%). However, our primary expectation is for the stock to soon turn lower and to move into our green Long Target Zone between $171.54 and $116.89. Following the low of the magenta wave (2) within this zone, the ongoing upward move should eventually break through the $267.07 resistance.
AMD I Retracement and more upside potential Welcome back! Let me know your thoughts in the comments!
** AMD Analysis - Listen to video!
We recommend that you keep this on your watch list and enter when the entry criteria of your strategy is met.
Please support this idea with a LIKE and COMMENT if you find it useful and Click "Follow" on our profile if you'd like these trade ideas delivered straight to your email in the future.
Thanks for your continued support!

AMD Shares Fall Despite Strong NewsAMD Shares Fall Despite Strong News
It emerged this week that the US government, together with Advanced Micro Devices (AMD), has launched the “Mission Genesis” initiative aimed at boosting national computing power through advanced supercomputing. The project is expected not only to significantly expand federal computational capacity but also to increase AMD’s revenue.
Nevertheless, AMD was among yesterday’s weakest performers. Market sentiment has been dampened by concerns over intensifying competition from Google. According to media reports:
→ Google’s TPU (Tensor Processing Unit) chips show strong potential for AI training.
→ Meta Platforms is already in talks to invest billions in Google’s chips for use in its data centres from 2027.
A decline of around 20% in AMD’s share price since the start of the month is worrying, yet the chart analysis offers some encouragement for the bulls.
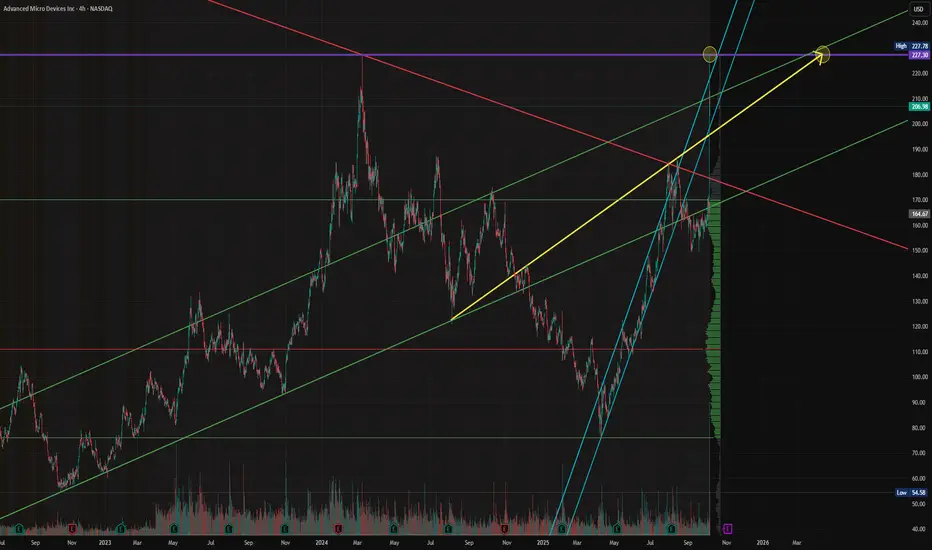
Technical Analysis of AMD Shares
Price action suggests that since April, AMD has been trading within a broad upward channel (shown in blue). Within this structure:
→ the price set an all-time high at the end of October, where the upper boundary acted as resistance;
→ between 7 and 17 November, the median line held as support before eventually giving way;
→ today, AMD is testing the lower boundary of the channel, which may act as support.
Additional factors that could reinforce this lower-channel support include:
→ the psychological $200 level;
→ a wide bullish gap, with its upper boundary near $205.
Taking these elements into account, it is reasonable to assume that conditions may be favourable for the bulls to attempt to revive the broader 2025 uptrend.
This article represents the opinion of the Companies operating under the FXOpen brand only. It is not to be construed as an offer, solicitation, or recommendation with respect to products and services provided by the Companies operating under the FXOpen brand, nor is it to be considered financial advice.

Amd - Here comes the massive reversal!🩻Amd ( NASDAQ:AMD ) is starting to reverse:
🔎Analysis summary:
Starting back in mid 2025, Amd retested a major confluence of support and rallied about +200%. All of this was expected and the rally ended with a retest of a significant trendline. Eventually, after some back and forth, Amd will then create a short term retracement.
📝Levels to watch:
$250
SwingTraderPhil
SwingTrading.Simplified. | Investing.Simplified. | #LONGTERMVISION

AMD Under Watch ⇌ Sellers Strengthening at Major Supply Zones🔥📉 AMD “ADVANCED MICRO DEVICES INC.” – Bearish Profit Playbook | Thief Layers Deployed 🚨
Hey traders! 😎🔍
Here’s my bearish swing/day-trade playbook on AMD, crafted with a fun + professional thief-style twist while staying within TradingView rules. Let’s break it down 👇💼
📉 Plan: Bearish Outlook Active
Price action remains heavy, momentum cooling off, and sellers showing presence near key zones.
Thief Squad preparing for controlled entries 😎🧤.
🎯 Entry Plan (Thief Layering Strategy)
This setup uses a layered limit-style approach — also known as multiple staggered entries to smooth positions.
📌 Proposed Sell-Limit Layers:
230
220
210
(You can extend layers based on your own system — thief flexibility ALWAYS 😎)
⚠️ Note: These are example layers for illustration, not fixed instructions. Adjust based on your own risk model.
🛑 Stop-Loss (Thief Safety Net)
SL Zone: 240
Dear Ladies & Gentlemen (Thief OG’s) 💼🕶️
This SL is simply my reference point — NOT a rule.
You decide your own SL based on your risk appetite, not mine.
Make money? Then take money… at your OWN risk 💰😄.
🎯 Target Zone
Price has a strong support cluster aligning with:
Moving Averaging acting as dynamic support
Oversold zone building
Trap mechanics likely
So the quick escape target is:
👉 TP: 180
Dear Ladies & Gentlemen (Thief OG’s) 💼😄
My TP is not mandatory — adjust yours as you wish.
Take your profits and leave before the “police” catches our position 🚓💨😆.
🔗 Related Pairs to Watch (Correlation Insights)
These assets often move with similar sentiment due to tech-sector correlation, semiconductor supply chain, and risk-on/off flows:
💻 NVDA (NVIDIA)
Strong semiconductor leader — AMD often shadows NVDA’s volatility and sector direction.
📱 QQQ (NASDAQ 100 ETF)
AMD is inside the NASDAQ index. When QQQ sells off, AMD typically follows the broader tech flow.
🌐 SMH (Semiconductor ETF)
Tracks the entire chip sector. Helps understand overall industry strength or weakness.
⚡ TSLA (Tesla)
Not directly connected, but both ride similar high-beta risk cycles. Weak tech sentiment can drag TSLA and AMD simultaneously.
Watching these helps confirm momentum, risk appetite, and sector-wide signals 📊🔍.
🧠 Additional Notes
This setup is for educational, fun, strategy-style illustration purposes.
NOT forcing a fixed entry, SL, or TP on anyone.
Trade smart. Manage risk. Thief style = creativity + discipline ✨😎
✨ “If you find value in my analysis, a 👍 and 🚀 boost is much appreciated — it helps me share more setups with the community!”

Breaking; Advanced Micro Devices, Inc. (AMD) Is Up 7%The price of Advanced Micro Devices, Inc. (AMD) spike 7% in early market trading on Thursday as the stock broke from a bullish flag pattern.
In another news that served as a catalyst, AMD, Cisco and HUMAIN to invest in a joint venture and serve as its exclusive technology partners, deepening their multi-year strategic collaboration announced in May during U.S. President Donald J. Trump's visit to the Kingdom of Saudi Arabia.
The joint venture plans to deploy up to 1 GW of AI infrastructure by 2030, with the shared ambition to expand capacity to multiple gigawatts, as a key pillar of HUMAIN's overall ambitions.
With the RSI at 44, the stock is more than able to break through highs and claim the $300 resistance.
Financial Performance
In 2024, Advanced Micro Devices's revenue was $25.79 billion, an increase of 13.69% compared to the previous year's $22.68 billion. Earnings were $1.64 billion, an increase of 92.15%.
About AMD
Advanced Micro Devices, Inc. operates as a semiconductor company worldwide. It operates in three segments: Data Center, Client and Gaming, and Embedded. The company offers artificial intelligence (AI) accelerators, x86 microprocessors, and graphics processing units (GPUs) as standalone devices or as incorporated into accelerated processing units, chipsets, and data center and professional GPUs; and embedded processors and semi-custom system-on-chip (SoC) products.

Amd - Here comes the major reversal!👺Amd ( NASDAQ:AMD ) is reversing right now:
🔎Analysis summary:
Over the course of the past couple of months, we witnessed a very expected rally on Amd of about +250%. But right now, Amd is retesting a major resistance trendline. If we actually see bearish confirmation in the near future, the next bearmarket will start quite soon.
📝Levels to watch:
$250
SwingTraderPhil
SwingTrading.Simplified. | Investing.Simplified. | #LONGTERMVISION

AMD Shares Rise Above $250 Ahead of Earnings ReportAMD Shares Rise Above $250 Ahead of Earnings Report
Today, 4 November, after the close of the main trading session, Advanced Micro Devices (AMD) is set to release its quarterly earnings report and outline its plans for the near future. Market participants remain optimistic, as several key bullish developments last month strengthened confidence in AMD’s role in the AI infrastructure race:
→ AMD shares surged in early October following news of a multibillion-dollar deal with OpenAI.
→ Oracle Cloud chose AMD’s graphics processing units (GPUs) for its new AI supercomputers.
→ IBM announced a breakthrough in quantum computing made possible through the use of AMD chips.
Buoyed by this wave of positive news and high expectations, AMD’s share price climbed above the psychological $250 mark (+61% since early October), reaching a record high.
Technical Analysis of AMD Stock
Price analysis shows that since April, the market has been forming a broad upward channel (shown in blue):
→ Strong news led to the correction phase (shown in red) being replaced by a resumption of the bullish trend in an aggressive manner;
→ Today, AMD’s price is testing the upper boundary of the channel.
The thickened S/R lines indicate that the angle of ascent is becoming steeper. Much now depends on today’s earnings release. Traders are awaiting confirmation from CEO Lisa Su regarding the company’s revenue forecasts tied to new deals amid the ongoing AI boom.
If bold expectations fail to materialise, a pullback could follow:
→ towards the lower thickened support line;
→ or deeper, towards the median line of the upward channel.
Alternatively, we may see the bulls attempt to break above the upper boundary and extend the blue channel higher.
This article represents the opinion of the Companies operating under the FXOpen brand only. It is not to be construed as an offer, solicitation, or recommendation with respect to products and services provided by the Companies operating under the FXOpen brand, nor is it to be considered financial advice.

Be careful with AMD!!! Likely reason for the target increase: Rapid growth in the field of artificial intelligence and strong demand for advanced chips, especially in competition with Nvidia.
So if you pay attention to the AMD chart you can see that the price has formed a Ascending Pennant which means it is expected to price move as equal as the measured price movement.( AB=CD )
NOTE: wait for break of the FLAG .

Amd - This is still not over yet!🚀Amd ( NASDAQ:AMD ) can rally another +25%:
🔎Analysis summary:
This month alone, Amd has been rallying another +50%. All of this happened because of an expected rejection at a major confluence of support. Looking at the rising channel pattern though, Amd can still rally another +25% before this rally might actually be over.
📝Levels to watch:
$300
SwingTraderPhil
SwingTrading.Simplified. | Investing.Simplified. | #LONGTERMVISION

Advanced Micro Devices, Inc. (AMD) Gearing For A BreakoutThe share price of Advanced Micro Devices, Inc. (NASDAQ: NASDAQ:AMD ) is setting sail for a 50% breakout albeit market condition is overbought.
Sitting with an RSI of 73, Advance Micro Devices (AMD) shows continuous bullish momentum with the daily price chart indicating a golden cross pattern- this is an interception between the 50day-MA and the 200-day MA indicating bullish momentum building.
In another news, - Advance Micro Devices (NASDAQ: AMD) today announced the completion of the agreement to divest the ZT Systems U.S.-headquartered data center infrastructure manufacturing business to Sanmina (NASDAQ: SANM).
About AMD
Advanced Micro Devices, Inc. operates as a semiconductor company worldwide. It operates in three segments: Data Center, Client and Gaming, and Embedded. The company offers artificial intelligence (AI) accelerators, x86 microprocessors, and graphics processing units (GPUs) as standalone devices or as incorporated into accelerated processing units, chipsets, and data center and professional GPUs; and embedded processors and semi-custom system-on-chip (SoC) products, microprocessor and SoC development services and technology.
Amd - This is just the beginning!🎈Amd ( NASDAQ:AMD ) breaks out soon:
🔎Analysis summary:
Just a couple of months ago, we witnessed a very strong bullish retest on Amd. Back then the channel continuation remained extremely likely, perfectly playing out until today. But despite the recent parabolic rise, Amd can still rally another +50% according to the chart.
📝Levels to watch:
$200 and $300
SwingTraderPhil
SwingTrading.Simplified. | Investing.Simplified. | #LONGTERMVISION

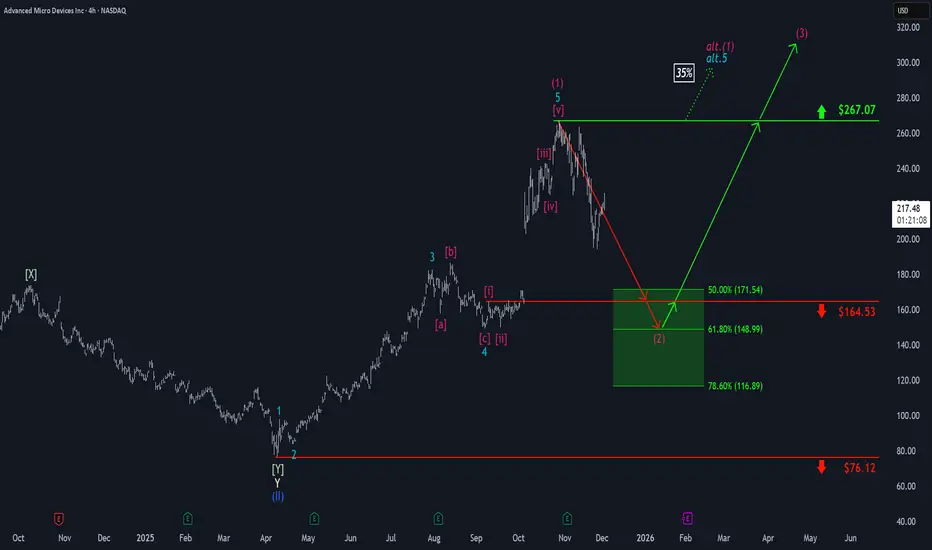
AMD: Wave [iv] Low AMD shares have recently gained upward momentum as anticipated, confirming the low of wave in magenta. In light of this, we have added a new resistance level at $223.50 to the chart. The primary outlook is for the stock to continue completing the magenta five-wave sequence to the upside, thereby finishing the larger magenta wave (1). Afterward, wave (2) is expected to pull price back toward support at $164.53. Alternatively, AMD could see a direct sell-off, which would bring the alternative wave alt.(2) to an early conclusion. In this scenario, wave alt.(1) would already be complete, with a probability of 27%.

AMD Shares Surge After Partnership Announcement with OpenAIAMD Shares Surge After Partnership Announcement with OpenAI
According to media reports:
→ The deal involves AMD supplying processors of various generations to support the deployment of artificial intelligence infrastructure with a total capacity of 6 gigawatts.
→ The partnership is expected to generate billions in revenue for AMD starting in 2026.
→ Barclays analysts have raised their price target for AMD shares from $200 to $300.
The major announcement fuelled a sharp rally of around 30% in AMD’s share price, though this surge triggered aggressive selling pressure near the historic peak around the $227 level.
Technical Analysis of AMD Stock Chart
Price action analysis shows that:
→ The trading session opened with a wide bullish gap, breaking through the key psychological level of $200.
→ The price also surpassed previous resistance levels at $180 and $190.
→ During the session, the price pulled back, forming two large bearish candles on the four-hour chart.
A reasonable interpretation:
→ The initial reaction was highly emotional, but the optimism is fading quickly.
→ The price movement indicates strong bearish activity following the sharp rise.
Selling pressure is being driven by:
→ Investors locking in substantial profits now, as the deal’s financial impact will unfold gradually over time (creating future opportunities to re-enter at lower prices).
→ Technical signs of an overbought market.
Signs that AMD shares may be overbought include:
→ The RSI indicator, which exceeded 80 yesterday.
→ The price opening significantly above the upper boundary of the ascending channel.
Possible Scenarios for AMD Stock Price
Short-term: Bearish activity could drive a correction towards:
→ The median line of the ascending channel, where demand and supply typically balance.
→ The psychological level of $200, which may influence sentiment among traders reacting to the news.
Long-term: AMD shares remain fundamentally attractive, given that:
→ The AI boom continues to serve as a major growth driver.
→ Market participants expect the Federal Reserve to begin cutting interest rates.
This article represents the opinion of the Companies operating under the FXOpen brand only. It is not to be construed as an offer, solicitation, or recommendation with respect to products and services provided by the Companies operating under the FXOpen brand, nor is it to be considered financial advice.
AMD - Bull Rush IdeaAn idea suggesting a surge in price for AMD
This is made by comparing a previous situation on chart with current (grey rectangles) within the channel in blue
This is the 3 Monthly chart for AMD which is a very long timeframe
RSI also shows a cool pattern of rise and then long stagnation then right now a sharp rise.

$AMD - Advanced Micro Device - $227.30 RetestNASDAQ:AMD continues its 2025 recovery rally — now clearing $200 and targeting the $227–$240 macro resistance zone.
After reclaiming the $165 structure break, AMD has re-entered its long-term ascending channel and is showing renewed strength in the AI-chip cycle.
Holding above $190 keeps this setup intact for continuation.
#AMD #AIStocks #Semiconductors #NASDAQ #BreakoutTrading #MyMIWallet
Advanced Micro Devices | AMD | Long at $126.00Advanced Micro Devices NASDAQ:AMD may be the sleeping giant in the semiconductor / AI space. While all eyes on NVidia NASDAQ:NVDA , earnings for NASDAQ:AMD grew by 800% over the past year... and are now forecast to grow 40% per year. Any other company would be soaring right now (like NVidia), but that company is getting all the attention. And, to me, this means opportunity for the future. The cashflow is likely to grow tremendously for
NASDAQ:AMD into 2027 and beyond, which may inevitably reward investors with dividends.
From a technical analysis perspective, NASDAQ:AMD just entered my historical simple moving average zone. This area (currently $108-$126) is where I will be gathering shares. Something tremendous would have to change regarding the fundamentals of this company (like a scandal) for the overall thesis to change. There may be some near-term price pains as NVidia gets all the focus, but to meet demand in the semiconductor and AI space, NASDAQ:AMD is poised to fulfill that roll in the future.
Target #1 = $158.00
Target #2 = $175.00
Target #3 = $188.00
Target #4 = $205.00

Amd - The path is too clear!🪓Amd ( NASDAQ:AMD ) will rally another +75%:
🔎Analysis summary:
For the past five years, Amd has been trading in a simple rising channel formation. With the recent retest of a major confluence of support, Amd once again confirmed the bullish trend. Following those previous cycles, Amd will now break the all time high and rally another +75% from here.
📝Levels to watch:
$200
SwingTraderPhil
SwingTrading.Simplified. | Investing.Simplified. | #LONGTERMVISION
