AMPUSDT — Accumulation at Demand Zone, Preparing for Breakout?🔎 Full Analysis
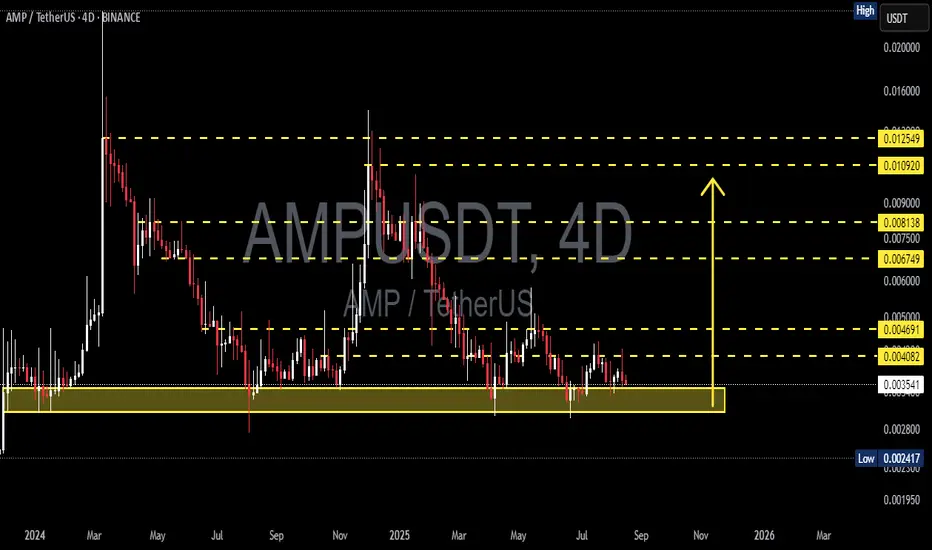
Currently, AMP/USDT is consolidating within a long-term accumulation range above the 0.00315 – 0.00360 demand zone (yellow box). This area has been tested multiple times since early 2024 but remains intact, signaling strong buying interest and accumulation.
The price action is forming a rectangle range pattern, with shrinking volatility — a typical sign that the market is storing energy before a major breakout move in either direction.
---
🧩 Market Structure & Pattern
Main Pattern: Rectangle Base / Accumulation
Key Observations:
Strong demand around 0.00315 – 0.00360
Multiple “equal lows” → liquidity build-up
Nearest resistance: 0.00408 and 0.00469
Interpretation: As long as the demand zone holds, the bullish reversal scenario remains on the table.
---
📈 Bullish Scenario
1. Initial Confirmation: Holding above 0.00354 and securing a 4D close above 0.00408 will trigger the first bullish signal.
2. Breakout Validation: A strong close above 0.00469 opens the door for higher targets:
🎯 0.00675 (short-term target)
🎯 0.00750 – 0.00814 (major supply zone)
🎯 0.01092 → 0.01255 (mid-term rally target)
3. Measured Move Projection: The range height (0.00354 → 0.00469 ≈ 0.00115) projects a conservative breakout target near 0.00585.
---
📉 Bearish Scenario
1. Rejection: Failure to reclaim 0.00408 – 0.00469 will keep the market sideways with bearish pressure building.
2. Breakdown: A 4D close below 0.00354 confirms a bearish breakdown.
3. Downside Targets:
⚠️ 0.00242 (major support, marked “Low”)
⚠️ Below this level, the next psychological target sits around 0.00200.
---
🎯 Outlook & Conclusion
Current Bias: Neutral → Bullish as long as demand zone holds.
The 0.00315 – 0.00360 zone remains the last defense and major accumulation area.
Breakout above 0.00469 could spark a strong impulsive rally.
Breakdown below 0.00315 invalidates the bullish view, shifting focus to 0.00242 – 0.00200.
> 📌 Note: Wait for 4D candle close for validation — wicks alone are not reliable. Watch volume to confirm breakout strength and avoid fakeouts.
#AMP #AMPUSDT #CryptoAnalysis #PriceAction #SupportResistance #Breakout #Accumulation #AltcoinAnalysis #CryptoTrading #TechnicalAnalysis
Ampusdlong
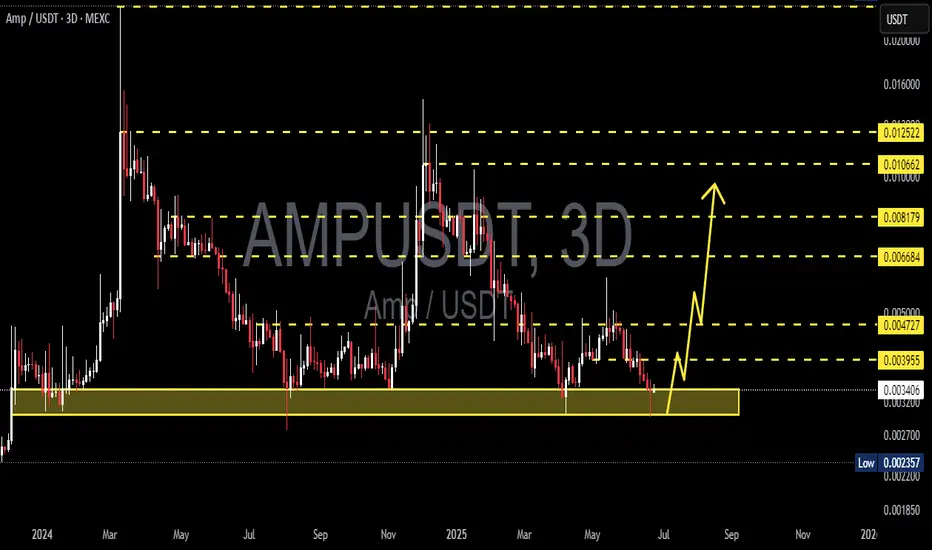
AMPUSDT 3D AnalysisAMP ~ 3D Analysis
#AMP Buy back gradually from here with a short term target of at least 15%+ from this support.
AMPUSDT 1D AnalysisAMP ~ 1D Analysis
#AMP This trade is very high risk
Buy gradually after successfully breaking through this resistance line with a short-term target of at least 10%++

AMPUSDT 1WAMP ~ 1W Analysis
#AMP Buy gradually from here if you still have a Conviction on this Coin. This is support that holds prices not to fall even lower.

AMPUSDT 3DAMP ~ 3D Analysis
#AMP If you still have a Conviction on this Coin, Maybe this support is very good to start buying. Short -term target 20%+

AMP BreakoutHi Guys
Amp on weekly chart looks good, as u see RSI breakout the trend line and it is a good sign to preform a bullish move and uptrend.
Targets on Chart.
PLZ DYOR.
Disclaimer: This article is for informational purposes only and not financial advice. Conduct thorough research and consult with professionals before making investment decisions.
Good luck.

$AMP can we see $100%+ run from here?I'm updating my target to the upside bc I think we run higher than the $.00546 resistance. Think we end up towards the $.008 range. One of the top two resistances.
As you can see we've been consolidating in a bull flag since early December, we've recently broken out and price has been hovering above it.
Looking for a final move that takes us around 100% higher.

AMP token formed bullish Gartley for upto 10% pumpHi dear friends, hope you are well and welcome to the new update on AMP token with US Dollar pair.
Previously we caught a nice trade of AMP as below:
Now a 2-hr time frame, AMP has formed a bullish Gartley pattern for the next price reversal.
Note: Above idea is for educational purpose only. It is advised to diversify and strictly follow the stop loss, and don't get stuck with trade

AMP token forming bullish BAT for another price reversal moveHi dear friends , hope you are well and welcome to the new update on AMP token with US Dollar pair.
On a 2-hr time frame, AMP is about to complete the final leg of a bullish BAT move for another price reversal.
Note: Above idea is for educational purpose only. It is advised to diversify and strictly follow the stop loss, and don't get stuck with trade

AMP token formed bullish Gartley for upto 61% rallyHi dear friends, hope you are well and welcome to the new update on AMP token with US Dollar pair.
On a 4-hr time frame, AMP has formed a bullish Gartley move.
Note: Above idea is for educational purpose only. It is advised to diversify and strictly follow the stop loss, and don't get stuck with trade

$Amp #ampusd #elliottwave Buy Setup.This count is based on my assumptions so anything can happen not a trading or financial advice just for educational purposes only kindly do your own ta thanks trade with care good luck.

$Ampusd long trade setup #elliottwave This count is based on my assumptions so anything can happen not a trading or financial advice just for educational purposes only kindly do your own ta thanks trade with care good luck.

$AMP bottoming structure -- levels to the upsideAMP looks to be forming a bottom. Upon zooming out, you can see that we just broke a downtrend and we're starting to form a base that can take $AMP higher.
I've marked off key resistances to the upside. Let's see how hight it can go.

AMPUSDT: ADDITIONAL 55% TP INBOUND MTFSubscribe & Follow For:
➞ Quick Chart Summary Breakdown
➞ Pertinent Supply Demand Zones and Considerations
➞ US Stocks / Crypto Only
➞ Before / After Analysis
🌙 Like and Subscribe
🌙 Drop us a line and let us know what you think
🌙 Coin donations always appreciated
📊 The Trade Setup
➞ NOT FINANCIAL ADVISE
➞ First glance look
➞ Buyable XABCD on hourly
➞ Big breakout potential w/ additional 55% upside
➞ Will revisit above .10 for potential continuation
📊 Additional Considerations
➞ Big demand candle @ . 05
➞ Strong BULLISH sediment
➞ Reclaimed long term support line on the big with massive volume
RISK DISCLAIMER:
Trading Crypto, Futures , Forex, CFDs and Stocks involves a risk of loss.
Please consider carefully if such trading is appropriate for you.
Past performance is not indicative of future results.
Not financial advise. Trade at your own discretion.

AMPUSD Daily TimeframeSNIPER STRATEGY (new version)
It works ALMOST ON ANY CHART.
It produces Weak, Medium and Strong signals based on consisting elements.
NOT ALL TARGETS CAN BE ACHIEVED, let's make that clear.
TARGETS OR ENTRY PRICES ARE STRONG SUPPORT AND RESISTANCE LEVELS SO THEY CAN ACT LIKE PIVOT POINTS AND REVERSE THE WAVE (or act like a mirror that can reflects light) BASED ON STRENGTH OF THAT LEVEL.
ENTRY PRICE BLACK COLOR
MOST PROBABLE SCENARIOS TARGETS GREEN COLOR
LEAST PROBABLE SCENARIOS TARGETS RED COLOR
TARGETS ARE NOT EXACT NUMBERS THEY ARE MORE LIKE A ZONE.
DO NOT USE THIS STROTEGY FOR LEVERAGED TRADING.
It will not give you the whole wave like any other strategy out there but it will give you a huge part of the wave.
The BEST TIMEFRAMES for this strategy are Daily, Weekly and Monthly however it can work on any timeframe.
Consider those points and you will have a huge advantage in the market.
There is a lot more about this strategy.
It can predict possible target and also give you almost exact buy or sell time on the spot.
I am developing it even more so stay tuned and start to follow me for more signals and forecasts.
START BELIEVING AND GOOD LUCK
HADIMOZAYAN
