Only a matter of timeAmp got rejected directly from my trendline but I think it will break out soon. It is already really low I’m buying a lot.
Key stats
About Amp


AMP refuel complete? Time to hop back on the rocket?Time to revisit my favorite pink coin. AMP had a parabolic run that took place from October 23 2023 to March 11 2024. Since the high at .01682 we've had quite a sharp rejection and finally found support at .00568 on April 08 2024. Now let's dig into what could come next.
Bullish white trend line:F

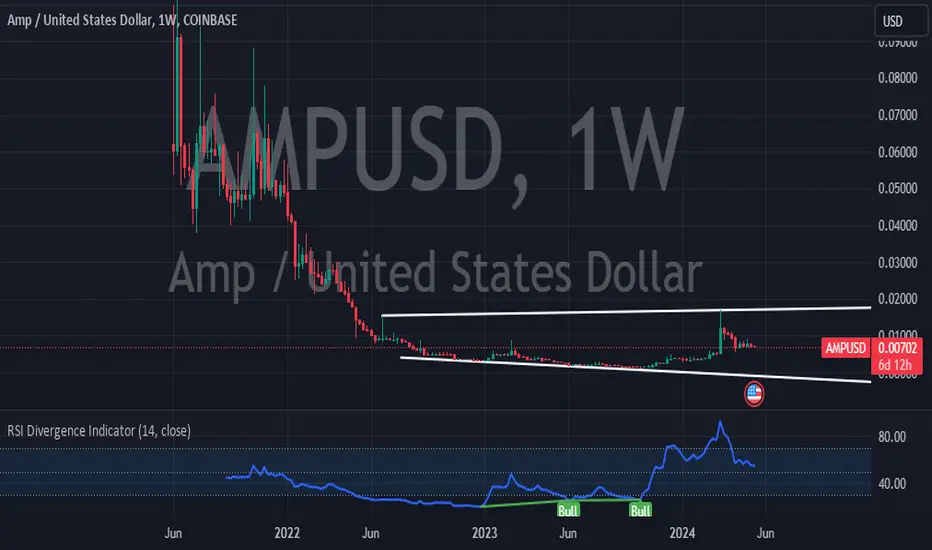
$AMP gearing up for a 10X moveNYSE:AMP has been in a downtrend and consolidating for a long time and looks like it's set to finally break out.
Once we see a breakout of that first resistance, clear skies ahead to the final resistance at the top.

$AMP/USDNot financial advice.
$AMP/USD
forming a long base and still stuck in the middle of this broadening formation. it can turn either way.
Like and subscribe for more ideas.
Thanks.
AMP wait for the breakout of RSI or price trendlinelong-term on log scale AMP has dropped ~ 70%.
This is a significant drop and not very promising of continuation as a 2nd wave given it broke the 1st wave of previous degree.
I suggest waiting to buy any of this token until it either crosses the RSI resistance trend line on the weekly
or it cros

stil alll good patience is key with amplets seee how we roll the coming days i bought the dip and wil buy more at the underline i dont expect to falll under it so let the rockets fly in april

AMP THERE IT IS!Amp is back in the green and ready to rumble.
Unveiling AMP Coin: Exploring Its Journey and Potential in the Crypto Space
In the dynamic world of cryptocurrency, where innovation and evolution are constant, AMP Coin has emerged as a fascinating player. With its unique approach to collateralization

AMP-USD | Beautiful Cycles | LONG AFAmp is an open-source, decentralized protocol that provides collateral as a service. Amp is described as the new digital collateral token offering instant, verifiable assurances for any kind of value transfer. Using Amp, networks like Flexa can quickly and irreversibly secure transactions for a wide

Woah! AMP Token up 661% in 6 months!Let me start by saying AMP I love you! I'm beyond grateful! BUT in my humble opinion this move is just starting! Let's take a look at the monthly time frame(all drawing tools have been plotted on the weekly time frame. forgive the mess).
AMP up 661% over the past 60 days, bazaar right! We haven't

See all ideas
Curated watchlists where AMPUSD is featured.

Frequently Asked Questions
The current price of Amp (AMP) is 0.00429 USD — it has fallen 0.69% in the past 24 hours. Try placing this info into the context by checking out what coins are also gaining and losing at the moment and seeing AMP price chart.
The current market capitalization of Amp (AMP) is 181.16 M USD. To see this number in a context check out our list of crypto coins ranked by their market caps or see crypto market cap charts.
Amp (AMP) trading volume in 24 hours is 7.60 M USD. See how often other coins are traded in this list.
Amp price has fallen by 6.74% over the last week, its month performance shows a 10.81% decrease, and as for the last year, Amp has increased by 84.12%. See more dynamics on AMP price chart.
Keep track of coins' changes with our Crypto heatmap.
Keep track of coins' changes with our Crypto heatmap.
Amp (AMP) reached its highest price on Jun 16, 2021 — it amounted to 0.12300 USD. Find more insights on the AMP price chart.
See the list of crypto gainers and choose what best fits your strategy.
See the list of crypto gainers and choose what best fits your strategy.
Amp (AMP) reached the lowest price of 0.00140 USD on Oct 19, 2023. View more Amp dynamics on the price chart.
See the list of crypto losers to find unexpected opportunities.
See the list of crypto losers to find unexpected opportunities.
The current circulating supply of Amp (AMP) is 99.21 B USD. To get a wider picture you can check out our list of coins with the highest circulating supply, as well as the ones with the lowest number of tokens in circulation.
The safest choice when buying AMP is to go to a well-known crypto exchange. Some of the popular names are Binance, Coinbase, Kraken. But you'll have to find a reliable broker and create an account first. You can trade AMP right from TradingView charts — just choose a broker and connect to your account.
Crypto markets are famous for their volatility, so one should study all the available stats before adding crypto assets to their portfolio. Very often it's technical analysis that comes in handy. We prepared technical ratings for Amp (AMP): today its technical analysis shows the sell signal, and according to the 1 week rating AMP shows the sell signal. And you'd better dig deeper and study 1 month rating too — it's sell. Find inspiration in Amp trading ideas and keep track of what's moving crypto markets with our crypto news feed.
Amp (AMP) is just as reliable as any other crypto asset — this corner of the world market is highly volatile. Today, for instance, Amp is estimated as 1.41% volatile. The only thing it means is that you must prepare and examine all available information before making a decision. And if you're not sure about Amp, you can find more inspiration in our curated watchlists.
You can discuss Amp (AMP) with other users in our public chats, Minds or in the comments to Ideas.