Stock Market Forecast | BTC TSLA NVDA AAPL AMZN META MSFTStock Market Forecast | CRYPTOCAP:BTC TSLA NVDA AAPL AMZN META MSFT
SP:SPX CME_MINI:ES1! CME_MINI:NQ1!
Weekly stock market analysis covering the S&P 500 (SPY), Nasdaq 100 (QQQ), Bitcoin (BTC), and major large-cap stocks. In this video, we break down technical charts, key support and resistance levels, sector rotation, market sentiment, dark pool activity, earnings, and macroeconomic data to identify high-probability market scenarios for the week ahead.
Timestamps are included below so you can jump directly to specific tickers and chart analysis.
0:00 Intro & Market Overview
0:58 Sector & Sentiment Data
2:10 MAG 7 ETF / Dark Pools
5:12 ARK / Innovation & Small Caps
6:34 Earnings & Economic Calendar
8:44 S&P 500 (SPY)
12:12 Nasdaq 100 (QQQ)
15:22 Bitcoin (BTC)
22:15 Tesla (TSLA)
25:00 Meta (META)
26:30 Amazon (AMZN)
28:00 Microsoft (MSFT)
32:58 Google (GOOGL)
36:27 Apple (AAPL)
39:38 Nvidia (NVDA)
42:40 Outro
AMZN

Amazon - A quite boring new all time high!🎈Amazon ( NASDAQ:AMZN ) is simply heading for new highs:
🔎Analysis summary:
For the past couple of months, Amazon has overall just been consolidating. But in the meantime, we witnessed a major bullish break and retest and an expected rally of +50%. Following this quite slow behavior, Amazon will also slowly create new highs.
📝Levels to watch:
$250
SwingTraderPhil
SwingTrading.Simplified. | Investing.Simplified. | #LONGTERMVISION

AMAZON Can it correct to $150?Amazon (AMZN) has stalled its massive rally since the April 2025 Low as since November 03 it has been unable to make a new All Time High (ATH). That is because that day it hit a key Resistance, its 5-year Higher Highs trend-line, technically the top of its long-term Channel Up.
The resulting correction found Support on its long-term level o 1W MA50 (red trend-line), which has been holding firmly since mid may 2025. Given the similar 1W RSI Bearish Divergence to 2021, we believe the market has already topped and will start a new Bear Cycle correction. But in order for this to be confirmed, the price needs to close its first 1W candle below the 1W MA50.
If that takes place, we expect a first sell-off towards the 1W MA200 (orange trend-line) and then after a rebound, bearish continuation to at least the 1M MA100 (blue trend-line), which is where the previous Bear Cycle bottomed in late December 2022. Based on its current trajectory, we see a potential contact at $150.
Note that a full Bear Cycle, similar to 2022 (which is only realistic if the stock closes a month (1M candle) below the 1M MA100, as it has been holding since November 2026!), could lead us to a total -57% correction, a little below $115.
---
** Please LIKE 👍, FOLLOW ✅, SHARE 🙌 and COMMENT ✍ if you enjoy this idea! Also share your ideas and charts in the comments section below! This is best way to keep it relevant, support us, keep the content here free and allow the idea to reach as many people as possible. **
---
💸💸💸💸💸💸
👇 👇 👇 👇 👇 👇

Amazon: Momentum ShiftIn the first weeks of the year, Amazon's stock continued its upward trajectory. However, this upward momentum came to a halt last Tuesday. Since then, the bears have taken charge and thus align more closely with our primary scenario, which calls for the current downtrend to persist, with the low of the beige wave IV forming just above the support at $160.50. Afterward, we anticipate an upward movement in the same-colored wave V, which should eventually lead to the peak of the larger blue wave (V). Our alternative scenario, however, suggests that the stock could directly break through the resistance at $259. In this case, we would consider the low of the beige wave alt.IV as already established (probability: 33%).

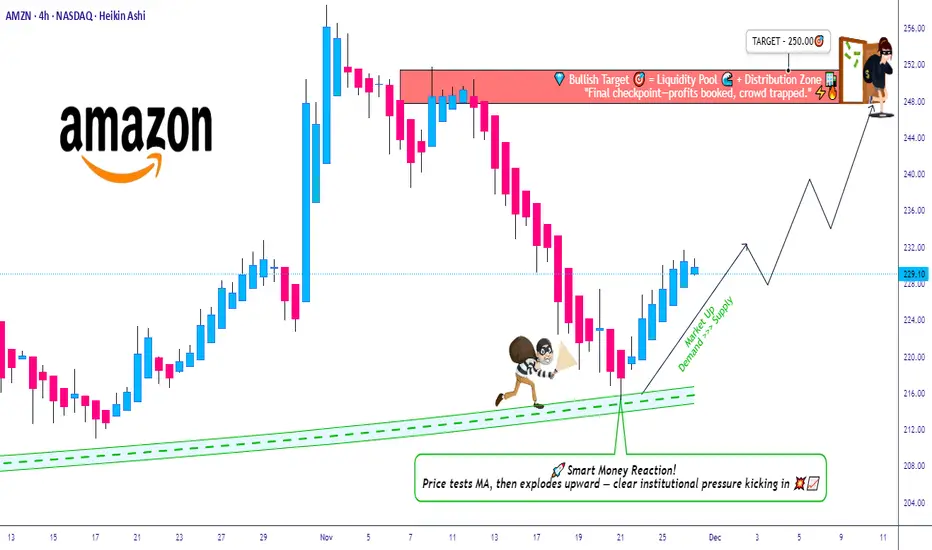
AMZN Breakout Reload? TMA Pullback Shows Buyer Strength🔥 AMZN Swing Trade Profit Playbook | Bullish Pullback + Thief Layering Strategy 🟢📦
Welcome back, Ladies & Gentlemen — the Thief OG’s 😎🕵️♂️
Here’s a polished, rule-friendly breakdown of the bullish setup developing on AMZN (Amazon.com Inc.) – NASDAQ.
📌 Market Context
AMZN is showing a clean bullish pullback into the Triangular Moving Average (TMA) zone, supported by a Heikin Ashi Doji Reversal, signaling that buyers are gaining strength and attempting to dominate momentum again. 📈🔥
🧠 Trade Plan (Swing Trade)
Plan:
A bullish pullback strategy confirmed by:
🔺 Triangular Moving Average pullback reaction
🟩 Heikin Ashi reversal-doji indicating potential trend continuation
📊 Buyers stepping in with momentum recovery
🎯 Entry Plan – Thief Style Layering (Multiple Limit Orders)
This is the famous Thief Strategy — using layered limit orders to scale into the move like a master of stealth 😎🕵️♂️💼
(TradingView-safe version: purely educational, optional, trade at your own risk.)
Layered Buy Limits:
🟢 215.00
🟢 220.00
🟢 225.00
🟢 230.00
(You may increase or adjust layers based on your own style and risk tolerance.)
🛑 Stop-Loss (Thief Style Educational Version)
SL Zone (Optional):
❌ 210.00
⚠️ Note: Dear Ladies & Gentlemen (Thief OG’s), this level is NOT a recommendation — it’s just part of the thief-style educational breakdown.
Choose your own risk plan, trade your own analysis.
🎯 Target Zone
The “Police Force” 🚓 — aka strong resistance, potential overbought zone, and liquidity trap area — sits around:
🟡 Target @ 250.00
⚠️ Note: Dear Ladies & Gentlemen (Thief OG’s), this is NOT a fixed TP recommendation.
Manage your profits as per your own risk appetite and strategy.
📡 Related Pairs to Watch (Correlation & Market Behavior)
Watching correlated tickers helps understand broader tech-sector sentiment and liquidity rotation.
Here are the key names to keep an eye on:
📌 NASDAQ:AAPL (Apple Inc.)
Strong correlation with AMZN in tech-momentum cycles.
When AAPL shows bullish continuation, AMZN often follows with similar pressure.
📌 NASDAQ:META (Meta Platforms Inc.)
Tracks consumer-tech spending sentiment.
Strong META moves can hint at acceleration across NASDAQ growth stocks.
📌 NASDAQ:MSFT (Microsoft Corp.)
A heavyweight pillar in NASDAQ.
MSFT strength boosts overall tech-index bullish bias.
📌 NASDAQ:QQQ (Invesco NASDAQ-100 ETF)
The main sentiment gauge.
If QQQ remains above its trend structure, AMZN's bullish continuation gets stronger confirmation.
📌 NASDAQ:TSLA (Tesla Inc.)
Not directly correlated, but impacts NASDAQ volatility dynamics.
High volatility in TSLA often ripples into liquidity behavior across the index.
💬 Final Thoughts
This AMZN setup blends structure, momentum, and multi-layer entries, crafted in a fun Thief-style teaching format while keeping everything compliant and research-focused 📚✨
Trade smart, manage risk, escape with profits when the “police” show up 🚓😆📈
✨ “If you find value in my analysis, a 👍 and 🚀 boost is much appreciated — it helps me share more setups with the community!”
⚠️ Disclaimer
This is a Thief-style trading strategy presented just for fun & educational purposes only.
Not financial advice. Do your own analysis and manage risk responsibly.
#AMZN #Amazon #SwingTrade #NASDAQ #BullishSetup #PullbackStrategy #HeikinAshi #TriangularMovingAverage #ThiefStrategy #LayeringEntries #TradingEducation #StockMarket #MarketAnalysis #TradingViewCommunity #EditorPickReady 🚀
Stock Market Forecast | BTC TSLA NVDA AAPL AMZN META MSFT0:00 Intro & Overview
0:22 Sector Data & Sentiment
2:42 Dark Pools (RSP & MAG7)
6:44 S&P 500 (SPY)
9:21 Nasdaq 100 (QQQ)
11:37 Bitcoin (BTC)
15:04 Tesla (TSLA)
18:17 Meta (META)
22:03 Amazon (AMZN)
23:25 Microsoft (MSFT)
26:54 Google (GOOGL)
31:16 Apple (AAPL)
34:58 Nvidia (NVDA)
37:26 Outro
Stock Market Forecast | BTC TSLA NVDA AAPL AMZN META MSFT
SP:SPX AMEX:SPY CME_MINI:ES1! CME_MINI:NQ1!

Stock Market Forecast | BTC TSLA NVDA AAPL AMZN META MSFT0:00 Intro
0:19 Sector Data
0:44 Sentiment Data
1:38 Dark Pools (Mag 7 ETF)
5:10 S&P 500 (SPY)
7:12 Nasdaq 100 (QQQ)
10:46 Bitcoin (BTC)
13:44 Tesla (TSLA)
16:39 Meta (META)
18:16 Amazon (AMZN)
19:11 Microsoft (MSFT)
21:35 Apple (AAPL)
23:55 Nvidia (NVDA)
26:06 Outro
QQQ stock market Forecast
Nvidia Stock NVDA Forecast
Apple Stock AAPL Forecast
Microsoft Stock MSFT Forecast
Google Stock GOOGL Forecast
Amazon Stock AMZN Forecast
Meta Forecast Technical Analysis
Tesla Stock TSLA Forecast
Magnificent 7 stocks forecast
Bitcoin BTC forecast
CRYPTOCAP:BTC SP:SPX NASDAQ:NDX NYMEX:NG1!
#daytrading #btc #stockmarketanalysis #nvda #tsla #aapl #msft #technicalanalysis #stockmarketeducation #mag7

New All Time Highs - Bullish Price ActionToday the S&P500 made new all time highs.
It was a perfect breakout trend day and breakout.
Today we were able to trim and take profits on some of our long exposure.
We trimmed and sold NASDAQ:AMZN NYSE:SNAP NASDAQ:TEM NYSE:SMR
When the market is giving you all time highs and higher highs its always a good time to pair back longs.
Tomorrow we have some employment data that could gap the market higher.
If we can confirm a weekly chart breakout the probabilities of hitting 7k on spx is very likely.

$AMZN Breaking out!- NASDAQ:AMZN is breaking out from the triangular symmetric wedge!
- Bullish for amazon!

AMAZON - EMA 200: Where Institutions Step InAMZN - CURRENT PRICE : 237.70
📈 AMZN — Institutional Support Holds, Momentum Breakout
AMZN continues to trade in a primary uptrend, with EMA 200 acting as a strong institutional accumulation zone. Multiple pullbacks toward the EMA 200 (highlighted in green) were met with immediate buying interest, confirming long-term demand.
Momentum is now turning bullish:
🔥Price has broken back above the Ichimoku Cloud, signaling trend resumption.
🔥RSI is crossing above the 60 level, a classic sign of bullish momentum acceleration.
This setup favors momentum traders looking to enter as the uptrend resumes.
ENTRY PRICE : 235.00 - 237.80
TARGET : 258.00 (All Time High level)
SUPPORT / INVALIDATION : EMA 200
📌 As long as price holds above EMA 200, the bullish structure remains intact.

Amazon: Persistent Upward PressureAmazon initially continued its upward trajectory, extending the rise until January 2. There was a brief pullback of about 4% afterward, but it was quickly recovered. Consequently, price again reached the levels observed before the holiday season. In line with our primary scenario, we expect price to turn downward to carve out the final low of the beige wave IV. Ideally, this bottom should be formed above the support at $160.50. Subsequently, wave V should unfold and continue the overall upward trend. However, if Amazon breaks directly above the resistance at $259, it could suggest that the low of wave alt.IV in beige has already been established. The probability of this alternative scenario is 33%.

Amazon $AMZN weekly demand level at $221 is holdingAmazon weekly demand level at $221 is holding as expected. Amazon stock is trying to to print a new weekly high. Any long positions should be managed. Waiting for new imbalances and weekly highs.

AMZN: Rebuilding Structure After Sharp RotationOn the 4H chart, AMZN shows a sharp impulsive move followed by a volatile pullback and stabilisation. Price is now rebuilding structure after the rotation, suggesting the market is recalibrating before the next directional phase develops.
Disclosure: We are part of Trade Nation's Influencer program and receive a monthly fee for using their TradingView charts in our analysis.

Stock Market Forecast | BTC TSLA NVDA AAPL AMZN META MSFTQQQ stock market Forecast
Nvidia Stock NVDA Forecast
Apple Stock AAPL Forecast
Microsoft Stock MSFT Forecast
Google Stock GOOGL Forecast
Amazon Stock AMZN Forecast
Meta Forecast Technical Analysis
Tesla Stock TSLA Forecast
Magnificent 7 stocks forecast
Bitcoin CRYPTOCAP:BTC forecast
SP:SPX NASDAQ:NDX CME_MINI:NQ1! CME_MINI:ES1!

AMZN: Technical Outlook and New Year TargetsNASDAQ:AMZN : Technical Outlook and New Year Targets
Following its recent all-time high (ATH) near $260, Amazon (AMZN) has entered a corrective phase, currently trading around the $230 level.
This retracement raises two key questions for the coming months: how deep will this pullback go, and what are the primary targets for investors heading into 2026?
Technical Analysis and Key Levels.
The current price action suggests a healthy cooling-off period after a significant rally. From a technical perspective, there are two primary scenarios to monitor:
Scenario A:
Retest of the Ascending Trendline The stock may continue its gradual descent toward the primary ascending trendline. This support zone, located approximately between $220 and $223, represents a high-confluence area where long-term buying pressure has historically resumed.
Scenario B: Immediate Support Defense Alternatively, the bulls may defend the current $230 psychological level. If buyers show strength here, it would indicate a shallow correction before a move back toward previous highs.
Strategy and Risk Management.
For those looking to build or add to a position, the $220 – $223 zone offers a compelling risk-to-reward ratio.
Upside Targets:
The initial objective remains a retest of the $260 ATH. If momentum continues, the next major psychological extension sits at $300.
Risk Mitigation:
While this analysis focuses on a mid-to-long-term horizon, active traders might consider the $200 zone as a critical area for a stop-loss, as a break below this level could invalidate the current bullish structure.
Disclaimer
This analysis is for educational and informational purposes only and does not constitute financial or investment advice. Trading involves significant risk, and you should consult with a professional advisor before making any financial decisions.

APPL (APPLE) BUY IDEAAPPL (APPLE) BUY IDEA
📊 Market Sentiment
Market sentiment is bullish, driven by expectations of the FED’s potential rate cut in December. In addition, Trump’s likely nominee for the new FED Chair is Kevin Hassett a strong supporter of aggressive rate cuts.
This possibility has pushed markets higher as participants began pricing in earlier and more aggressive cuts for 2026.
📈 Technical Analysis
AAPL remains one of the most bullish stocks in the U.S. market. All higher timeframes are strongly bullish.
We are currently seeing a retracement from recent all time highs, which in my opinion is simply a healthy pullback to build momentum for higher prices.
📌 Game Plan
I have two key Points of Interest for potential long entries. Both support a bullish continuation thesis, and I do not expect a major bearish shift for AAPL anytime soon.
Scenario 1:
Price taps 276.25 and bounces.
I will wait for a daily bullish close to confirm the continuation.
Scenario 2:
Price dips into 271 and bounces.
I will again look for a daily bullish close as confirmation.
Note:
The FED’s rate decision will be released on Wednesday at 2 PM.
Until then, I expect price to potentially move into an accumulation or range phase.
If I see strong movement earlier in the week, I won’t hesitate to take a long position.
💬 For deeper sentiment and strategy insights, subscribe to my Substack free access available.
⚠️ This analysis is for educational purposes only and does not constitute financial advice. Always conduct your own research before trading or investing.

Stock Market Forecast | BTC TSLA NVDA AAPL AMZN META MSFTQQQ stock market Forecast CME_MINI:ES1! SP:SPX NASDAQ:NDX
Nvidia Stock NVDA Forecast
Apple Stock AAPL Forecast
Microsoft Stock MSFT Forecast
Google Stock GOOGL Forecast
Amazon Stock AMZN Forecast
Meta Forecast Technical Analysis
Tesla Stock TSLA Forecast
Magnificent 7 stocks forecast
Bitcoin CRYPTOCAP:BTC forecast

Stock Market Forecast | BTC TSLA NVDA AAPL AMZN META MSFTQQQ stock market Forecast
Nvidia Stock NVDA Forecast
Apple Stock AAPL Forecast
Microsoft Stock MSFT Forecast
Google Stock GOOGL Forecast
Amazon Stock AMZN Forecast
Meta Forecast Technical Analysis
Tesla Stock TSLA Forecast
Magnificent 7 stocks forecast
Bitcoin CRYPTOCAP:BTC forecast
SP:SPX NASDAQ:NDX CME_MINI:ES1!

Amazon stock weekly demand is still in controlAmazon stock weekly demand at $221 is still in control and is trying to play out as expected. Any long positions should be managed. Let's see if there any new bullish legs printed in the following days.

$Amzn Are You Finished or Are you Done? S/O to Birdmard just because I love that wild ass statement; Lol.
So I've been on NASDAQ:AMZN for a week now and I Learned a Lesson from it last week wicking 1.272 action. So I'm back to perhaps call it from the bottom of where its at currently. But check this is out, I generally only have my fibs to show on the level I chart on, (I dont want to see it on another time frame.) Well, this morning; I guess I hadn't turned my motor all the way on and I read my 1 HR fibs on the 15 mins and got into some 225 Amazon calls only to realize that this is my 1 Hr TF fibs not the 15 mins (Which is what I trade every day). So, this NASDAQ:AMZN Chart Image is Charted on the 1 HR TIME FRAME, but the Image I posted is on the 15 min TF. #Calls
Happy Trading, Alerts Set!

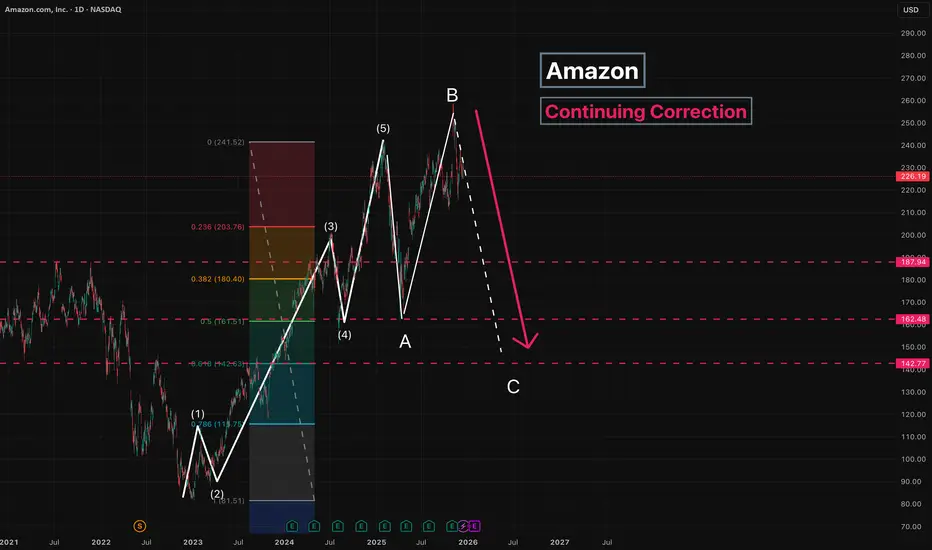
Amazon - Continuing CorrectionThe correction is ongoing, and wave C has started to form.
Since wave B is longer than wave A , wave C is expected to move below the low of wave A .
Main target: 142
Intermediate target: 187
---
Please subscribe and leave a comment.
You’ll get new information faster than anyone else.
---
Stock Market Forecast | BTC TSLA NVDA AAPL AMZN META MSFTStock Market Forecast | CRYPTOCAP:BTC CME_MINI:ES1! CME_MINI:NQ1! SP:SPX
Mag 7 | TSLA NVDA AAPL AMZN META MSFT GOOGL

AMAZON 's new Bear Cycle targets $125. And it can make you rich.Amazon Inc. (AMZN) has been trading within a massive 24-year Channel Up ever since its October 2001 bottom of the Dotcom crash. This pattern, as you can see, has been following a very distinct structure with its 1M MA100 (green trend-line) being the major Support level (and providing the most efficient buy opportunities) since November 2006.
What stands out here is the period from late 2020 until today and how it resembles the one from late 2003 to late 2007. Both traded under multi-year Higher Highs trend-lines and in October 2007 that formed a Top, causing a 2nd correction within that time-frame that bottomed once it hit the 1M MA100 within the Support Zone of the previous consolidation phase.
Today's fractal has already made the 1st correction in 2022, which not surprisingly also bottomed on the 1M MA100 and kick-started the rally towards the Higher Highs trend-line again. We are now at the point where there are high probabilities that the 2nd correction will take place.
If the market continues to follow the past pattern, we expect Amazon to bottom below the 1M MA100 this time and at the bottom of the Support Zone within the $130.00 - $125.00 range. This will make an ideal Higher Low right at the bottom of the 24-year Channel Up.
So what can make you rich on this? Making a long-term buy of course and keeping it until 2030 - 2032 as the new Bullish Leg that will start, will effectively be the new Bull Cycle. And as this chart shows, these Cycles have had similar rises, with the 'weakest' one being +1037%.
---
** Please LIKE 👍, FOLLOW ✅, SHARE 🙌 and COMMENT ✍ if you enjoy this idea! Also share your ideas and charts in the comments section below! This is best way to keep it relevant, support us, keep the content here free and allow the idea to reach as many people as possible. **
---
💸💸💸💸💸💸
👇 👇 👇 👇 👇 👇
